


 |
市场调查报告书
商品编码
1851380
甲醇:市场占有率分析、产业趋势、统计数据和成长预测(2025-2030 年)Methanol - Market Share Analysis, Industry Trends & Statistics, Growth Forecasts (2025 - 2030) |
||||||
※ 本网页内容可能与最新版本有所差异。详细情况请与我们联繫。
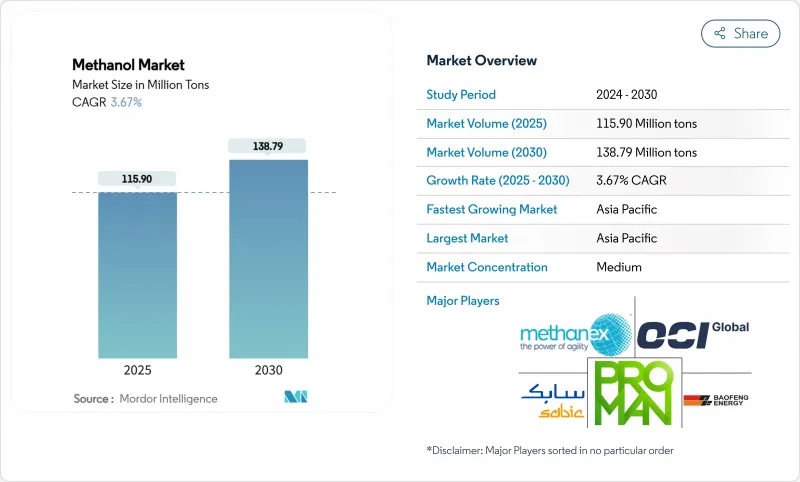
预计到 2025 年甲醇市场规模将达到 1.159 亿吨,到 2030 年将达到 1.3879 亿吨,在预测期(2025-2030 年)内复合年增长率为 3.67%。
整体数据掩盖了区域差异:大西洋盆地的价格在计划外停产后保持坚挺,而亚洲现货价格走软,扩大了交易者的套利空间。中国不断扩大的甲醇制烯烃(MTO)产能、北美「超大型」工厂以及激增的船用燃料需求,共同支撑了市场成长。可再生甲醇计划具有巨大的成长潜力,但认证延迟和基础设施缺口限制了近期供应的扩张。然而,对低碳生产和船用转化技术的持续投资,将支撑甲醇市场在中期内保持稳定发展。
全球甲醇市场趋势与洞察
中国、美国和新兴亚洲地区的石化产能扩张
随着炼油厂转向化工原料,甲醇需求不断成长。中国综合炼油厂预计2024年原油加工能力将达到创纪录的1,480万桶/日。同时,美国正在建造「超大型」甲醇工厂,以供应中国的甲醇製油(MTO)装置,从而形成一条跨太平洋价值链,这将改变传统的贸易格局。新兴亚洲生产商正在效仿这一模式,多个煤製甲醇项目正在建设中。这些计划将共同提升该地区的甲醇自给率,同时也将需求成长与甲醇市场基本面紧密连结起来。预计到2030年,这项动态将新增约800万吨甲醇消费量,巩固亚太地区在全球国际收支平衡的中心地位。
推动海洋产业向低碳燃料转型
2023年,可使用甲醇的船舶订单量达到138艘,超过了可使用液化天然气(LNG)的船舶订单量130艘。 2025年初,订单量又增加了23艘,而像马士基这样的大型航运公司计划在2027年拥有25艘双燃料货柜船,预计每年可减少150万吨二氧化碳排放。可再生甲醇可将船舶生命週期温室气体排放减少高达95%,符合国际海事组织(IMO)2024年生命週期强度指引的要求。船舶采用甲醇的快速速度超过了实际燃料供应速度,这支撑了强劲的需求预期,并增强了甲醇市场的长期发展动力。
原物料价格波动
2024年,天然气价格波动剧烈,地缘政治紧张局势影响了欧洲和亚洲的液化天然气基准价格,并推高了依赖进口地区的甲醇生产成本。尤其是在欧洲,与北美和中东的工厂相比,天然气供应不稳定的生产商面临利润空间压缩的困境。由于天然气仍占甲醇原料的65%,甲醇市场极易受到这些波动的影响。价格波动也使新建产能的投资决策更加复杂,并降低了下游买家的价格透明度。儘管避险和整合策略可以部分抵销风险,但持续的波动会削弱近期的成长前景。
细分市场分析
到2024年,天然气将占所有原料的65%。海恩斯维尔和二迭纪盆地页岩气的强劲产量支撑了具有成本竞争力的生产,确保了甲醇市场的稳定供应。生物甲醇和电甲醇的可再生能源结合,标誌着甲醇产业的转型,目前已宣布的210个计划预计到2030年产能将达到3,570万吨。
预计到2030年,天然气仍将是主要的甲醇原料,但随着经认证的绿色替代燃料因其溢价而受到航运和化学客户的青睐,其市场份额将逐渐萎缩。甲醇市场受惠于这两种成长趋势:传统企业利用原料优势获利,而率先采用可再生技术的企业则获得更高的利润率和品牌差异化优势。
至2024年,包括机油转化燃料油(MTO)、汽油调合燃料和船用燃料在内的能源相关应用将占甲醇消费量的54%,凸显其对甲醇市场动态的影响。光是中国甲醇制烯烃产业的蓬勃发展,就将在2024年额外消耗400万吨甲醇,进一步增强该地区在全球贸易中的影响力。
儘管目前船用燃料的需求量不大,但其市占率却相当可观。双燃料订单吨位预测,到2030年,船用燃料油的需求量将每年增加700万吨,这意味着甲醇在船舶应用领域的市场规模可能与现有能源用途的市场规模相媲美。甲醇在燃料和化学品领域的多功能性有助于平抑週期性波动,从而增强该行业的韧性。
区域分析
到2024年,亚太地区将占全球甲醇消费量的78%(约90,400千吨)。中国的煤製烯烃技术、印尼B40生质柴油的推广以及东南亚地区计画中的产能扩张,将巩固该地区的领先地位。预计到2030年,亚太地区甲醇市场规模将以3.86%的复合年增长率成长,这主要得益于航运和可再生燃料等新兴需求推动了石化产品需求的成长。亚太地区的甲醇价格与中国的进口价格密切相关,使其成为全球市场情绪的风向标。
北美在甲醇市场中的角色正在转变。丰富的页岩气资源推动了一系列出口导向计划的发展,其中以路易斯安那州查尔斯湖甲醇公司投资32亿美元的计画为首。美国甲醇产量过去主要用于国内甲醛生产,如今则转向亚洲甲醇生产商,这重塑了贸易格局,并提供了套利机会。
欧洲和中东采取了不同的策略。欧洲正投资发展电子甲醇,以实现其「Fit for 55」目标,例如Forestal del Atlantico在西班牙的工厂计划就瞄准了船舶燃料供应市场。相反,中东则加倍投入传统的天然气製甲醇设施,并利用其原料优势向亚洲供应甲醇。这些地区共同造就了一个日益分化的甲醇市场:一部分企业追求低碳溢价,而另一部分企业则力求成本领先。
其他福利:
- Excel格式的市场预测(ME)表
- 3个月的分析师支持
目录
第一章 引言
- 研究假设和市场定义
- 调查范围
第二章调查方法
第三章执行摘要
第四章 市场情势
- 市场概览
- 市场驱动因素
- 中国、美国和新兴亚洲地区石化产能扩张
- 海事领域向低碳燃料转型:全球航运公司采用绿色甲醇
- 东协和拉丁美洲政府强制推行燃料混合燃料政策,并推广甲醇汽油和二甲醚。
- 扩大甲醇在烯烃生产上的应用
- 丙烯供不应求推高了中东地区对甲醇燃料的需求。
- 市场限制
- 原物料价格波动
- 绿色甲醇认证框架的延误限制了承购协议的达成。
- 不良健康影响
- 价值链分析
- 技术展望
- 波特五力模型
- 供应商的议价能力
- 买方的议价能力
- 新进入者的威胁
- 替代品的威胁
- 竞争程度
- 主要原料产能分析
- 贸易流量分析
- 价格趋势与预测
第五章 市场规模与成长预测
- 按原料
- 天然气
- 煤炭
- 可再生原料(生物质、固态废弃物)
- 其他(二氧化碳、绿氢、石油残渣、石脑油)
- 透过衍生/应用
- 传统化学品
- 甲醛
- 醋酸
- 溶剂
- 甲胺
- 其他传统化学品
- 能源相关
- 甲醇制烯烃(MTO)
- 甲基三级丁基醚(MTBE)
- 汽油混合物
- 二甲醚(DME)
- 生质柴油
- 传统化学品
- 按最终用途行业划分
- 汽车与运输
- 化学品
- 船用燃料
- 其他(电子产品/家用电器、发电)
- 按年级
- 化学级
- 燃油等级
- 其他(超清洁/电池级、可再生燃料(生物/电甲醇))
- 按地区
- 亚太地区
- 中国
- 印度
- 日本
- 韩国
- 越南
- 泰国
- 印尼
- 马来西亚
- 澳洲
- 纽西兰
- 亚太其他地区
- 北美洲
- 美国
- 加拿大
- 墨西哥
- 欧洲
- 德国
- 英国
- 义大利
- 法国
- 土耳其
- 俄罗斯
- 北欧国家
- 西班牙
- 其他欧洲地区
- 南美洲
- 巴西
- 阿根廷
- 哥伦比亚
- 其他南美洲
- 中东和非洲
- 沙乌地阿拉伯
- 卡达
- 阿拉伯聯合大公国
- 伊朗
- 南非
- 奈及利亚
- 埃及
- 其他中东和非洲地区
- 亚太地区
第六章 竞争情势
- 市场集中度
- 策略趋势
- 市占率分析
- 公司简介
- Atlantic Methanol
- BASF SE
- Carbon Recycling International(CRI)
- Celanese Corporation
- China National Chemical Corporation(ChemChina)
- Coogee
- Enerkem
- Eni SpA
- Gujarat State Fertilizers & Chemicals Limited(GSFC)
- INEOS
- Kaveh Methanol Company
- Kingboard Holdings Limited
- LyondellBasell Industries Holdings BV
- Methanex Corporation
- MITSUBISHI GAS CHEMICAL COMPANY, INC
- Natgasoline
- Ningxia Baofeng Energy Group
- OCI
- Petroliam Nasional Berhad(PETRONAS)
- Proman
- SABIC
- Yankuang Energy
- ZPC Integrated Refining & Petrochemical(Zhejiang)
第七章 市场机会与未来展望
The Methanol Market size is estimated at 115.90 Million tons in 2025, and is expected to reach 138.79 Million tons by 2030, at a CAGR of 3.67% during the forecast period (2025-2030).
The headline figures hide sharp regional contrasts: Atlantic basin prices firmed after unplanned outages, while Asian spot prices softened, widening arbitrage windows for traders. China's expanding methanol-to-olefins (MTO) capacity, North American "mega-mega" plants, and surging marine-fuel demand anchor the growth narrative. Renewable methanol projects offer sizeable upside, yet certification lags and infrastructure gaps restrict near-term supply build-out. Feedstock volatility and uneven policy support add complexity, but sustained investment in low-carbon production and shipping conversions underpin a steady medium-term trajectory for the methanol market.
Global Methanol Market Trends and Insights
Expanding Petrochemical Capacity in China, US and Emerging Asia
Record crude throughput of 14.8 million bpd at Chinese integrated complexes in 2024 has raised methanol demand as refiners pivot toward chemical feedstocks. Concurrently, purpose-built US "mega-mega" methanol plants are geared to serve Chinese MTO units, forging a trans-Pacific value chain that recasts traditional trade flows. Emerging Asian producers are replicating this model, with several coal-to-methanol investments under construction. These projects collectively lift regional self-sufficiency, yet they also keep incremental demand firmly tethered to methanol market fundamentals. The dynamic is expected to add around 8 million tons of new consumption by 2030, cementing Asia-Pacific's centrality to global balances.
Marine Sector Transition to Low-Carbon Fuels
Methanol displaced LNG as the leading alternative fuel for newbuilds in 2023, when 138 methanol-capable vessels were ordered versus 130 LNG-ready ships. In early 2025, the orderbook grew by a further 23 ships, and major carriers such as Maersk now target 25 dual-fuel containerships on the water by 2027, potentially abating 1.5 million tCO2 each year. Renewable methanol can cut lifecycle greenhouse-gas emissions by up to 95%, aligning with the IMO's 2024 life-cycle intensity guidelines. The rapid pace of vessel commitments has outstripped realized fuel supply, underpinning firm demand expectations and reinforcing the long-term pull on the methanol market.
Feedstock Price Volatility
Natural-gas prices swung sharply in 2024 as geopolitical tensions affected European and Asian LNG benchmarks, inflating methanol production costs in import-dependent regions. Producers without secure gas supply, notably in Europe, faced compressed margins relative to plants in North America and the Middle East. The methanol market remains exposed to these swings because natural gas still accounts for 65% of feedstock. Volatility also complicates investment decisions for new capacity and hampers price transparency for downstream buyers. While hedging and integration strategies partly offset the risk, persistent instability tempers near-term growth prospects.
Other drivers and restraints analyzed in the detailed report include:
- Government Mandates on Blended Fuels in ASEAN & LATAM
- Increasing Utilization of Methanol in the Production of Olefins
- Slow Certification Frameworks for Green Methanol
For complete list of drivers and restraints, kindly check the Table Of Contents.
Segment Analysis
Natural gas accounted for 65% of total feedstock in 2024. Robust shale production in the Haynesville and Permian regions underpins cost-competitive output, ensuring reliable supply for the methanol market size. Renewable pathways-biomethanol and e-methanol-together represent 210 announced projects with potential capacity of 35.7 million t by 2030, signalling an incipient shift in the methanol industry.
Natural gas is projected to remain the anchor feedstock through 2030, but its share gradually contracts as certified green alternatives secure premiums from shipping and chemical customers. The methanol market benefits from this dual-track growth: conventional players capitalize on feedstock advantage, while early adopters of renewable technologies command higher margins and brand differentiation.
Energy-related uses-including MTO, gasoline blending and marine fuel-captured 54% of consumption in 2024, underscoring their influence on methanol market dynamics. The methanol-to-olefins boom in China alone absorbed an incremental 4 million t in 2024, reinforcing the region's pull on global trade.
Although currently modest in tonnage, marine fuel demand holds a significant share. Dual-fuel tonnage on order implies an additional 7 million t of annual bunker demand by 2030, indicating that the methanol market size for marine applications could rival existing energy uses. The versatility of methanol across fuels and chemicals thus smooths cyclical swings, enhancing the sector's resilience.
The Methanol Market Report Segments the Industry by Feedstock (Natural Gas, Coal, and More), Derivative/Application (Traditional Chemical and Energy Related), End-Use Industry (Automotive and Transportation, Chemical, and More), Grade (Chemical Grade, Fuel Grade, and More), and Geography (Asia-Pacific, North America, Europe, South America, and Middle East and Africa). The Market Forecasts are Provided in Terms of Volume (tons).
Geography Analysis
Asia-Pacific held a commanding 78% of global methanol consumption in 2024, equal to almost 90,400 kilotons. China's coal-to-olefins build-out, Indonesia's biodiesel B40 rollout and Southeast Asia's planned capacity additions cement regional leadership. The methanol market size in Asia-Pacific is forecast to grow at 3.86% CAGR to 2030 as new demand nodes from shipping and renewable fuels augment petrochemical requirements. Regional pricing remains closely tied to Chinese import parity, making the area the bellwether for global sentiment.
North America's role in the methanol market is undergoing transformation. Abundant shale gas underwrites a wave of export-oriented projects, typified by Lake Charles Methanol's USD 3.2 billion complex in Louisiana. US output, once mainly for domestic formaldehyde, is now squarely aimed at Asian MTO buyers, realigning trade corridors and providing arbitrage optionality.
Europe and the Middle East illustrate divergent strategies. Europe channels investment into e-methanol to meet "Fit for 55" goals, with projects such as Forestal del Atlantico's Spanish plant targeting shipping bunkers. Conversely, the Middle East doubles down on conventional natural-gas-based facilities, leveraging feedstock advantage to supply Asia. Together, these regions shape an increasingly bifurcated methanol market: one side chasing low-carbon premiums, the other maximizing cost leadership.
- Atlantic Methanol
- BASF SE
- Carbon Recycling International (CRI)
- Celanese Corporation
- China National Chemical Corporation (ChemChina)
- Coogee
- Enerkem
- Eni S.p.A.
- Gujarat State Fertilizers & Chemicals Limited (GSFC)
- INEOS
- Kaveh Methanol Company
- Kingboard Holdings Limited
- LyondellBasell Industries Holdings B.V.
- Methanex Corporation
- MITSUBISHI GAS CHEMICAL COMPANY, INC
- Natgasoline
- Ningxia Baofeng Energy Group
- OCI
- Petroliam Nasional Berhad (PETRONAS)
- Proman
- SABIC
- Yankuang Energy
- ZPC Integrated Refining & Petrochemical (Zhejiang)
Additional Benefits:
- The market estimate (ME) sheet in Excel format
- 3 months of analyst support
TABLE OF CONTENTS
1 Introduction
- 1.1 Study Assumptions and Market Definition
- 1.2 Scope of the Study
2 Research Methodology
3 Executive Summary
4 Market Landscape
- 4.1 Market Overview
- 4.2 Market Drivers
- 4.2.1 Expanding Petrochemical Capacity in China, US, and Emerging Asia
- 4.2.2 Marine Sector Transition to Low-Carbon Fuels - Adoption of Green Methanol by Global Carriers
- 4.2.3 Government Mandates on Blended Fuels in ASEAN and LATAM Promoting Methanol Gasoline and DME
- 4.2.4 Increasing Utilization of Methanol in the Production of Olefins
- 4.2.5 On-Purpose Propylene Deficit Strengthening Demand for Methanol-Based Routes in the Middle East
- 4.3 Market Restraints
- 4.3.1 Feedstock Price Volatility
- 4.3.2 Slow Certification Frameworks for Green Methanol Limiting Off-take Agreements
- 4.3.3 Hazardous Impacts on Health
- 4.4 Value Chain Analysis
- 4.5 Technological Outlook
- 4.6 Porter's Five Forces
- 4.6.1 Bargaining Power of Suppliers
- 4.6.2 Bargaining Power of Buyers
- 4.6.3 Threat of New Entrants
- 4.6.4 Threat of Substitute Products and Services
- 4.6.5 Degree of Competition
- 4.7 Production Capacity Analysis by Key Feedstock
- 4.8 Trade Flow Analysis
- 4.9 Pricing Trends and Forecasts
5 Market Size and Growth Forecasts (Volume and Value)
- 5.1 By Feedstock
- 5.1.1 Natural Gas
- 5.1.2 Coal
- 5.1.3 Renewable Feedstock (Biomass, Municipal Solid Waste)
- 5.1.4 Others (CO2, Green Hydrogen, Petroleum Residues and Naphtha)
- 5.2 By Derivative/Application
- 5.2.1 Traditional Chemical
- 5.2.1.1 Formaldehyde
- 5.2.1.2 Acetic Acid
- 5.2.1.3 Solvent
- 5.2.1.4 Methylamine
- 5.2.1.5 Other Traditional Chemicals
- 5.2.2 Energy Related
- 5.2.2.1 Methanol-to-olefin (MTO)
- 5.2.2.2 Methyl Tert-butyl Ether (MTBE)
- 5.2.2.3 Gasoline Blending
- 5.2.2.4 Dimethyl Ether (DME)
- 5.2.2.5 Biodiesel
- 5.2.1 Traditional Chemical
- 5.3 By End-use Industry
- 5.3.1 Automotive and Transportation
- 5.3.2 Chemical
- 5.3.3 Marine Fuel
- 5.3.4 Others (Electronics and Appliances, power generation)
- 5.4 By Grade
- 5.4.1 Chemical Grade
- 5.4.2 Fuel Grade
- 5.4.3 Others (Ultra-Clean/Battery Grade and Renewable (Bio-/E-Methanol))
- 5.5 By Geography
- 5.5.1 Asia-Pacific
- 5.5.1.1 China
- 5.5.1.2 India
- 5.5.1.3 Japan
- 5.5.1.4 South Korea
- 5.5.1.5 Vietnam
- 5.5.1.6 Thailand
- 5.5.1.7 Indonesia
- 5.5.1.8 Malaysia
- 5.5.1.9 Australia
- 5.5.1.10 New Zealand
- 5.5.1.11 Rest of Asia-Pacific
- 5.5.2 North America
- 5.5.2.1 United States
- 5.5.2.2 Canada
- 5.5.2.3 Mexico
- 5.5.3 Europe
- 5.5.3.1 Germany
- 5.5.3.2 United Kingdom
- 5.5.3.3 Italy
- 5.5.3.4 France
- 5.5.3.5 Turkey
- 5.5.3.6 Russia
- 5.5.3.7 Nordics
- 5.5.3.8 Spain
- 5.5.3.9 Rest of Europe
- 5.5.4 South America
- 5.5.4.1 Brazil
- 5.5.4.2 Argentina
- 5.5.4.3 Colombia
- 5.5.4.4 Rest of South America
- 5.5.5 Middle East and Africa
- 5.5.5.1 Saudi Arabia
- 5.5.5.2 Qatar
- 5.5.5.3 United Arab Emirates
- 5.5.5.4 Iran
- 5.5.5.5 South Africa
- 5.5.5.6 Nigeria
- 5.5.5.7 Egypt
- 5.5.5.8 Rest of Middle East and Africa
- 5.5.1 Asia-Pacific
6 Competitive Landscape
- 6.1 Market Concentration
- 6.2 Strategic Moves
- 6.3 Market Share Analysis
- 6.4 Company Profiles (includes Global level Overview, Market level overview, Core Segments, Financials as available, Strategic Information, Market Rank/Share for key companies, Products and Services, and Recent Developments)
- 6.4.1 Atlantic Methanol
- 6.4.2 BASF SE
- 6.4.3 Carbon Recycling International (CRI)
- 6.4.4 Celanese Corporation
- 6.4.5 China National Chemical Corporation (ChemChina)
- 6.4.6 Coogee
- 6.4.7 Enerkem
- 6.4.8 Eni S.p.A.
- 6.4.9 Gujarat State Fertilizers & Chemicals Limited (GSFC)
- 6.4.10 INEOS
- 6.4.11 Kaveh Methanol Company
- 6.4.12 Kingboard Holdings Limited
- 6.4.13 LyondellBasell Industries Holdings B.V.
- 6.4.14 Methanex Corporation
- 6.4.15 MITSUBISHI GAS CHEMICAL COMPANY, INC
- 6.4.16 Natgasoline
- 6.4.17 Ningxia Baofeng Energy Group
- 6.4.18 OCI
- 6.4.19 Petroliam Nasional Berhad (PETRONAS)
- 6.4.20 Proman
- 6.4.21 SABIC
- 6.4.22 Yankuang Energy
- 6.4.23 ZPC Integrated Refining & Petrochemical (Zhejiang)
7 Market Opportunities and Future Outlook
- 7.1 Growing Trends Toward Renewable Methanol
- 7.2 White-space and Unmet-Need Assessment
 全球甲醇市场(2026-2036 年)
 碳再生甲醇市场:依排放源、原料类型、生产技术及最终用户划分-2026-2032年全球预测甲醇加热器市场:按类型、容量、安装方式、应用领域和分销管道划分,全球预测(2026-2032年)
 甲醇市场分析及预测(至2035年):类型、产品、应用、技术、最终用户、製程、组件、安装类型、解决方案和模式全球甲醇市场规模、份额、趋势和成长分析报告(2026-2034年)
 2026年全球二氧化碳再生甲醇市场报告
 甲醇市场-全球产业规模、份额、趋势、机会、预测:按来源、最终用户、地区和竞争对手划分,2021-2031年二氧化碳再生甲醇市场:依反应路径、催化剂、原料及最终用途划分,全球预测(2026-2032年)
 甲醇市场规模、份额和成长分析(按类型、衍生、二次衍生、终端用户产业和地区划分):产业预测(2026-2033 年)
 全球电子甲醇市场:依能源、应用和地区划分,机会与预测(2018-2032 年)