


 |
市场调查报告书
商品编码
1851391
美国太阳能:市场份额分析、行业趋势、统计数据和成长预测(2025-2030 年)United States Solar Energy - Market Share Analysis, Industry Trends & Statistics, Growth Forecasts (2025 - 2030) |
||||||
※ 本网页内容可能与最新版本有所差异。详细情况请与我们联繫。
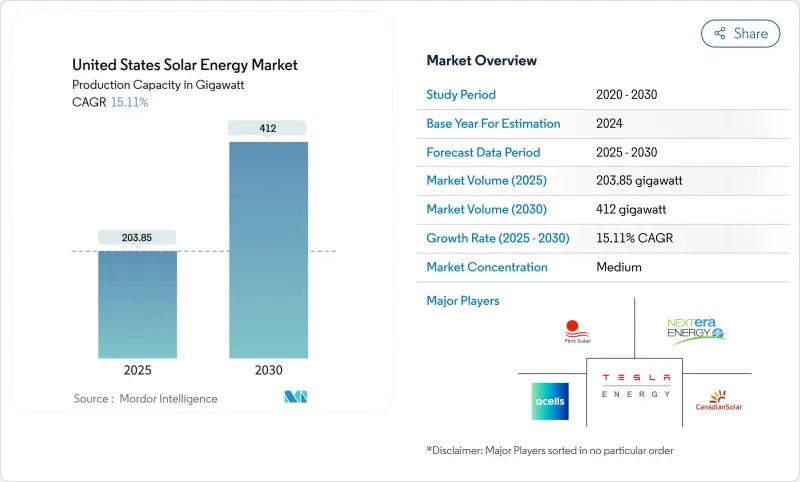
美国太阳能装置容量市场规模预计将从 2025 年的 203.85 吉瓦成长到 2030 年的 412 吉瓦,预测期(2025-2030 年)的复合年增长率为 15.11%。
以目前的规模,美国太阳能市场将于2025年达到产能饱和,而太阳能光电发电将占2024年新增发电量的53%,成为美国新增电力容量成长最快的来源。推动这项成长的三大支柱是:根据《通膨控制法案》(IRA)提供的为期10年的稳定税收优惠;不断壮大的国内製造业基础,能够满足70%的组件需求;以及企业对低碳购电协议的需求。儘管开发商仍然倾向于公用事业规模的计划,因为在用电照度地区,平准化成本已降至40美元/兆瓦时以下,但随着金融机构在许多州推出零首付融资,将投资回收期缩短至7年以内,分散式发电正在加速发展。併网排队和输电拥堵仍然是重大障碍,但计划中的电网投资和光伏储能混合电站的普及预计将从2026年起缓解这些限制。
美国太阳能市场趋势与洞察
《通膨控制法案》中的税收优惠将加速公用事业规模购电协议的达成。
投资再投资法案(IRA)将30%的投资税额扣抵延长了10年,并引入了生产税额扣抵,为开发商提供第二个收入来源。结合国内产品和能源社区奖励税收抵免,太阳能资源丰富的地区的计划可以以低于50美元/兆瓦时的价格签订长期购电协议(PPA),从而促成了类似微软与Brookfield达成的10.5吉瓦交易(迄今为止最大的企业清洁能源合约)。从2025年开始实施的学徒制条款也有助于培养技术纯熟劳工,并降低数吉瓦计画的风险。
一对电网边缘储能单元提高了计划的融资可行性。
到2024年底,太阳能-电池混合电站的太阳能发电装置容量将达到49吉瓦,电池运作将达到3.6吉瓦。电池储能可以将白天的过剩电力转移到晚间用电高峰,从而将有效容量係数提高40%以上,这在加州独立系统运营商(CAISO)和德克萨斯州电力可靠性委员会(ERCOT)的市场中是一项关键优势。目前已有599吉瓦的混合电站计画正在等待併网审批,显示金融机构越来越认为,在电网拥堵的节点,独立式太阳能光电发电并非商业性的最佳选择。
互连队列瓶颈会增加前置作业时间
2024年全国併网待建容量已激增至2.6太瓦,平均研究时间超过36个月。加州独立系统营运商(CAISO)列出了超过200吉瓦的太阳能光电发电专案等待升级,德州电力可靠性委员会(ERCOT)也面临类似的困境。儘管美国能源部的i2X改革将简化丛集研究流程,但大多数区域输电组织至少需要两年才能实施。
细分市场分析
到2024年,光电发电将主导美国太阳能市场,占92%的市场份额,这主要得益于组件价格低廉且成熟的供应链。这一地位为光伏领域拓展基于TOPCon和异质结设计的新型国产电池生产线提供了清晰的路径。然而,聚光型太阳热能发电(CSP)具有光伏发电所不具备的热能储存和製程热特性。随着工业用户日益减少热源碳排放,预计到2030年,CSP将以17%的复合年增长率成长。内华达州新月沙丘的復兴及其第三代CSP原型机(目标是每千瓦时5美分)证明了即使在日照强度超过7千瓦时/平方米/天的地区,小规模部署CSP也是可行的。
随着计画新增超过7吉瓦的TOPCon和HJT产能,美国国内太阳能模组效率预计将从2024年的平均21%提升至25%的全球领先水准。儘管如此,在生产商应对产能推出风险方面,PERC技术在短期内仍具有优势。 CSP技术可能主要集中在美国西南部,但也有望在炼油厂和水泥厂等需要500摄氏度高温蒸气的地区站稳脚跟。随着这两种技术的发展,2030年,美国太阳能市场中分配给CSP的发电量可能达到总发电量的约5%,透过发电结构的多元化提高电网韧性。成本平价目标的实现取决于IRA的持续支援以及高温熔盐塔授权的简化。
此市场细分报告按太阳能光伏类型(光伏、聚光型太阳光电)、安装方式(地面安装、屋顶安装、浮体)和最终用途(公用事业规模、商业/工业、住宅)提供市场规模和预测。市场规模和预测以装置容量(GW)为单位。
其他福利:
- Excel格式的市场预测(ME)表
- 3个月的分析师支持
目录
第一章 引言
- 研究假设和市场定义
- 调查范围
第二章调查方法
第三章执行摘要
第四章 市场情势
- 市场概览
- 市场驱动因素
- 《通货膨胀削减法案》(IRA)的税收优惠加速了公用事业规模购电协议的达成
- 将电网边缘储能与计划融资能力结合
- 企业净零排放指令推动工商业购电协议的签订
- 社区太阳能计画扩大了人口稠密州的太阳能普及率
- 降低进口国产学分模组的风险
- 农光互补改善了中西部地区的土地利用经济效益
- 市场限制
- 互连队列瓶颈导致前置作业时间超过 36 个月
- 第 201/301 条贸易措施导致模组价格波动
- 西南地区日益严重的输电拥塞阻碍了公用事业计划的进展
- 技术纯熟劳工短缺导致EPC成本较去年同期上涨超过18%。
- 供应链分析
- 监管和政策展望(联邦+州)
- 技术展望(拓朴复合、异质结晶体管、钙钛矿、双面)
- 波特五力模型
- 新进入者的威胁
- 供应商的议价能力
- 买方的议价能力
- 替代品的威胁(风能、再生天然气、长期储存)
- 竞争对手之间的竞争
- PESTEL 分析
第五章 市场规模与成长预测
- 按类型
- 光伏(PV)
- 聚光太阳能发电(CSP)
- 按安装类型
- 地面安装
- 屋顶
- 浮体式太阳能
- 按最终用途
- 实用规模
- 商业和工业
- 住房
第六章 竞争情势
- 市场集中度
- 策略性倡议(併购、伙伴关係、购电协议)
- 市场占有率分析(主要企业的市场排名/份额)
- 公司简介
- First Solar Inc.
- NextEra Energy Inc.
- SunPower Corporation
- Hanwha Q CELLS USA Corp.
- Canadian Solar Inc.
- JinkoSolar Holding Co. Ltd.
- Tesla Energy
- Sunrun Inc.
- 8minute Solar Energy
- SOLV Energy LLC
- Mortenson Construction
- Rosendin Electric Inc.
- Renewable Energy Systems Americas
- Brookfield Renewable US
- EDF Renewables North America
- Enphase Energy Inc.
- Trina Solar Ltd.
- LONGi Solar
- REC Group(REC Solar Norway AS)
- Array Technologies Inc.
- Nextracker Inc.
第七章 市场机会与未来展望
The United States Solar Energy Market size in terms of installed base is expected to grow from 203.85 gigawatt in 2025 to 412 gigawatt by 2030, at a CAGR of 15.11% during the forecast period (2025-2030).
At this scale, the United States solar energy market size for 2025 positions solar as the country's fastest-growing source of new electric capacity, with photovoltaic (PV) installations representing 53% of all generation additions logged during 2024 .Growth rests on three pillars: stable 10-year tax incentives under the Inflation Reduction Act (IRA), a swelling domestic manufacturing base that can now supply 70% of module demand, and corporate demand for low-carbon power purchase agreements. Developers continue to favor utility-scale projects because levelized costs have fallen below USD 40/MWh in high-irradiance regions, yet distributed generation is accelerating as lenders roll out zero-down financing that cuts payback periods to fewer than seven years in many states. Interconnection queues and transmission congestion remain the chief speed bumps, but planned grid investments and the adoption of hybrid solar-plus-storage plants are expected to ease curtailment pressures from 2026 forward.
United States Solar Energy Market Trends and Insights
Inflation Reduction Act tax incentives accelerating utility-scale PPAs
The IRA extended the 30% investment tax credit for a decade and introduced production tax credits that offer developers a second monetization route. Paired with bonus credits for domestic content and energy communities, projects in sun-rich regions can sign long-term PPAs below USD 50/MWh, fostering deals such as Microsoft's 10.5 GW agreement with Brookfield-the largest corporate clean-power contract to date. Apprenticeship stipulations that start in 2025 are also building a skilled labor pipeline, which helps de-risk multi-gigawatt pipelines.
Grid-edge storage pairing enhancing project bankability
Hybrid solar-plus-storage plants reached 49 GW of PV and 3.6 GW of batteries in operation by end-2024. Storage raises effective capacity factors to over 40% by shifting excess midday output into evening peaks, a key advantage in CAISO and ERCOT markets. Interconnection queues already list 599 GW of proposed hybrid capacity, signifying that financiers increasingly view standalone solar as commercially sub-optimal in congested nodes.
Interconnection queue bottlenecks lengthening lead times
The national queue swelled to 2.6 TW in 2024, with average study times surpassing 36 months. CAISO lists more than 200 GW of solar awaiting upgrades, while ERCOT experiences similar logjams. DOE's i2X reforms will streamline cluster studies, yet most regional transmission organizations need at least two years to implement them.
Other drivers and restraints analyzed in the detailed report include:
- Corporate net-zero mandates spurring commercial & industrial PPAs
- Community-solar programs expanding access
- Section 201/301 trade actions causing price volatility
For complete list of drivers and restraints, kindly check the Table Of Contents.
Segment Analysis
Solar PV dominated the United States solar energy market in 2024, holding 92% share thanks to low module costs and mature supply chains. This position gave the segment a clear runway to scale new domestic cell lines based on TOPCon and heterojunction designs. However, concentrated solar power (CSP) offers thermal storage and process-heat attributes that PV lacks, leading to a forecast 17% CAGR for CSP through 2030 as more industrial users decarbonize heat streams. Nevada's Crescent Dunes revival and Gen3 CSP prototypes targeting 5 cents/kWh illustrate how niche adoption can still be material where direct-normal irradiance exceeds 7 kWh/m2/day.
Planned TOPCon and HJT capacity expansions exceeding 7 GW should raise domestic module efficiency from a 2024 average of 21% toward the global frontier of 25%. Even so, the short-term edge remains with PERC as producers manage ramp-up risk. CSP will likely stay concentrated in the Southwest but could gain footholds at refineries or cement plants that need 500 °C steam. As both technologies grow, the United States solar energy market size allocated to CSP may reach about 5% of total capacity by 2030, improving grid resilience through diversified generation profiles. Cost-parity targets rely on continued IRA support and streamlined permitting for high-temperature molten salt towers.
The United States Solar Energy Market Report is Segmented by Type (Solar Photovoltaic and Concentrated Solar Power), Mounting Type (Ground-Mounted, Rooftop, and Floating Solar), and End-Use (Utility-Scale, Commercial and Industrial, and Residential). The Market Sizes and Forecasts are Provided in Terms of Installed Capacity (GW).
List of Companies Covered in this Report:
- First Solar Inc.
- NextEra Energy Inc.
- SunPower Corporation
- Hanwha Q CELLS USA Corp.
- Canadian Solar Inc.
- JinkoSolar Holding Co. Ltd.
- Tesla Energy
- Sunrun Inc.
- 8minute Solar Energy
- SOLV Energy LLC
- Mortenson Construction
- Rosendin Electric Inc.
- Renewable Energy Systems Americas
- Brookfield Renewable US
- EDF Renewables North America
- Enphase Energy Inc.
- Trina Solar Ltd.
- LONGi Solar
- REC Group (REC Solar Norway AS)
- Array Technologies Inc.
- Nextracker Inc.
Additional Benefits:
- The market estimate (ME) sheet in Excel format
- 3 months of analyst support
TABLE OF CONTENTS
1 Introduction
- 1.1 Study Assumptions & Market Definition
- 1.2 Scope of the Study
2 Research Methodology
3 Executive Summary
4 Market Landscape
- 4.1 Market Overview
- 4.2 Market Drivers
- 4.2.1 Inflation Reduction Act (IRA) Tax Incentives Accelerating Utility-Scale PPAs
- 4.2.2 Grid?Edge Storage Pairing Enhancing Project Bankability
- 4.2.3 Corporate Net-Zero Mandates Spurring C&I Power-Purchase Agreements
- 4.2.4 Community-Solar Programs Expanding Access in High-Population States
- 4.2.5 Domestic Manufacturing Credits Cutting Module Import Risk
- 4.2.6 Agrivoltaics Improving Land-Use Economics in the Midwest
- 4.3 Market Restraints
- 4.3.1 Interconnection Queue Bottlenecks Increasing Lead-Times Beyond 36 Months
- 4.3.2 Section 201/301 Trade Actions Causing Module-Price Volatility
- 4.3.3 Rising Transmission Congestion Curtailing Southwest Utility Projects
- 4.3.4 Skilled-Labor Shortage Inflating EPC Costs by greater than 18 % YoY
- 4.4 Supply Chain Analysis
- 4.5 Regulatory & Policy Outlook (Federal + State)
- 4.6 Technological Outlook (TOPCon, HJT, Perovskites, Bifacial)
- 4.7 Porter's Five Forces
- 4.7.1 Threat of New Entrants
- 4.7.2 Bargaining Power of Suppliers
- 4.7.3 Bargaining Power of Buyers
- 4.7.4 Threat of Substitutes (Wind, RNG, Long-Duration Storage)
- 4.7.5 Competitive Rivalry
- 4.8 PESTLE Analysis
5 Market Size & Growth Forecasts
- 5.1 By Type
- 5.1.1 Solar Photovoltaic (PV)
- 5.1.2 Concentrated Solar Power (CSP)
- 5.2 By Mounting Type
- 5.2.1 Ground-Mounted
- 5.2.2 Rooftop
- 5.2.3 Floating Solar
- 5.3 By End-Use
- 5.3.1 Utility-Scale
- 5.3.2 Commercial and Industrial
- 5.3.3 Residential
6 Competitive Landscape
- 6.1 Market Concentration
- 6.2 Strategic Moves (M&A, Partnerships, PPAs)
- 6.3 Market Share Analysis (Market Rank/Share for key companies)
- 6.4 Company Profiles (includes Global level Overview, Market level overview, Core Segments, Financials as available, Strategic Information, Products & Services, and Recent Developments)
- 6.4.1 First Solar Inc.
- 6.4.2 NextEra Energy Inc.
- 6.4.3 SunPower Corporation
- 6.4.4 Hanwha Q CELLS USA Corp.
- 6.4.5 Canadian Solar Inc.
- 6.4.6 JinkoSolar Holding Co. Ltd.
- 6.4.7 Tesla Energy
- 6.4.8 Sunrun Inc.
- 6.4.9 8minute Solar Energy
- 6.4.10 SOLV Energy LLC
- 6.4.11 Mortenson Construction
- 6.4.12 Rosendin Electric Inc.
- 6.4.13 Renewable Energy Systems Americas
- 6.4.14 Brookfield Renewable US
- 6.4.15 EDF Renewables North America
- 6.4.16 Enphase Energy Inc.
- 6.4.17 Trina Solar Ltd.
- 6.4.18 LONGi Solar
- 6.4.19 REC Group (REC Solar Norway AS)
- 6.4.20 Array Technologies Inc.
- 6.4.21 Nextracker Inc.
7 Market Opportunities & Future Outlook
- 7.1 White-Space & Unmet-Need Assessment
 2026年全球太阳能市场报告
 太阳能发电系统市场分析及预测(至2035年):依类型、产品类型、服务、技术、组件、应用、安装类型、最终用户、功能及设备划分
 东南亚太阳能:市场占有率分析、产业趋势与统计、成长预测(2026-2031)泰国太阳能:市场占有率分析、产业趋势与统计、成长预测(2026-2031)西班牙太阳能:市场份额分析、行业趋势和统计数据、成长预测(2026-2031 年)越南太阳能市场:市场占有率分析、产业趋势与统计、成长预测(2026-2031年)
 太阳能解决方案市场 - 全球产业规模、份额、趋势、机会及预测(按类型、应用、地区和竞争格局划分,2021-2031年)义大利太阳能市场:市场占有率分析、产业趋势与统计、成长预测(2026-2031)印尼太阳能市场:市场占有率分析、产业趋势与统计、成长预测(2026-2031)菲律宾太阳能市场:市场占有率分析、产业趋势与统计、成长预测(2026-2031年)