


 |
市场调查报告书
商品编码
1851439
虚拟视网膜显示器:市场份额分析、行业趋势、统计数据和成长预测(2025-2030 年)Virtual Retinal Display - Market Share Analysis, Industry Trends & Statistics, Growth Forecasts (2025 - 2030) |
||||||
※ 本网页内容可能与最新版本有所差异。详细情况请与我们联繫。
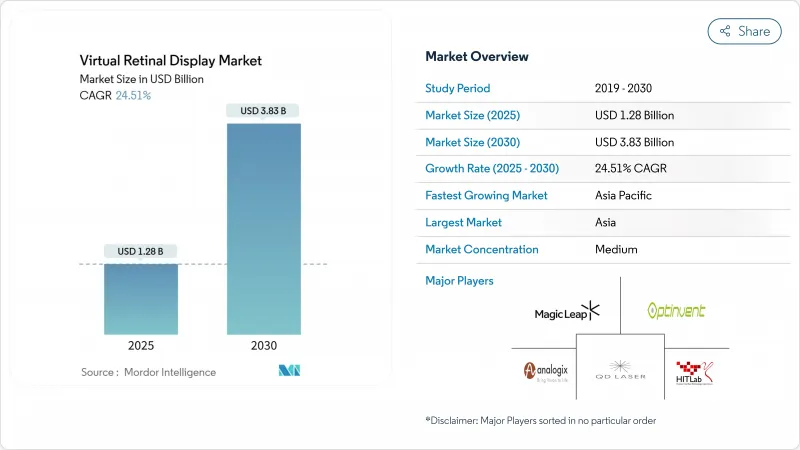
预计到 2025 年,虚拟视网膜显示器市场规模将达到 12.8 亿美元,到 2030 年将达到 38.3 亿美元,复合年增长率为 24.51%。
轻量级视网膜投影技术正从实验室走向主流生产,这主要得益于硅光电成本的下降、军方订单的加速增长以及发达国家医疗机构对视力保健工作流程的数位转型。从基于萤幕的扩增实境架构转向无萤幕架构的转变,消除了视角和环境光线的限制,同时实现了眼镜级的外形尺寸。美国的「士兵彩色微型LED计画」和日本的「老年人视力復健津贴」等采购计画正在推动市场需求。同时,组件製造商正在对控制器、雷射和波导管进行小型化改造,以降低功耗并开拓消费性电子市场。
全球虚拟视网膜显示器市场趋势与洞察
军用智慧头盔对超紧凑型近眼显示器的需求激增
国防专案优先考虑能够躲避夜视探测器探测、但在日光下依然明亮的显示器。美国的「轻型安全特种作战显示器」计划正在资助一个原型机的研发,该原型机能够直接照亮视网膜并消除外部漏光。 Kopin公司价值超过750万美元的彩色MicroLED士兵显示器合约凸显了坚固耐用的视网膜投影技术如何满足野战应用所需的尺寸、重量和功耗要求。
在日本和荷兰,用于辅助低视力患者的视网膜投影设备正迅速普及。
随机对照试验表明,视网膜投射雷射眼镜产品能够改善无法使用隐形眼镜患者的视力,日本的保险公司和德国的诊所也已开始报销高端系统。简化的欧盟医疗器材法规(EU-MDR)核准和瑞士优厚的保险覆盖范围为高端治疗设备提供了支持,鼓励製造商优先考虑以医疗为导向的设计。
高单价雷射扫描仪的平均售价给低于400美元的AR玻璃价格带来了BOM压力。
由于化合物半导体晶圆和精密MEMS扫描器缺乏大规模生产能力,RGB雷射引擎仍占设备总成本的40%。汽车产业的经验表明,AEC-Q100反射镜也存在类似的定价僵化问题,迫使消费品牌要么补贴光学元件,要么放弃低于400美元的价格目标。
细分市场分析
2024年,显示光源元件(主要是RGB雷射和MicroLED引擎)占据了虚拟视网膜显示器市场34.5%的份额。它们的领先地位归功于光学效率与电池寿命之间的直接联繫。眼动追踪和校准模组正以26.7%的复合年增长率快速成长。随着MEMS微镜供应持续受限以及整合商转向以软体为中心的高精度监控,眼动追踪虚拟视网膜显示器的市场规模预计将会扩大。德克萨斯(TI)的DLPC8445控制器在驱动4K超高清显示的同时,体积缩小了90%,证明后端晶片的发展速度与前端雷射不相上下。
DigiLens 和 Avegant 等公司将透明波导管与视网膜投影仪相结合的合作项目正在推动光学组合器和波导管的发展,而 Q-Pixel 的 10,000 PPI 可调多色 LED 则展现了单像素架构的优势,降低了对准误差并提高了产量比率。随着垂直整合的加深,能够同时掌控发光装置和控制电子元件的元件供应商正在获得永续的利润。
到2024年,AR智慧眼镜将占据虚拟视网膜显示器市场41%的收入份额,巩固其作为核心硬体类别的地位。植入式/低视力辅助设备将因人口老化和保险报销的推动而得到更广泛的应用,预计到2030年将达到27.2%的复合年增长率。随着临床证据的不断积累,虚拟视网膜显示器在治疗辅助器具领域的市场规模预计将持续成长。广达电脑向Vuzix追加500万美元投资以提高波导吞吐量等措施表明,契约製造的影响力日益增强。
独立式视网膜投影头显在国防和工业模拟等细分领域仍占有一席之地,因为在这些领域,长时间的任务需要专用电源组。儘管德克萨斯(TI) 已宣布将于 2025 年 3 月推出 DLP4620S-Q1 车载微镜,但车载抬头显示器 (HUD) 的销售成长仍然有限。这种市场失衡表明,消费者的便利性与专业技术之间存在矛盾,供应商必须平衡这两种蓝图。
区域分析
预计亚太地区2024年将占全球营收的27.8%,并在2030年前维持27.6%的年均成长率。这反映了该地区无与伦比的半导体晶圆厂、光学抛光供应链以及国内消费者的强劲需求。中国的晶圆代工奖励正在降低雷射晶粒价格;日本的医疗保健系统正积极引进治疗老龄化疾病的设备;韩国的显示器巨头正在将OLED产能与MicroLED试点生产线相结合;台湾地区则在不断提高后端封装的产量比率。
北美正充分利用国防预算和大学研发资源。虚拟视网膜显示市场将受益于美国的大量微型LED合约以及《晶片法案》(CHIPS Act)支持的硅光电工厂,这些工厂将实现关键光学元件的本地化生产。加拿大简化的医疗设备审批流程使其成为治疗药物首发上市的理想地区,而墨西哥的加工出口走廊则为北美地区的出口提供了免税的最终组装。
欧洲依然是监管领域的领头羊。 1类雷射法规,加上Valeda光生物调节技术的先例,为全球製造商提供了一个可预测的框架。德国和瑞士正将精密光学加工和医疗技术投资相结合,以培育一个专为高价值医疗显示器量身定制的生态系统。北欧的早期采用者正在测试面向生活方式的扩增实境(AR)眼镜产品,从而获得关于电池续航时间和人体工学的回馈。欧盟能源指令进一步推动供应商转向低功耗设计,使欧洲企业在以永续性为导向的市场中拥有优势。
其他福利:
- Excel格式的市场预测(ME)表
- 3个月的分析师支持
目录
第一章 引言
- 研究假设和市场定义
- 调查范围
第二章调查方法
第三章执行摘要
第四章 市场情势
- 市场概览
- 市场驱动因素
- 军用智慧头盔对超紧凑型近眼显示器的需求激增
- 在日本和德国,视网膜投影辅助设备正迅速受到低视力患者的欢迎。
- 美国硅光电成本下降推动AR穿戴装置从基于萤幕转向无萤幕转变
- 欧盟一级雷射防护法规推动消费者接受该法规
- AI眼动追踪模组的整合提升了北美身临其境型训练模拟器的效能
- 市场限制
- 高成本雷射扫描仪的ASP(平均售价)对400美元以下价格分布的AR玻璃的BOM(物料清单)造成了压力。
- 植入式/治疗性VRD的复杂FDA与MDR审批路径
- RGB雷射引擎延迟和散斑伪影会限制您的游戏体验。
- 用于抬头显示器的车用级MEMS后视镜(AEC-Q100)供不应求
- 生态系分析
- 技术展望
- 波特五力分析
- 供应商的议价能力
- 买方的议价能力
- 新进入者的威胁
- 替代品的威胁
- 竞争对手之间的竞争
第五章 市场规模与成长预测
- 按组件
- 显示光源(RGB雷射、微型LED、OLED)
- MEMS扫描单元
- 驱动和控制电子设备
- 眼动追踪与校准模组
- 整合器和波导
- 其他的
- 依产品类型
- 独立式视网膜投影头戴装置
- 扩增实境智慧眼镜
- 汽车抬头显示器
- 植入式/低视力辅助器具
- 其他的
- 透过使用
- 医学与生命科学
- 航太/国防
- 家用电器和游戏
- 汽车与运输
- 产业、教育和培训
- 通过决议
- 高清(最高 720p)
- 全高清 (1080p)
- 2K-4K
- 4K以上分辨率
- 按地区
- 北美洲
- 美国
- 加拿大
- 墨西哥
- 欧洲
- 德国
- 英国
- 法国
- 北欧国家
- 其他欧洲地区
- 南美洲
- 巴西
- 其他南美洲
- 亚太地区
- 中国
- 日本
- 印度
- 东南亚
- 亚太其他地区
- 中东和非洲
- 中东
- GCC
- 土耳其
- 其他中东地区
- 非洲
- 南非
- 其他非洲地区
- 北美洲
第六章 竞争情势
- 市场集中度
- 策略趋势
- 市占率分析
- 公司简介
- Avegant Corporation
- QD Laser, Inc.
- Magic Leap, Inc.
- Texas Instruments Incorporated
- Himax Technologies, Inc.
- eMagin Corporation
- Vuzix Corporation
- OmniVision Technologies, Inc.
- Sony Group Corporation
- Kopin Corporation
- STMicroelectronics NV
- MicroVision, Inc.
- SeeYa Technology Co., Ltd.
- Syndiant, Inc.
- DigiLens Inc.
- Lumus Ltd.
- Mojo Vision Inc.
- Analogix Semiconductor, Inc.
- Jenoptik AG
- Corning Incorporated
- Optivent
- Human Interface Technology Laboratory
第七章 市场机会与未来展望
The virtual retinal display market size is is estimated reached USD 1.28 billion in 2025 and is expected to attain USD 3.83 billion by 2030, registering a 24.51% CAGR.
Light-weight retinal projection is moving from experimental labs to mainstream production because silicon-photonics costs are declining, military orders are accelerating, and healthcare providers in developed economies are digitizing vision-care workflows. Transitioning from screen-based to screen-less augmented-reality architecture removes viewing-angle and ambient-light limits while enabling glasses-grade form factors. Procurement programs such as the U.S. Army's soldier color MicroLED initiative and Japan's aged-care vision rehabilitation funding are pulling demand forward. Meanwhile, component makers are shrinking controllers, lasers, and waveguides, which lowers power budgets and opens consumer electronics channels.
Global Virtual Retinal Display Market Trends and Insights
Surging Demand for Ultra-Compact Near-Eye Displays in Military Smart Helmets
Defense programs prioritize displays invisible to night-vision detectors yet bright in daylight. The U.S. Army's Light Secure Special Warfare Display project funds prototypes that illuminate the retina directly, eliminating outward light leakage. Kopin's soldier color MicroLED contracts worth more than USD 7.5 million underscore how ruggedized retinal projection meets size, weight, and power targets for field use.
Rapid Adoption of Retinal Projection Aids for Low-Vision Patients across Japan and DACH
Randomized trials show retinal laser eyewear improves acuity where lenses fail, prompting Japan's insurers and German clinics to reimburse high-end systems. Streamlined EU-MDR approvals and generous coverage in Switzerland support premium therapeutic devices, encouraging manufacturers to prioritize health-care-focused designs.
High Per-Unit Laser Scanner ASPs Causing BOM Pressures below USD 400 AR Glass Price-Point
RGB laser engines still consume up to 40% of total device cost because compound-semiconductor wafers and precision MEMS scanners lack mass-volume scale. Automotive experience shows similar price rigidity for AEC-Q100 mirrors, meaning consumer brands must subsidize optics or forego sub-USD 400 price targets.
Other drivers and restraints analyzed in the detailed report include:
- Shift from Screen-Based to Screen-Less AR Wearables Driven by Silicon-Photonics Cost Drops in U.S.
- Vision-Safe Class-1 Laser Regulations Enabling Wider Consumer Adoption in EU
- Complex FDA and MDR Pathways for Implantable/Therapeutic VRDs
For complete list of drivers and restraints, kindly check the Table Of Contents.
Segment Analysis
Display Light Source elements, chiefly RGB laser and MicroLED engines, accounted for 34.5% of virtual retinal display market share in 2024. Their dominance stems from the direct link between optical efficiency and battery life. Eye-Tracking & Calibration Modules are expanding fastest at 26.7% CAGR, fueled by AI-enabled gaze analytics. The virtual retinal display market size for Eye-Tracking is expected to widen as MEMS mirrors remain supply-constrained, nudging integrators toward software-centric precision monitoring. Texas Instruments' DLPC8445 controller shrinks by 90% while driving 4K UHD, proving backend silicon keeps pace with front-end lasers.
Optical Combiners and Waveguides are advancing through collaborations such as DigiLens and Avegant, which merge transparent waveguides with retinal projectors. Meanwhile, Q-Pixel's 10,000 PPI tunable polychromatic LEDs hint at single-pixel architectures that could lower alignment tolerances and yield gains. As vertical integration deepens, component vendors that control both emitters and control electronics command sustainable margins.
AR Smart Glasses delivered 41% of virtual retinal display market revenue in 2024, cementing their role as the anchor hardware category. Implantable/Low-Vision Aids, though smaller today, will post a 27.2% CAGR to 2030 as aging populations and insurer reimbursement accelerate uptake. The virtual retinal display market size for therapeutic aids is poised to climb because clinical evidence keeps expanding. Investments such as Quanta Computer's additional USD 5 million in Vuzix improve waveguide throughput, signaling contract manufacturing's growing influence.
Standalone Retinal Projection Headsets persist in defense and industrial simulation niches where long-mission runtimes justify dedicated power packs. Automotive HUDs await qualified MEMS mirrors, which restrains volume scaling despite Texas Instruments' new DLP4620S-Q1 automotive micromirror introduction through Mouser in March 2025. Market skews show consumer convenience versus professional specialization, and suppliers must balance the two roadmaps.
The Virtual Retinal Display Market Report is Segmented by Component (Display Light Source, MEMS Scanning Unit, and More), Product Type (Standalone Retinal Projection Headsets, Augmented-Reality Smart Glasses, and More), Application (Medical and Life Sciences, Aerospace and Defense, and More), Resolution (HD (Upto 720p), Full HD (1080p), and More), and Geography. The Market Forecasts are Provided in Terms of Value (USD).
Geography Analysis
Asia-Pacific held 27.8% revenue share in 2024 and is forecast to compound 27.6% annually through 2030, reflecting unmatched semiconductor fabs, optics polishing supply chains, and domestic consumer appetites. China's foundry incentives push down laser-die pricing, and Japan's healthcare system actively deploys therapeutic devices for age-related degeneration. South Korea's display giants couple OLED competencies with MicroLED pilot lines, while Taiwan tightens backend packaging yields.
North America leverages defense budgets and university R&D. The virtual retinal display market benefits from the U.S. Army's successive microLED contracts and CHIPS-Act-backed silicon-photonics fabs that localize critical optics. Canada offers streamlined medical-device reviews, making it an attractive first-in-region for therapeutic launches, and Mexico's maquiladora corridors provide tariff-free final assembly for export within North America.
Europe remains regulatory pacesetter. Class-1 laser regulations, coupled with the Valeda photobiomodulation precedent, furnish predictable frameworks that manufacturers can replicate globally. Germany and Switzerland merge precision optics machining with med-tech funding, fostering an ecosystem tailored to high-value medical displays. Nordic early-adopters test lifestyle-oriented AR eyewear, providing feedback loops for battery life and ergonomics. EU energy directives additionally steer suppliers toward low-power designs, giving European players leverage in sustainability-minded markets.
- Avegant Corporation
- QD Laser, Inc.
- Magic Leap, Inc.
- Texas Instruments Incorporated
- Himax Technologies, Inc.
- eMagin Corporation
- Vuzix Corporation
- OmniVision Technologies, Inc.
- Sony Group Corporation
- Kopin Corporation
- STMicroelectronics N.V.
- MicroVision, Inc.
- SeeYa Technology Co., Ltd.
- Syndiant, Inc.
- DigiLens Inc.
- Lumus Ltd.
- Mojo Vision Inc.
- Analogix Semiconductor, Inc.
- Jenoptik AG
- Corning Incorporated
- Optivent
- Human Interface Technology Laboratory
Additional Benefits:
- The market estimate (ME) sheet in Excel format
- 3 months of analyst support
TABLE OF CONTENTS
1 INTRODUCTION
- 1.1 Study Assumptions and Market Definition
- 1.2 Scope of the Study
2 RESEARCH METHODOLOGY
3 EXECUTIVE SUMMARY
4 MARKET LANDSCAPE
- 4.1 Market Overview
- 4.2 Market Drivers
- 4.2.1 Surging Demand for Ultra-Compact Near-Eye Displays in Military Smart Helmets
- 4.2.2 Rapid Adoption of Retinal Projection Aids for Low-Vision Patients across Japan and DACH
- 4.2.3 Shift from Screen-Based to Screen-Less AR Wearables Driven by Silicon-Photonics Cost Drops in U.S.
- 4.2.4 Vision-Safe Class-1 Laser Regulations Enabling Wider Consumer Adoption in EU
- 4.2.5 Integration of AI Eye-Tracking Modules Boosting Immersive Training Simulators in North America
- 4.3 Market Restraints
- 4.3.1 High Per-Unit Laser Scanner ASPs Causing BOM Pressures below USD 400 AR Glass Price-Point
- 4.3.2 Complex FDA and MDR Pathways for Implantable/Therapeutic VRDs
- 4.3.3 Latency and Speckle Artifacts in RGB-Laser Engines Limiting Gaming Experience
- 4.3.4 Shortage of Automotive-Grade MEMS Mirrors (AEC-Q100) for Head-Up Displays
- 4.4 Industry Ecosystem Analysis
- 4.5 Technological Outlook
- 4.6 Porter's Five Forces Analysis
- 4.6.1 Bargaining Power of Suppliers
- 4.6.2 Bargaining Power of Buyers
- 4.6.3 Threat of New Entrants
- 4.6.4 Threat of Substitutes
- 4.6.5 Intensity of Competitive Rivalry
5 MARKET SIZE AND GROWTH FORECASTS (VALUES)
- 5.1 By Component
- 5.1.1 Display Light Source (RGB Laser, Micro-LED, OLED)
- 5.1.2 MEMS Scanning Unit
- 5.1.3 Driver and Control Electronics
- 5.1.4 Eye-Tracking and Calibration Module
- 5.1.5 Optical Combiner and Waveguide
- 5.1.6 Others
- 5.2 By Product Type
- 5.2.1 Standalone Retinal Projection Headsets
- 5.2.2 Augmented-Reality Smart Glasses
- 5.2.3 Automotive Head-Up Displays
- 5.2.4 Implantable/Low-Vision Aids
- 5.2.5 Others
- 5.3 By Application
- 5.3.1 Medical and Life Sciences
- 5.3.2 Aerospace and Defense
- 5.3.3 Consumer Electronics and Gaming
- 5.3.4 Automotive and Transportation
- 5.3.5 Industrial, Education and Training
- 5.4 By Resolution
- 5.4.1 HD (Upto 720p)
- 5.4.2 Full HD (1080p)
- 5.4.3 2K-4K
- 5.4.4 Above 4K
- 5.5 By Geography
- 5.5.1 North America
- 5.5.1.1 United States
- 5.5.1.2 Canada
- 5.5.1.3 Mexico
- 5.5.2 Europe
- 5.5.2.1 Germany
- 5.5.2.2 United Kingdom
- 5.5.2.3 France
- 5.5.2.4 Nordics
- 5.5.2.5 Rest of Europe
- 5.5.3 South America
- 5.5.3.1 Brazil
- 5.5.3.2 Rest of South America
- 5.5.4 Asia-Pacific
- 5.5.4.1 China
- 5.5.4.2 Japan
- 5.5.4.3 India
- 5.5.4.4 South-East Asia
- 5.5.4.5 Rest of Asia-Pacific
- 5.5.5 Middle East and Africa
- 5.5.5.1 Middle East
- 5.5.5.1.1 Gulf Cooperation Council Countries
- 5.5.5.1.2 Turkey
- 5.5.5.1.3 Rest of Middle East
- 5.5.5.2 Africa
- 5.5.5.2.1 South Africa
- 5.5.5.2.2 Rest of Africa
- 5.5.1 North America
6 COMPETITIVE LANDSCAPE
- 6.1 Market Concentration
- 6.2 Strategic Moves
- 6.3 Market Share Analysis
- 6.4 Company Profiles (includes Global Level Overview, Market Level Overview, Core Segments, Financials as available, Strategic Information, Market Rank/Share for key companies, Products and Services, and Recent Developments)
- 6.4.1 Avegant Corporation
- 6.4.2 QD Laser, Inc.
- 6.4.3 Magic Leap, Inc.
- 6.4.4 Texas Instruments Incorporated
- 6.4.5 Himax Technologies, Inc.
- 6.4.6 eMagin Corporation
- 6.4.7 Vuzix Corporation
- 6.4.8 OmniVision Technologies, Inc.
- 6.4.9 Sony Group Corporation
- 6.4.10 Kopin Corporation
- 6.4.11 STMicroelectronics N.V.
- 6.4.12 MicroVision, Inc.
- 6.4.13 SeeYa Technology Co., Ltd.
- 6.4.14 Syndiant, Inc.
- 6.4.15 DigiLens Inc.
- 6.4.16 Lumus Ltd.
- 6.4.17 Mojo Vision Inc.
- 6.4.18 Analogix Semiconductor, Inc.
- 6.4.19 Jenoptik AG
- 6.4.20 Corning Incorporated
- 6.4.21 Optivent
- 6.4.22 Human Interface Technology Laboratory
7 MARKET OPPORTUNITIES AND FUTURE OUTLOOK
- 7.1 White-Space and Unmet-Need Assessment
 虚拟视网膜显示器市场规模、份额和成长分析(按组件、产品类型、解析度、最终用户产业和地区划分)-2026-2033年产业预测
 全球虚拟视网膜显示器市场规模研究与预测,按最终用户产业(医疗保健、航太与国防、媒体与娱乐、游戏与体育及其他)和区域划分(2025-2035 年)
 虚拟视网膜显示器市场报告,按技术(光学、驱动器和控制器电子装置、光源等)、应用(航太、医疗、游戏和娱乐、体育、训练和模拟等)和地区划分,2025 年至 2033 年
 虚拟视网膜显示市场,依技术类型(基于雷射的VRD、基于MEMS 的VRD、基于OLED 的VRD)、按产品形式(头戴式显示器(HMD)、桌面显示器、嵌入式系统、可穿戴设备)、按终端划分-用户产业及预测,2024 - 2032