


 |
市场调查报告书
商品编码
1851449
汽车润滑油:市场占有率分析、产业趋势、统计数据和成长预测(2025-2030 年)Automotive Lubricants - Market Share Analysis, Industry Trends & Statistics, Growth Forecasts (2025 - 2030) |
||||||
※ 本网页内容可能与最新版本有所差异。详细情况请与我们联繫。
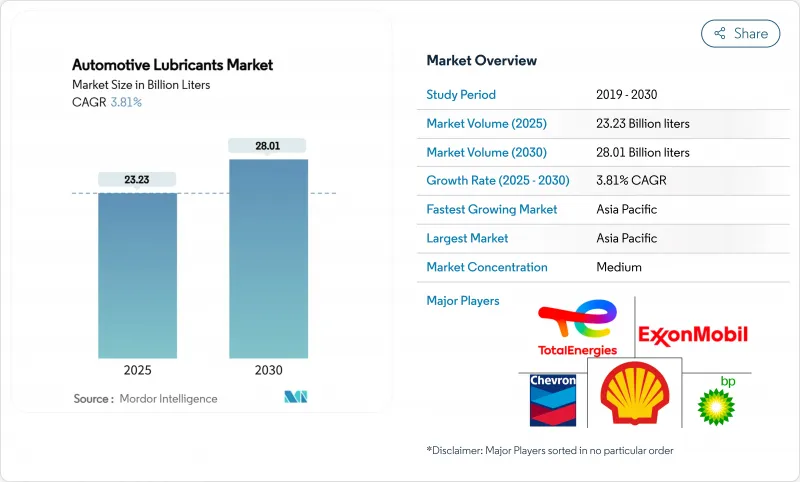
预计到 2025 年,汽车润滑油市场规模将达到 232.3 亿公升,到 2030 年将达到 280.1 亿公升,在预测期(2025-2030 年)内,复合年增长率将达到 3.81%。
成长的驱动因素包括已开发地区全球车辆保有量的老化、新兴经济体摩托车和商用车的持续涌入,以及该行业对能够提高燃油经济性并延长排放的优质合成油的重视。亚太地区凭藉着不断增长的车辆保有量和对本地製造业的投资,仍然是需求中心;而北美和欧洲则依靠车辆的使用寿命来维持售后市场销售。竞争强度适中:壳牌将在2024年连续第18年保持领先地位,但区域调配商将透过提高本地产能和专有配方来扩大市场份额。预计到2024年,中国道路上的电动车数量将达到3,140万辆,这将带来一些不利因素,例如整车製造商强制规定的较长换油週期,但低黏度合成油(类似于API SQ)的高单价可以缓解这些不利影响。
全球汽车润滑油市场趋势与洞察
主要经济体平均车龄成长
车辆使用寿命的延长正在重塑润滑油的需求格局。在美国,半导体短缺和通货膨胀导致车辆更换速度放缓,促使车主增加换油频率并投资购买更高品质的合成机油。欧洲车辆的车龄也不断成长,西欧为18.1年,东欧为28.4年。老旧引擎容易出现密封件劣化、热应力和污染等问题,这些都会加速机油劣化,从而刺激对优质基础油的需求。车龄6至15车龄的车辆维修成本在短短一年内从514美元增加到537美元,凸显了车龄与成本之间的关联。报废率已降至20年来的最低点4.20%,从而扩大了售后市场的收入来源。随着车主寻求更佳的保护和更低的整体拥有成本,高价值合成机油如今已成为维修车间的主流选择。
新兴市场的全球汽车保有量成长
新兴市场抵消了成熟市场电动车相关需求的下滑。预计到2024年,中国汽车保有量将达到4.53亿辆,新增註册量为3,583万辆。在印度和东南亚,受都市区拥塞缓解和出行成本降低的推动,两轮车保有量持续成长。营运于电商和最后一公里配送路线的商用车辆行驶里程更长,排放频率也更高。这些地区的本土汽车製造商正与当地润滑油调配商合作,灵活开发适用于各种燃油品质和极端气候条件的低成本润滑油。因此,儘管全球经济成长放缓,汽车润滑油市场仍维持成长动能。
加速电动车的普及
电动车将使曲轴箱机油和许多传动系统油液从保养项目中移除。到2024年底,中国将有3,140万辆新能源汽车上路,较去年同期成长51.49%。国际能源总署(IEA)预测,到2030年,全球电动车保有量将超过2.5亿辆,届时石油需求将减少高达每日430万桶。然而,电动车也将催生新的市场需求:用于马达轴承的酯类润滑脂、介电冷却液以及针对高转速和电磁相容性优化的齿轮润滑脂。对于供应商而言,挑战将从追求销售转向追求价值,因为专用油液的价格是传统机油的两到三倍。
细分市场分析
机油广泛应用于火星点火式和压燃式发动机,支撑着汽车润滑油市场,预计到2024年将销售量的58.61%。轻型卡车和非公路用机械由于其油底壳容量较大,市占率也不断成长。变速箱油、液压油和齿轮油对于专用于特定用途的手排变速箱、湿式煞车和动力方向盘系统至关重要。润滑脂虽然目前仅占汽车润滑油市场的一小部分,但预计将以4.28%的复合年增长率快速增长,因为电动车需要专用的轴承润滑脂来应对高转速和电解腐蚀。供应商正在将合成酯与聚脲增稠剂混合,以实现导电性和热稳定性控制,从而提升产品价值。
随着符合API SQ标准的润滑油的广泛应用,该细分市场的销售正向合成润滑油转移。 0W-16和0W-12等超低黏度配方使汽车製造商能够满足车辆平均二氧化碳排放目标,尤其是在日本和欧洲。即使在重负荷润滑油领域,从15W-40到5W-30的转变也显示市场对黏度更低、高温高剪切黏度(HTHS)更高的润滑油的需求,以降低燃油成本。随着黏度等级的收窄,添加剂配方也在多样化,硼酯、二硫化钼和无灰清洁剂成为新一代产品的核心成分。因此,汽车润滑油市场正在努力平衡销售下滑和单位利润率高这两方面的挑战。
汽车润滑油市场报告按产品类型(引擎油、变速箱油和齿轮油、液压油、润滑脂)、车辆类型(乘用车、商用车、摩托车)和地区(亚太地区、北美、欧洲、南美、中东和非洲)进行细分。
区域分析
到2024年,亚太地区将占全球汽车润滑油市场份额的42.25%,预计到2030年将以4.16%的年均复合成长率成长。光是中国就拥有4.53亿辆汽车,预计到2024年将新增註册3,583万辆,将带来庞大的工厂装机需求和庞大的服务市场。东协各国政府正大力发展电动车组装中心。泰国的东部经济走廊计画促使壳牌公司将其在泰国的润滑脂产能提高三倍,从而确保区域供应的稳定性。在越南和印尼,摩托车拥有率超过70%,带动了摩托车润滑油销售量的成长。
北美将贡献缓慢但稳定的成长,电动车年销量将超过140万辆,但仅占二手车的不到8%,到2030年,内燃机车保有量仍将保持庞大。汽车製造商正在大力推广API SQ合成油,换油週期超过1万英里,促使快修连锁店升级库存,采用黏度更低的配方。
在欧洲,车龄在18至28年之间的车辆对润滑油的需求持续成长,即便新车註册量保持稳定。欧洲大陆在二氧化碳排放法规方面处于领先地位,推动了0W-20和0W-16机油的普及,这些机油符合PSA、VW 508/509和ACEA C6等相关规范。保养週期延长至3万公里也促进了高端机油的销售,部分抵消了销售量下滑的影响。
中东/非洲和南美洲目前在全球销售量中所占比例虽小,但预计将实现显着成长。 Vivo Energy品牌润滑油在23个非洲国家的扩张以及壳牌收购印度Raj Petro公司,凸显了南南竞争的趋势。基础设施建设、农业机械化和采矿计划催生了对耐粉尘、耐高温液压油和重型机油的需求。
其他福利:
- Excel格式的市场预测(ME)表
- 3个月的分析师支持
目录
第一章 引言
- 研究假设和市场定义
- 调查范围
第二章调查方法
第三章执行摘要
第四章 市场情势
- 市场概览
- 市场驱动因素
- 主要国家车辆平均车龄增加
- 新兴市场全球汽车保有量成长
- 疫情后OEM工厂灌装量的恢復情形
- 快速转向低黏度合成油
- 在非洲和东南亚的本地配方投资
- 市场限制
- 电动车加速普及
- 仿冒劣质机油
- OEM长换油週期规格
- 价值链分析
- 波特五力模型
- 供应商的议价能力
- 买方的议价能力
- 新进入者的威胁
- 替代品的威胁
- 竞争程度
第五章 市场规模与成长预测
- 依产品类型
- 机油
- 变速箱/齿轮油
- 油压
- 润滑脂
- 按车辆类型
- 搭乘用车
- 商用车辆
- 摩托车
- 按地区
- 亚太地区
- 中国
- 印度
- 日本
- 韩国
- 印尼
- 泰国
- 马来西亚
- 越南
- 亚太其他地区
- 北美洲
- 美国
- 加拿大
- 墨西哥
- 欧洲
- 德国
- 英国
- 法国
- 义大利
- 西班牙
- 北欧国家
- 土耳其
- 俄罗斯
- 其他欧洲地区
- 南美洲
- 巴西
- 阿根廷
- 哥伦比亚
- 其他南美洲
- 中东和非洲
- 沙乌地阿拉伯
- 阿拉伯聯合大公国
- 卡达
- 埃及
- 奈及利亚
- 南非
- 其他中东和非洲地区
- 亚太地区
第六章 竞争情势
- 市场集中度
- 策略趋势
- 市占率(%)/排名分析
- 公司简介
- AMSOIL Inc.
- Bharat Petroleum Corporation Limited
- BP plc(Castrol)
- Chevron Corporation
- China National Petroleum Corporation(CNPC)
- China Petroleum & Chemical Corporation
- ENEOS
- Exxon Mobil Corporation
- FUCHS
- Gazprom Neft PJSC
- Gulf Oil International Ltd
- Hindustan Petroleum Corporation Limited
- Idemitsu Kosan Co.,Ltd.
- Indian Oil Corporation Ltd
- Lukoil
- Motul
- Petrobras
- PETRONAS Lubricants International
- Phillips 66 Company
- PT Pertamina Lubricants
- Repsol
- Saudi Arabian Oil Co.
- Shell plc
- SK Lubricants Co. Ltd.
- TotalEnergies
- Veedol International
第七章 市场机会与未来展望
The Automotive Lubricants Market size is estimated at 23.23 billion liters in 2025, and is expected to reach 28.01 billion liters by 2030, at a CAGR of 3.81% during the forecast period (2025-2030).
Growth is anchored by an aging global vehicle parc in developed regions, a steady influx of two-wheelers and commercial vehicles in emerging economies, and the sector's pivot toward premium synthetics that improve fuel economy and extend drain intervals. Asia-Pacific remains the core demand center thanks to rising ownership levels and local manufacturing investments, while North America and Europe rely on vehicle longevity to sustain aftermarket sales. Competitive intensity stays moderate: Shell led for the 18th straight year in 2024, but regional blenders gain ground through local capacity additions and tailored formulations. Headwinds such as accelerating electric-vehicle (EV) penetration-31.4 million units on Chinese roads in 2024-and OEM-specified long-drain intervals are mitigated by the higher unit values of API SQ and similar low-viscosity synthetics.
Global Automotive Lubricants Market Trends and Insights
Growing Average Vehicle Age in Major Economies
Vehicle longevity is reshaping lubricant demand profiles. Semiconductor shortages and inflation have slowed vehicle replacement rates in the US, prompting owners to increase oil-change frequency and invest in higher-quality synthetic oils. Europe's fleet is even older-18.1 years in the West and 28.4 years in the East-driving more workshop visits and raising per-vehicle lubricant consumption. Older engines suffer seal degradation, thermal stress, and contamination, all of which accelerate oil degradation and spur demand for premium base stocks. Maintenance outlays for vehicles aged 6-15 years rose from USD 514 to USD 537 in just one year, underscoring the link between age and spend. Scrappage has fallen to 4.20%, the lowest in two decades, prolonging aftermarket revenue streams. Higher-value synthetics now dominate service bays as owners seek extended protection and lower total cost of ownership.
Rising Global Vehicle Parc in Emerging Markets
Emerging economies offset EV-related volume erosion in mature markets. China's motor-vehicle stock reached 453 million units, supported by 35.83 million new registrations in 2024. Two-wheeler ownership continues to surge in India and Southeast Asia, propelled by urban congestion relief and affordable mobility. Commercial fleets running e-commerce and last-mile delivery routes accumulate higher mileage, boosting drain-frequency multiples. Domestic automakers in these regions collaborate with local blenders, allowing agile development of cost-effective oils tailored to varied fuel quality and climate extremes. As a result, the automotive lubricants market keeps expanding even amid global moderation.
Accelerating EV Penetration
EVs remove crankcase oils and many driveline fluids from service menus. China logged 31.4 million new-energy vehicles on its roads by end-2024, up 51.49% year-on-year. The IEA projects global stock could eclipse 250 million by 2030, cutting oil demand by up to 4.3 million bbl/d. Nonetheless, EVs introduce new niches: esters for e-motor bearings, dielectric coolants, and gear greases optimized for high RPM and electromagnetic compatibility. For suppliers, the challenge shifts from volume to value as specialized fluids command two-to-three-fold price premiums over conventional engine oil.
Other drivers and restraints analyzed in the detailed report include:
- OEM Factory-Fill Volume Recovery Post-Pandemic
- Local Blending Investments in Africa and SE Asia
- OEM Long-Drain Interval Specifications
For complete list of drivers and restraints, kindly check the Table Of Contents.
Segment Analysis
Engine oil held 58.61% of 2024 volumes, anchoring the automotive lubricants market through ubiquitous use in spark-ignition and compression-ignition engines. Larger sump capacities in light trucks and off-highway machinery amplify its share. Transmission fluids, hydraulic oils, and gear oils serve narrower applications yet remain vital for manual boxes, wet brakes, and power-steering circuits. Greases, though just a fraction of the automotive lubricants market size, are the fastest riser at a 4.28% CAGR as EVs require dedicated bearing greases that handle high RPM and electrical pitting. Suppliers blend synthetic esters and polyurea thickeners to deliver conductivity control and thermal stability, elevating product mix value.
The segment's revenue mix swings toward synthetics as API SQ-compliant oils gain traction. Ultra-low viscosity formulations such as 0W-16 and 0W-12 enable OEMs to meet fleet-average CO2 targets, especially in Japan and Europe. Even within heavy-duty oils, the shift from 15W-40 to 5W-30 illustrates demand for thinner, high-HTHS blends that cut fuel costs. As viscosity grades narrow, additive packages diversify-boron esters, molybdenum disulfide, and ashless detergents become cornerstones in next-generation SKUs. The automotive lubricants market therefore balances declining unit volumes against richer per-unit margins.
The Automotive Lubricants Market Report is Segmented by Product Type (Engine Oil, Transmission and Gear Oil, Hydraulic Fluids, Greases), Vehicle Type (Passenger Vehicles, Commercial Vehicles, Motorcycles), and Geography (Asia-Pacific, North America, Europe, South America, Middle East and Africa).
Geography Analysis
Asia-Pacific dominated the automotive lubricants market with a 42.25% share in 2024 and is forecast to grow 4.16% per year through 2030. China alone hosts 453 million vehicles and recorded 35.83 million new registrations in 2024, pairing vast factory-fill demand with a colossal service marketplace. ASEAN governments nurture EV assembly hubs; Thailand's Eastern Economic Corridor plans drove Shell to triple Thai grease capacity, ensuring regional supply resilience. Two-wheeler penetration surpasses 70% of households in Vietnam and Indonesia, bolstering motorcycle-oil volumes.
North America contributes to stable if modest growth. EV sales exceed 1.40 million units annually yet remain below 8% of in-service vehicles, preserving a sizeable internal-combustion fleet through 2030. OEMs emphasize API SQ synthetics with drain intervals topping 10,000 miles, prompting quick-lube chains to upgrade inventories to low-viscosity formulations.
Europe's 18-28 year car fleet sustains lubricant demand despite flat new-car registrations. The continent pioneers CO2 cap compliance, spurring adoption of 0W-20 and 0W-16 oils backed by PSA, VW 508/509, and ACEA C6 specifications. Extended-service intervals of up to 30,000 km partially offset volume loss by encouraging premium-grade purchases.
The Middle East & Africa and South America jointly contribute a smaller share of the global volume today but deliver outsized upside. Vivo Energy's branded-lube expansion across 23 African nations and Shell's Raj Petro acquisition in India highlight a south-south competitive trend. Infrastructure build-out, agricultural mechanization, and mining projects generate demand for hydraulic fluids and heavy-duty engine oils resilient to dust and high ambient temperatures.
- AMSOIL Inc.
- Bharat Petroleum Corporation Limited
- BP p.l.c. (Castrol)
- Chevron Corporation
- China National Petroleum Corporation (CNPC)
- China Petroleum & Chemical Corporation
- ENEOS
- Exxon Mobil Corporation
- FUCHS
- Gazprom Neft PJSC
- Gulf Oil International Ltd
- Hindustan Petroleum Corporation Limited
- Idemitsu Kosan Co.,Ltd.
- Indian Oil Corporation Ltd
- Lukoil
- Motul
- Petrobras
- PETRONAS Lubricants International
- Phillips 66 Company
- PT Pertamina Lubricants
- Repsol
- Saudi Arabian Oil Co.
- Shell plc
- SK Lubricants Co. Ltd.
- TotalEnergies
- Veedol International
Additional Benefits:
- The market estimate (ME) sheet in Excel format
- 3 months of analyst support
TABLE OF CONTENTS
1 Introduction
- 1.1 Study Assumptions and Market Definition
- 1.2 Scope of the Study
2 Research Methodology
3 Executive Summary
4 Market Landscape
- 4.1 Market Overview
- 4.2 Market Drivers
- 4.2.1 Growing average vehicle age in major economies
- 4.2.2 Rising global vehicle parc in emerging markets
- 4.2.3 OEM factory-fill volume recovery post-pandemic
- 4.2.4 Rapid shift toward lower-viscosity synthetics
- 4.2.5 Local blending investments in Africa and SE Asia
- 4.3 Market Restraints
- 4.3.1 Accelerating EV penetration
- 4.3.2 Counterfeit and adulterated engine oils
- 4.3.3 OEM long-drain interval specifications
- 4.4 Value Chain Analysis
- 4.5 Porter's Five Forces
- 4.5.1 Bargaining Power of Suppliers
- 4.5.2 Bargaining Power of Buyers
- 4.5.3 Threat of New Entrants
- 4.5.4 Threat of Substitutes
- 4.5.5 Degree of Competition
5 Market Size and Growth Forecasts (Volume)
- 5.1 By Product Type
- 5.1.1 Engine Oil
- 5.1.2 Transmission and Gear Oil
- 5.1.3 Hydraulic Fluids
- 5.1.4 Greases
- 5.2 By Vehicle Type
- 5.2.1 Passenger Vehicles
- 5.2.2 Commercial Vehicles
- 5.2.3 Motorcycles
- 5.3 By Geography
- 5.3.1 Asia-Pacific
- 5.3.1.1 China
- 5.3.1.2 India
- 5.3.1.3 Japan
- 5.3.1.4 South Korea
- 5.3.1.5 Indonesia
- 5.3.1.6 Thailand
- 5.3.1.7 Malaysia
- 5.3.1.8 Vietnam
- 5.3.1.9 Rest of Asia-Pacific
- 5.3.2 North America
- 5.3.2.1 United States
- 5.3.2.2 Canada
- 5.3.2.3 Mexico
- 5.3.3 Europe
- 5.3.3.1 Germany
- 5.3.3.2 United Kingdom
- 5.3.3.3 France
- 5.3.3.4 Italy
- 5.3.3.5 Spain
- 5.3.3.6 Nordic Countries
- 5.3.3.7 Turkey
- 5.3.3.8 Russia
- 5.3.3.9 Rest of Europe
- 5.3.4 South America
- 5.3.4.1 Brazil
- 5.3.4.2 Argentina
- 5.3.4.3 Colombia
- 5.3.4.4 Rest of South America
- 5.3.5 Middle East and Africa
- 5.3.5.1 Saudi Arabia
- 5.3.5.2 United Arab Emirates
- 5.3.5.3 Qatar
- 5.3.5.4 Egypt
- 5.3.5.5 Nigeria
- 5.3.5.6 South Africa
- 5.3.5.7 Rest of Middle East and Africa
- 5.3.1 Asia-Pacific
6 Competitive Landscape
- 6.1 Market Concentration
- 6.2 Strategic Moves
- 6.3 Market Share(%)/Ranking Analysis
- 6.4 Company Profiles {(includes Global level Overview, Market level overview, Core Segments, Financials as available, Strategic Information, Market Rank/Share for key companies, Products and Services, and Recent Developments)}
- 6.4.1 AMSOIL Inc.
- 6.4.2 Bharat Petroleum Corporation Limited
- 6.4.3 BP p.l.c. (Castrol)
- 6.4.4 Chevron Corporation
- 6.4.5 China National Petroleum Corporation (CNPC)
- 6.4.6 China Petroleum & Chemical Corporation
- 6.4.7 ENEOS
- 6.4.8 Exxon Mobil Corporation
- 6.4.9 FUCHS
- 6.4.10 Gazprom Neft PJSC
- 6.4.11 Gulf Oil International Ltd
- 6.4.12 Hindustan Petroleum Corporation Limited
- 6.4.13 Idemitsu Kosan Co.,Ltd.
- 6.4.14 Indian Oil Corporation Ltd
- 6.4.15 Lukoil
- 6.4.16 Motul
- 6.4.17 Petrobras
- 6.4.18 PETRONAS Lubricants International
- 6.4.19 Phillips 66 Company
- 6.4.20 PT Pertamina Lubricants
- 6.4.21 Repsol
- 6.4.22 Saudi Arabian Oil Co.
- 6.4.23 Shell plc
- 6.4.24 SK Lubricants Co. Ltd.
- 6.4.25 TotalEnergies
- 6.4.26 Veedol International
7 Market Opportunities and Future Outlook
- 7.1 White-space and Unmet-Need Assessment
 乘用车润滑油市场-全球产业规模、份额、趋势、机会及预测,依车辆类型、销售通路、产品类型、地区及竞争格局划分,2021-2031年预测
 日本乘用车润滑油市场报告(依产品类型(引擎油、润滑脂、液压油、变速箱油及齿轮油)及地区划分,2026-2034年)日本汽车润滑油市场报告(按产品类型(引擎油、润滑脂、液压油、变速箱油和齿轮油)、车辆类型(商用车、摩托车、乘用车)和地区划分,2026-2034年)
 非公路设备传动零件市场机会、成长驱动因素、产业趋势分析及预测(2025-2034年)
 乘用车润滑油市场依产品类型、基础油类型、黏度等级、销售管道、通路、车辆类型划分-2025-2032年全球预测商用车润滑油市场按应用、销售管道、基础油类型、润滑油类型、车辆类型和黏度等级划分-2025-2032年全球预测汽车润滑油市场按产品类型、基础油类型、黏度等级、包装类型、车辆类型和分销管道划分 - 全球预测 2025-2032非公路设备润滑油市场按产品类型、基础油类型、设备类型、最终用途产业、应用和销售管道- 全球预测 2025-2032
 非公路用设备变速箱零件市场:北美和欧洲(2024-2030 年)2025 年至 2033 年汽车润滑油市场规模、份额、趋势及预测(按产品、车型和地区)