


 |
市场调查报告书
商品编码
1851454
燃气涡轮机:市场份额分析、行业趋势、统计数据和成长预测(2025-2030 年)Gas Turbine - Market Share Analysis, Industry Trends & Statistics, Growth Forecasts (2025 - 2030) |
||||||
※ 本网页内容可能与最新版本有所差异。详细情况请与我们联繫。
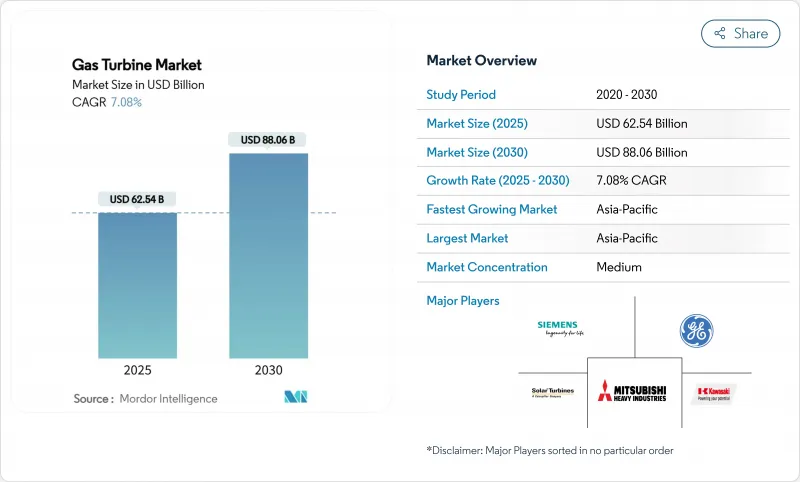
据估计,燃气涡轮机市场规模将在 2025 年达到 625.4 亿美元,到 2030 年达到 880.6 亿美元,在预测期(2025-2030 年)内复合年增长率为 7.08%。
这一发展势头源于对能源安全的担忧、日益严格的碳减排政策,以及随着可再生能源渗透率的提高,对灵活资产以稳定电网的需求。随着人工智慧工作负载推动资料中心电力需求激增,像杜克能源这样的公用事业公司正被迫采购更多能够快速启动并有效运作的涡轮机。製造商正优先考虑氢能驱动设计、提高复合迴圈效率以及采用模组化建造技术,以缩短安装时间并降低成本。超合金热气通道零件的供应链限制以及与环境、社会和治理(ESG)分类相关的资金筹措障碍正在抑制整体前景,但新订单的积压量并未放缓。
全球燃气涡轮机市场趋势与洞察
亚太地区煤改气转变电力公司燃料订单
随着燃煤发电厂面临日益严格的排放法规,中国、印度和越南的电力公司正转向预先设计用于氢气混烧的高效能燃气涡轮机。中国部署大容量氢能机组表明了该国将无污染燃料与分散式能源结合的决心。越南已部署了一套9HA.02系统,以确保低碳基本负载。新加坡计划在2030年前建成并运作一台可燃氢能的机组,凸显了燃气涡轮机市场在可再生能源和脱碳目标之间发挥的桥樑作用。到2030年,该地区的采购项目将新增超过42吉瓦的潜在装置容量。
东南亚透过液化天然气连接的岛屿输电网路推动了对移动航空衍生产品的需求。
岛屿经济体依赖季节性旅游业,必须利用小型电网来管理波动性较大的再生能源。可携式TM2500系统可在数分钟内提供34兆瓦电力,无需用水即可运行,并能灵活提供尖峰和紧急电力。电力生产商可利用浮体式天然气(LNG)储槽作为燃料,以实现快速安装和搬迁。增强型干式低氮衍生燃烧可减少排放气体,而多燃料能力则有助于应对供应中断。因此,航空燃料供应商在东南亚和加勒比海部分地区看到了一个独特的市场机会。
乌克兰战争后天然气价格波动抑制欧盟计划
俄罗斯输往欧洲的管道天然气流量下降了80%,导致现货天然气价格飙升至前所未有的高位,阻碍了简单迴圈机组计划的资金筹措。开发商目前优先考虑签订长期液化天然气合约的复合迴圈发电厂,而一些调峰电厂计划则转向电池储能。德国正在加快建造再气化终端以确保供应,但贷款机构在价格稳定之前仍保持谨慎,欧盟多个国家的燃气涡轮机市场也放缓。
细分市场分析
2024年,功率超过120兆瓦的大型燃气涡轮机将占总销量的58%,这印证了电力公司在基本负载和复合迴圈中对高功率、高效率设备的偏好。重型结构具有优异的热稳定性,并且能够承受黏稠的燃料混合物,这对于氢能的未来至关重要。鑑于煤电资产的持续退役,预计此类燃气涡轮机的市场规模将以行业平均速度稳定成长。
功率介于 31 兆瓦至 120 兆瓦之间的中阶机组成长最快,复合年增长率达 7.44%。其兼具高效性和循环能力,使其成为再生能源应用的理想选择。其更高的调节比和快速冷启动性能,特别适用于太阳能和风能发电波动较大的市场。随着资料中心部署专用的中阶燃气涡轮机组来应对波动的计算负载并确保本地可靠性,燃气涡轮机市场也从中受益。
2024年,复合迴圈配置的燃气涡轮机出货量占比高达75%,这主要得益于其超过64%的净效率,从而降低了燃料成本和每兆瓦时的二氧化碳排放量。模组化余热回收蒸汽产生器等整合技术的进步缩短了建设週期,进一步扩大了其市场吸引力。新的国家排放法规将禁止不具备碳捕集功能的简单迴圈计划,这将提升复合迴圈燃气涡轮机的市场份额。
简单/开式循环机组在调峰和紧急供电方面仍将发挥重要作用,尤其是在需要快速爬坡设备的电网中。汽电共生电厂在重视蒸气输出的工业用户中也蓬勃发展。随着整体製程能源利用率达到 80%,汽电共生正在支持中东和东南亚石化产业的扩张。
燃气涡轮机市场报告按容量(小于 30 MW、31-120 MW 和大于 120 MW)、运行循环(复合迴圈、简单/开式循环、汽电共生/CHP)、燃料类型(天然气、液体燃料和其他燃料类型)、服务(OEM、MRO)、最终行业(电力、英国和其他国家/地区和其他国家/地区进行欧洲地区)。
区域分析
亚太地区预计到2024年将占全球销售额的59.1%,到2030年将以7.96%的复合年增长率成长。煤改气以及工业扩张正在推动中国、印度、越南和印尼的成长。各国政府的政策鼓励使用氢能燃气涡轮机,将其视为中期脱碳的重要一步,提振了该地区的设备订单。
北美位居第二。燃煤发电厂退役、老旧复合迴圈发电厂的更新换代以及人工智慧赋能的资料中心供电,都是订单成长的主要因素。随着独立电力生产商收购资产组合以获取容量费和配套服务收入,资产整合仍在继续。
欧洲面临天然气价格波动,但仍在投资兴建调峰机组和备用容量市场。新建的再气化终端和战略性液化天然气合约正在恢復燃料供应的稳定性,而具备快速停机能力的简单迴圈调峰机组有望与大规模离岸风力发电的扩张形成互补。
其他福利:
- Excel格式的市场预测(ME)表
- 3个月的分析师支持
目录
第一章 引言
- 研究假设和市场定义
- 调查范围
第二章调查方法
第三章执行摘要
第四章 市场情势
- 市场概览
- 市场驱动因素
- 与液化天然气相关的东南亚岛屿电网将推动对移动航空衍生产品的需求。
- 中东地区石化热电汽电共生建设现状
- 加勒比海地区航空衍生性商品租赁业务激增,救灾需求激增
- 市场限制
- 乌克兰战争后天然气价格波动抑制欧盟计划
- 公用事业规模的电池储能装置取代了调峰涡轮机(美国/澳洲)
- 欧盟分类法中以ESG主导的贷款监管
- 大型高温气道用超合金供应链短缺
- 供应链分析
- 监管环境
- 技术展望
- 波特五力分析
- 供应商的议价能力
- 消费者议价能力
- 新进入者的威胁
- 替代品的威胁
- 竞争对手之间的竞争
第五章 市场规模与成长预测
- 按产能
- 小于30兆瓦
- 31~120 MW
- 超过120兆瓦
- 按类型
- 复合迴圈
- 简单/开放式循环
- 汽电共生/CHP
- 按燃料类型
- 天然气
- 液体燃料(柴油/煤油/液化石油气)
- 其他燃料类型(氢气、沼气)
- 透过服务
- OEM
- 维护、修理和大修 (MRO)
- 按最终用户行业划分
- 电力
- 石油和天然气
- 其他终端用户产业(工业、船舶)
- 按地区
- 北美洲
- 美国
- 加拿大
- 墨西哥
- 欧洲
- 英国
- 德国
- 法国
- 义大利
- 西班牙
- 俄罗斯
- 其他欧洲地区
- 亚太地区
- 中国
- 印度
- 日本
- 韩国
- 东南亚国协
- 亚太其他地区
- 南美洲
- 巴西
- 阿根廷
- 智利
- 其他南美洲
- 中东和非洲
- 沙乌地阿拉伯
- 阿拉伯聯合大公国
- 南非
- 埃及
- 其他中东和非洲地区
- 北美洲
第六章 竞争情势
- 市场集中度
- 策略性倡议(併购、伙伴关係、购电协议)
- 市场占有率分析(主要企业的市场排名/份额)
- 公司简介
- General Electric Company
- Siemens Energy AG
- Mitsubishi Heavy Industries Ltd.
- Kawasaki Heavy Industries Ltd.
- Ansaldo Energia SpA
- MAN Energy Solutions SE
- Wartsila Oyj Abp
- Rolls-Royce Holdings plc
- Solar Turbines Incorporated
- Capstone Green Energy Corporation
- Doosan Skoda Power
- IHI Corporation
- Bharat Heavy Electricals Limited
- Harbin Electric Co. Ltd.
- Shanghai Electric Group Co. Ltd.
- OPRA Turbines BV
- Baker Hughes Company
- Vericor Power Systems LLC
- Zorya-Mashproekt
- Nanjing Turbine & Electric Machinery Group
第七章 市场机会与未来展望
The Gas Turbine Market size is estimated at USD 62.54 billion in 2025, and is expected to reach USD 88.06 billion by 2030, at a CAGR of 7.08% during the forecast period (2025-2030).
Momentum comes from energy-security concerns, stricter carbon-reduction policies, and the need for flexible assets that stabilize grids with rising renewable penetration. Rapid growth in data-center electricity demand, spurred by artificial-intelligence workloads, is prompting utilities such as Duke Energy to secure additional turbines that can start quickly and run efficiently. Manufacturers prioritize hydrogen-ready designs, higher combined-cycle efficiencies, and modular construction techniques to lower installation times and cost. Supply-chain constraints for superalloy hot-gas-path parts and financing hurdles linked to ESG taxonomies temper the overall outlook yet have not slowed new-build backlogs.
Global Gas Turbine Market Trends and Insights
Asia-Pacific Coal-to-Gas Transition Accelerating Utility Orders
With coal fleets facing tighter emissions limits, utilities across China, India, and Vietnam are turning to high-efficiency turbines pre-engineered for hydrogen co-firing. China's rollout of a high-capacity hydrogen unit demonstrates national intent to pair clean fuel with dispatchable power. Vietnam is already installing 9HA.02 systems to secure a low-carbon baseload. Singapore plans to run hydrogen-ready units before 2030, highlighting how the gas turbine market bridges renewables and decarbonization goals. Regional procurement pipelines exceed 42 GW of potential capacity additions by 2030.
LNG-Linked Island Grids in Southeast Asia Driving Mobile Aeroderivative Demand
Island economies depend on seasonal tourism and must manage variable renewables on small grids. Portable TM2500 packages, now delivering 34 MW within minutes and operating without water, supply flexible peaking and emergency power. Operators tap floating LNG storage for fuel, enabling quick installation and relocation. Enhanced dry-low-NOx combustion trims emissions, while multi-fuel capability underpins resilience against supply disruptions. As such, aeroderivative suppliers see a distinct niche emerging across archipelagic Southeast Asia and certain Caribbean states.
Gas-Price Volatility Post-Ukraine War Curtailing EU Projects
Russian pipeline flows to Europe dropped 80%, sending spot gas prices to unprecedented highs and undermining project financing for simple-cycle units. Developers now prioritize combined-cycle plants with long-term LNG contracts, while some peaking projects pivot to battery storage. Germany accelerates regasification terminals to secure supply, yet lenders remain cautious until prices stabilize, slowing the gas turbine market in several EU states.
Other drivers and restraints analyzed in the detailed report include:
- Petro-Chemical Cogeneration Build-out in the Middle East
- Disaster-Relief Leasing Surge for Aeroderivative Sets in the Caribbean
- Utility-Scale Battery Storage Displacing Peaking Turbines
For complete list of drivers and restraints, kindly check the Table Of Contents.
Segment Analysis
Large frames exceeding 120 MW captured 58% of 2024 sales, confirming utility preference for high-output, high-efficiency equipment in baseload and combined-cycle duty. Their heavy construction favors thermal stability and endures more viscous fuel blends, a key trait for future hydrogen. The gas turbine market size allocated to this class is forecast to expand steadily at the overall industry pace, given persistent retirements of coal assets.
Mid-range units between 31 MW and 120 MW represent the fastest growing slice at 7.44% CAGR. They balance efficiency with cycling capability, making them attractive for renewables-firming. Enhanced turndown ratios and quick cold starts suit markets with volatile solar or wind profiles. The gas turbine market benefits as data centers deploy dedicated mid-range plants that can match variable computational loads while ensuring local reliability.
Combined-cycle configurations held 75% of 2024 shipments thanks to greater than 64% net efficiencies that cut fuel cost and CO2 per MWh. Integration advances, such as modular heat-recovery steam generators, lower construction timelines, further widening their appeal. The gas turbine market share for combined-cycle designs should increase as new national emissions rules discount simple-cycle projects without carbon-capture provisions.
Simple/open-cycle sets retain importance for peaking and emergency duty, especially in grids needing fast-ramp assets. Cogeneration plants also prosper where industrial hosts value steam output. With overall process-energy utilizations reaching 80%, cogeneration supports petrochemical expansion in the Middle East and Southeast Asia.
The Gas Turbine Market Report is Segmented by Capacity (Below 30 MW, 31 To 120 MW, Above 120 MW), Operating Cycle (Combined Cycle, Simple/Open Cycle, and Cogeneration/CHP), Fuel Type (Natural Gas, Liquid Fuels, and Other Fuel Types), Service (OEM and MRO), End-User Industry (Power, Oil and Gas, and Other End-User Industries), and Geography (North America, Europe, Asia-Pacific, South America, and Middle East and Africa).
Geography Analysis
Asia-Pacific generated 59.1% of 2024 revenue and is set for a 7.96% CAGR through 2030. Combined with industrial expansion, coal-to-gas switching underpins growth in China, India, Vietnam, and Indonesia. Government policies favor hydrogen-capable turbines as a medium-term decarbonization step, reinforcing regional equipment orders.
North America ranks second. Decommissioning coal plants, rejuvenating aging combined-cycle fleets, and powering AI-driven data centers all support volume. Asset consolidation continues with independent power producers acquiring portfolios to capture capacity payments and ancillary-service revenues.
Europe faces gas-price volatility, yet still invests in reserve peaking units and back-up capacity markets. New regasification terminals and strategic LNG contracts restore fuel security, while simple-cycle peakers equipped with fast-shutdown features stand ready to complement large offshore-wind additions.
- General Electric Company
- Siemens Energy AG
- Mitsubishi Heavy Industries Ltd.
- Kawasaki Heavy Industries Ltd.
- Ansaldo Energia SpA
- MAN Energy Solutions SE
- Wartsila Oyj Abp
- Rolls-Royce Holdings plc
- Solar Turbines Incorporated
- Capstone Green Energy Corporation
- Doosan Skoda Power
- IHI Corporation
- Bharat Heavy Electricals Limited
- Harbin Electric Co. Ltd.
- Shanghai Electric Group Co. Ltd.
- OPRA Turbines BV
- Baker Hughes Company
- Vericor Power Systems LLC
- Zorya-Mashproekt
- Nanjing Turbine & Electric Machinery Group
Additional Benefits:
- The market estimate (ME) sheet in Excel format
- 3 months of analyst support
TABLE OF CONTENTS
1 Introduction
- 1.1 Study Assumptions & Market Definition
- 1.2 Scope of the Study
2 Research Methodology
3 Executive Summary
4 Market Landscape
- 4.1 Market Overview
- 4.2 Market Drivers
- 4.2.1 LNG-linked Island Grids in SEA Driving Mobile Aeroderivative Demand
- 4.2.2 Petro-chemical Cogeneration Build-out in Middle East
- 4.2.3 Disaster-Relief Leasing Surge for Aeroderivative Sets in Caribbeans
- 4.3 Market Restraints
- 4.3.1 Gas-price Volatility Post-Ukraine War Curtailing EU Projects
- 4.3.2 Utility-scale Battery Storage Displacing Peaking Turbines (US/Australia)
- 4.3.3 ESG-driven Financing Restrictions under EU Taxonomy
- 4.3.4 Super-alloy Supply-Chain Shortages for Large-Frame Hot-gas-path Parts
- 4.4 Supply-Chain Analysis
- 4.5 Regulatory Landscape
- 4.6 Technological Outlook
- 4.7 Porter's Five Forces Analysis
- 4.7.1 Bargaining Power of Suppliers
- 4.7.2 Bargaining Power of Consumers
- 4.7.3 Threat of New Entrants
- 4.7.4 Threat of Substitute Products and Services
- 4.7.5 Intensity of Competitive Rivalry
5 Market Size & Growth Forecasts
- 5.1 By Capacity
- 5.1.1 Below 30 MW
- 5.1.2 31 to 120 MW
- 5.1.3 Above 120 MW
- 5.2 By Type
- 5.2.1 Combined Cycle
- 5.2.2 Simple/Open Cycle
- 5.2.3 Cogeneration/CHP
- 5.3 By Fuel Type
- 5.3.1 Natural Gas
- 5.3.2 Liquid Fuels (Diesel/Kerosene/LPG)
- 5.3.3 Other Fuel Types (Hydrogen, Biogas)
- 5.4 By Service
- 5.4.1 OEM
- 5.4.2 Maintenance, Repair and Overhaul (MRO)
- 5.5 By End-User Industry
- 5.5.1 Power
- 5.5.2 Oil and Gas
- 5.5.3 Other End-user Indutries (Industrial, Marine)
- 5.6 By Geography
- 5.6.1 North America
- 5.6.1.1 United States
- 5.6.1.2 Canada
- 5.6.1.3 Mexico
- 5.6.2 Europe
- 5.6.2.1 United Kingdom
- 5.6.2.2 Germany
- 5.6.2.3 France
- 5.6.2.4 Italy
- 5.6.2.5 Spain
- 5.6.2.6 Russia
- 5.6.2.7 Rest of Europe
- 5.6.3 Asia-Pacific
- 5.6.3.1 China
- 5.6.3.2 India
- 5.6.3.3 Japan
- 5.6.3.4 South Korea
- 5.6.3.5 ASEAN Countries
- 5.6.3.6 Rest of Asia-Pacific
- 5.6.4 South America
- 5.6.4.1 Brazil
- 5.6.4.2 Argentina
- 5.6.4.3 Chile
- 5.6.4.4 Rest of South America
- 5.6.5 Middle East and Africa
- 5.6.5.1 Saudi Arabia
- 5.6.5.2 United Arab Emirates
- 5.6.5.3 South Africa
- 5.6.5.4 Egypt
- 5.6.5.5 Rest of Middle East and Africa
- 5.6.1 North America
6 Competitive Landscape
- 6.1 Market Concentration
- 6.2 Strategic Moves (M&A, Partnerships, PPAs)
- 6.3 Market Share Analysis (Market Rank/Share for key companies)
- 6.4 Company Profiles (includes Global level Overview, Market level overview, Core Segments, Financials as available, Strategic Information, Products & Services, and Recent Developments)
- 6.4.1 General Electric Company
- 6.4.2 Siemens Energy AG
- 6.4.3 Mitsubishi Heavy Industries Ltd.
- 6.4.4 Kawasaki Heavy Industries Ltd.
- 6.4.5 Ansaldo Energia SpA
- 6.4.6 MAN Energy Solutions SE
- 6.4.7 Wartsila Oyj Abp
- 6.4.8 Rolls-Royce Holdings plc
- 6.4.9 Solar Turbines Incorporated
- 6.4.10 Capstone Green Energy Corporation
- 6.4.11 Doosan Skoda Power
- 6.4.12 IHI Corporation
- 6.4.13 Bharat Heavy Electricals Limited
- 6.4.14 Harbin Electric Co. Ltd.
- 6.4.15 Shanghai Electric Group Co. Ltd.
- 6.4.16 OPRA Turbines BV
- 6.4.17 Baker Hughes Company
- 6.4.18 Vericor Power Systems LLC
- 6.4.19 Zorya-Mashproekt
- 6.4.20 Nanjing Turbine & Electric Machinery Group
7 Market Opportunities & Future Outlook
- 7.1 White-space & Unmet-Need Assessment
 复合循环 (CC)的全球市场 (以季度为基础)
 燃气涡轮机
燃气涡轮机 微型燃气涡轮机发电机市场:按燃料类型、功率输出、销售管道、应用和最终用户分類的全球预测(2026-2032年)陆基燃气涡轮机市场:按类型、功率、应用、技术、燃料类型和安装方式划分,全球预测,2026-2032年
 2026年全球燃气涡轮机服务市场报告
 燃气涡轮机服务市场 - 全球产业规模、份额、趋势、机会及预测(按涡轮机类型、涡轮机容量、服务类型、销售管道、最终用途、地区和竞争格局划分,2021-2031年)
 全球燃气涡轮机市场:市场规模、占有率、成长率、产业分析、类型、应用和区域分析,未来预测(2026-2034)
 涡流涡轮机市场规模、份额和成长分析(按应用、类型、材质、最终用途和地区划分)—2026-2033年产业预测
 燃气涡轮机市场规模、份额和成长分析(按技术、产能、最终用途、应用和地区划分)—2026-2033年产业预测
 燃气涡轮机服务市场规模、份额和成长分析(按涡轮机类型、涡轮机容量、服务类型、服务供应商、最终用途和地区划分)—2026-2033年产业预测