


 |
市场调查报告书
商品编码
1851498
酒石酸:市场占有率分析、产业趋势、统计数据和成长预测(2025-2030 年)Tartaric Acid - Market Share Analysis, Industry Trends & Statistics, Growth Forecasts (2025 - 2030) |
||||||
※ 本网页内容可能与最新版本有所差异。详细情况请与我们联繫。
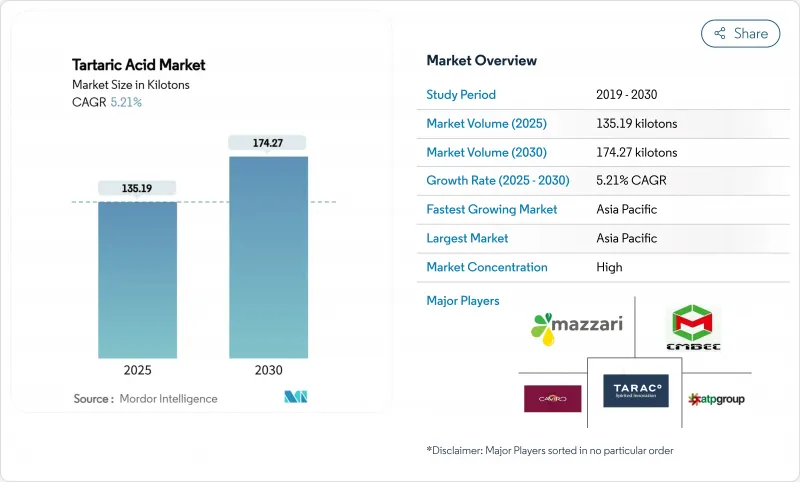
预计到 2025 年,酒石酸市场规模将达到 135.19 千吨,到 2030 年将达到 174.27 千吨,在预测期(2025-2030 年)内复合年增长率为 5.21%。
这种增长反映了酒石酸效用广泛,从葡萄酒稳定剂到高级药用辅料均有涉及。生产商能够灵活地在葡萄提取和顺丁烯二酸酐合成之间切换,从而缓解原材料供应衝击,增强供应韧性,支撑酒石酸市场。葡萄酒酿造中纯度标准的提高、消费者对洁净标示食品日益增长的偏好以及稳定的药物製剂,都促进了酒石酸市场规模的扩大。同时,永续性的压力也促使企业投资电渗析和其他节能工艺,在不影响天然酒石酸品质优势的前提下,降低了合成酒石酸的生产成本。
全球酒石酸市场趋势与洞察
葡萄酒生产需求不断成长
全球葡萄酒产量正在下降,预计到2024年将降至2.26亿百公升。然而,矛盾的是,随着生产商对自有葡萄废弃物收集的依赖性降低,对外部酒石酸的需求却在增加。这种稀缺溢价使得欧洲天然葡萄种植者能够获得比人工合成葡萄高出15%至20%的价格。维吉尼亚州的一项试验表明,在发酵前添加钾基酒石酸比在发酵后添加能获得更好的感官评分。气候变迁导致葡萄钾含量增加,进一步增加了对常规酸化的需求。国际葡萄与葡萄酒组织目前规定纯度基准值为99.5%,有利于成熟的天然供应商。生产商也重视酒厂的醋酸液,其透过电渗析技术达到69.7%的纯度,使其品质目标与循环经济的要求一致。
对药用辅料的需求不断增长
酒石酸市场受益于其掌性特性,这些特性有助于药物溶解、片剂崩坏和生物有效性。香蕉淀粉复合物在崩坏时间方面优于标准超级崩散剂。 FDA指南将酒石酸认定为GRAS(公认安全物质),降低了监管门槛。金属蛋白酶抑制和抗菌活性的专利申请凸显了其治疗潜力。人口老化加速了泻药製剂的复合年增长率,达到6.06%。美国和欧盟每日摄取量限制240毫克/公斤的统一简化了全球产品推广流程。
仔细检讨合成残留物法规
欧洲议会揭露的可追溯性漏洞将促使监管机构加强对中国合成植物药的审查,从而增加遵循成本。欧洲食品安全局(EFSA)在2024年发布的意见中引入的重金属限量要求需要更昂贵的提炼过程。结合同位素检测,监管机构将能够区分发酵和石油化学来源的产品,从而实施更严格的进口检查。
细分市场分析
预计到2024年,天然级酒石酸市场将占市场份额的72.19%,这主要得益于葡萄废弃物的综合处理。天然回收在欧洲很受欢迎,酿酒商直接提取酒石酸作为产品,降低了原料成本。合成酒石酸产能主要集中在中国,预计其年复合成长率将达到5.91%,因为顺丁烯二酸酐提供了一种独立于农业循环的生产途径。永续的膜电渗析技术可降低30%的能耗,进而缩小成本差距。
合成酒石酸生产商标榜其产品纯度稳定、全年供应,吸引那些重视产品规格可预测性的买家。天然系酒石酸供应商则凭藉有机认证优势和在洁净标示食品领域的高端定位与之抗衡。收购智利和阿根廷的Alvinesa公司,进一步推动了葡萄废弃物的跨半球流动。儘管合成酒石酸在酒石酸市场占据了相当大的份额,但由于监管机构更倾向于使用植物来源酒石酸进行有机认证,天然酒石酸仍可能占据市场的大部分份额。
酒石酸市场报告按类型(天然酒石酸、合成酒石酸)、应用(防腐剂和添加剂、泻药、中间体、其他应用)、终端用户行业(食品和饮料、製药、化妆品、建筑、其他终端用户行业)和地区(亚太地区、北美、欧洲、南美、中东和非洲)进行细分。
区域分析
亚太地区在酒石酸市场占据领先地位,2024年市占率达46.52%,预计到2030年将以5.88%的复合年增长率持续成长。中国石化企业以极具竞争力的价格供应顺丁烯二酸酐,使得合成树脂的价格比欧洲产品低15-20%。印度和东南亚的製药业进一步推动了对高纯度酒石酸的需求。日本、韩国和新加坡等国的政府部门正在鼓励低碳生产,推动电化学合成技术的试验,以降低能源消耗。
欧洲凭藉着与葡萄酒产业相关的天然原料开采方式,保持着强劲的地位。义大利、西班牙和法国的葡萄加工中心确保了原料的持续供应,并保证了99.5%的纯度标准。欧盟采用同位素分析的认证规则增强了国内供应商抵御合成进口产品的能力。德国和斯堪的纳维亚的下游食品饮料品牌高度重视经认证的有机原料,从而促进了区域内的原料流通。
北美是酒石酸市场中成熟且稳定的一个区域。美国透过学名药生产和洁净标示配方推动消费,而加拿大则专注于在已调理食品中使用天然成分。墨西哥糖果甜点和饮料出口的不断增长也带动了需求。美国农业部有机标准强制要求使用植物来源酸,促使买家转向葡萄废弃物加工商。区域性研究正在推动创新,例如蜂螨生物防治,并为生产多元化开闢了新的途径。
其他福利:
- Excel格式的市场预测(ME)表
- 3个月的分析师支持
目录
第一章 引言
- 研究假设和市场定义
- 调查范围
第二章调查方法
第三章执行摘要
第四章 市场情势
- 市场概览
- 市场驱动因素
- 葡萄酒生产需求不断成长
- 对药用辅料的需求不断增长
- 微胶囊技术在膳食补充剂的应用
- 洁净标示食品中向天然香料的转变
- 蜜蜂螨生物防治製剂的新应用
- 市场限制
- 仔细检讨合成酒石酸残留物的法规
- 是否有合适的替代品
- 替代有机酸的价格压力
- 价值链分析
- 波特五力模型
- 供应商的议价能力
- 买方的议价能力
- 新进入者的威胁
- 替代品的威胁
- 竞争对手之间的竞争
第五章 市场规模与成长预测
- 按类型
- 天然酒石酸
- 合成酒石酸
- 透过使用
- 防腐剂和添加剂
- 泻药
- 中级
- 其他用途
- 按最终用户行业划分
- 饮食
- 製药
- 化妆品
- 建造
- 其他终端用户产业
- 按地区
- 亚太地区
- 中国
- 印度
- 日本
- 韩国
- 泰国
- 印尼
- 越南
- 马来西亚
- 菲律宾
- 亚太其他地区
- 北美洲
- 美国
- 加拿大
- 墨西哥
- 欧洲
- 德国
- 英国
- 法国
- 义大利
- 西班牙
- 俄罗斯
- 北欧国家
- 土耳其
- 其他欧洲地区
- 南美洲
- 巴西
- 阿根廷
- 哥伦比亚
- 南美洲其他地区
- 中东和非洲
- 沙乌地阿拉伯
- 阿拉伯聯合大公国
- 卡达
- 南非
- 奈及利亚
- 埃及
- 其他中东和非洲地区
- 亚太地区
第六章 竞争情势
- 市场集中度
- 策略趋势
- 市占率(%)/排名分析
- 公司简介
- Alvinesa Natural Ingredients
- Anhui Hailan Bio-technology Co., Ltd
- ATPGroup
- Australian Tartaric Products
- Caviro
- Changmao Biochemical Engineering Company Limited
- Distillerie Mazzari SpA
- Fuso Chemical Co., Ltd.
- Giovanni Randi SpA
- Industria Chimica Valenzana ICV SpA
- Merck KGaA
- Ningbo Jinzhan Biotechnology Co., Ltd.
- Tartaros Gonzalo Castello SL
- The Greatwall Bi0-Chemical Engineering Co., Ltd.
- The Tartaric Chemicals Corporation
- Vinicas
第七章 市场机会与未来展望
The Tartaric Acid Market size is estimated at 135.19 kilotons in 2025, and is expected to reach 174.27 kilotons by 2030, at a CAGR of 5.21% during the forecast period (2025-2030).
This progression mirrors the compound's broad utility, stretching from wine stabilization to advanced pharmaceutical excipients. Supply resilience anchors the tartaric acid market because producers can toggle between grape-derived recovery and maleic anhydride synthesis, cushioning raw-material shocks. Elevated purity specifications in wine making, rising clean-label food preferences, and steady pharmaceutical formulations are together widening the commercial base. At the same time, sustainability pressures spur investment in electrodialysis and other energy-saving processes that trim production costs for synthetic grades without eroding the quality edge held by natural variants.
Global Tartaric Acid Market Trends and Insights
Growing Demand for Wine Production
Lower global wine output, which fell to 226 million hectoliters in 2024, has paradoxically lifted demand for external tartaric acid supplies as producers rely less on in-house grape waste recovery. Scarcity premiums enable European natural producers to secure 15-20% higher prices over synthetic offerings. Trials in Virginia show that potassium-based tartaric additions before fermentation deliver superior sensory scores versus post-fermentation use. Climate-driven rises in grape potassium further increase routine acidification needs. The International Organisation of Vine and Wine now stipulates 99.5% purity, a threshold favoring established natural suppliers. Producers also valorize distillery vinasses, reaching 69.7% purity via electrodialysis, aligning quality goals with circular-economy mandates.
Rising Pharmaceutical Excipient Demand
The tartaric acid market benefits from the compound's chiral properties that aid drug dissolution, tablet disintegration, and bioavailability. Banana-starch complexes outperform standard super-disintegrants in disintegration time. FDA guidance treats tartaric acid as GRAS, lowering regulatory hurdles. Patent filings for metalloproteinase inhibition and antimicrobial actives underscore therapeutic potential. Growth in laxative formulations accelerates at 6.06% CAGR as aging populations seek gentle natural options. Harmonized daily-intake limits of 240 mg/kg in the United States and European Union streamline global product rollouts.
Regulatory Scrutiny on Synthetic Tartaric Acid Residues
Traceability gaps exposed by the European Parliament spur stricter oversight that raises compliance outlays for Chinese synthetic plants. Heavy-metal limits introduced in EFSA's 2024 opinion require costlier purification. Coupled with isotope testing, regulators can now discern fermentation-derived and petrochemical origins, tightening import inspections.
Other drivers and restraints analyzed in the detailed report include:
- Micro-Encapsulation Adoption in Nutraceuticals
- Shift toward Natural Acidity Regulators in Clean-Label Foods
- Availability of Suitable Substitutes
For complete list of drivers and restraints, kindly check the Table Of Contents.
Segment Analysis
The natural grade of the tartaric acid market commanded 72.19% share in 2024 on the strength of integrated grape-waste processing. Natural recovery thrives in Europe, where wine producers extract acid as a byproduct, slashing feedstock costs. Synthetic capacity, concentrated in China, is gaining pace at a 5.91% CAGR because maleic anhydride furnishes an agricultural-cycle-free route. Sustainable membrane electrodialysis cuts energy use by 30%, narrowing cost gaps.
Synthetic producers tout uniform purity and year-round availability, attracting buyers focused on predictable specifications. Natural suppliers counterbalance with organic certification advantages and premium positioning in clean-label foods. Alvinesa's acquisitions in Chile and Argentina underpin continuous grape-waste flows across hemispheres. As regulatory bodies favor plant-origin acids in organic labeling, natural volumes are likely to hold majority share even as synthetics gain numerical ground within the tartaric acid market.
The Tartaric Acid Market Report is Segmented by Type (Natural Tartaric Acid, Synthetic Tartaric Acid), Application (Preservative and Additive, Laxative, Intermediate, and Other Applications), End-User Industry (Food and Beverage, Pharmaceutical, Cosmetics, Construction, and Other End-User Industries), and Geography (Asia-Pacific, North America, Europe, South America, and Middle-East and Africa).
Geography Analysis
Asia-Pacific stands at the forefront of the tartaric acid market with 46.52% share in 2024 and a 5.88% CAGR outlook to 2030. China's integrated petrochemical complexes supply competitively priced maleic anhydride, allowing synthetics to undercut European offers by 15-20%. Pharmaceutical production in India and Southeast Asia further bulks demand for high-purity grades. Authorities in Japan, South Korea, and Singapore encourage low-carbon manufacturing, spurring trials in electrochemical synthesis that curb energy use.
Europe upholds a strong position anchored in natural extraction linked to its wine sector. Grape-processing hubs in Italy, Spain, and France enable continuous raw-material access and ensure compliance with the 99.5% purity threshold. EU authentication rules using isotope analysis strengthen domestic suppliers against synthetic imports. Downstream food and beverage brands within Germany and the Nordics value organically certified inputs, bolstering intra-regional flows.
North America forms a mature yet steady slice of the tartaric acid market. The United States drives consumption through generic drug production and clean-label formulations, while Canada emphasizes natural ingredients in ready meals. Mexico's expanding confectionery and beverage exports add incremental demand. USDA organic standards, which mandate plant-derived acids, direct buyers toward grape-waste processors. Regional research fosters innovations such as bee-mite biocontrol, hinting at fresh avenues for volume diversification.
- Alvinesa Natural Ingredients
- Anhui Hailan Bio-technology Co., Ltd
- ATPGroup
- Australian Tartaric Products
- Caviro
- Changmao Biochemical Engineering Company Limited
- Distillerie Mazzari S.p.A
- Fuso Chemical Co., Ltd.
- Giovanni Randi SpA
- Industria Chimica Valenzana I.C.V. SpA
- Merck KGaA
- Ningbo Jinzhan Biotechnology Co., Ltd.
- Tartaros Gonzalo Castello S.L.
- The Greatwall Bi0-Chemical Engineering Co., Ltd.
- The Tartaric Chemicals Corporation
- Vinicas
Additional Benefits:
- The market estimate (ME) sheet in Excel format
- 3 months of analyst support
TABLE OF CONTENTS
1 Introduction
- 1.1 Study Assumptions and Market Definition
- 1.2 Scope of the Study
2 Research Methodology
3 Executive Summary
4 Market Landscape
- 4.1 Market Overview
- 4.2 Market Drivers
- 4.2.1 Growing Demand for Wine Production
- 4.2.2 Rising Pharmaceutical Excipient Demand
- 4.2.3 Micro-Encapsulation Adoption in Nutraceuticals
- 4.2.4 Shift toward Natural Acidity Regulators in Clean-Label Foods
- 4.2.5 Emerging Use in Bee-Mite Biocontrol Formulations
- 4.3 Market Restraints
- 4.3.1 Regulatory Scrutiny on Synthetic Tartaric Acid Residues
- 4.3.2 Availability of Suitable Substitutes
- 4.3.3 Price Pressure from Alternative Organic Acids
- 4.4 Value Chain Analysis
- 4.5 Porter's Five Forces
- 4.5.1 Bargaining Power of Suppliers
- 4.5.2 Bargaining Power of Buyers
- 4.5.3 Threat of New Entrants
- 4.5.4 Threat of Substitutes
- 4.5.5 Competitive Rivalry
5 Market Size and Growth Forecasts (Volume)
- 5.1 By Type
- 5.1.1 Natural Tartaric Acid
- 5.1.2 Synthetic Tartaric Acid
- 5.2 By Application
- 5.2.1 Preservative and Additive
- 5.2.2 Laxative
- 5.2.3 Intermediate
- 5.2.4 Other Applications
- 5.3 By End-user Industry
- 5.3.1 Food and Beverage
- 5.3.2 Pharmaceutical
- 5.3.3 Cosmetics
- 5.3.4 Construction
- 5.3.5 Other End-user Industries
- 5.4 By Geography
- 5.4.1 Asia-Pacific
- 5.4.1.1 China
- 5.4.1.2 India
- 5.4.1.3 Japan
- 5.4.1.4 South Korea
- 5.4.1.5 Thailand
- 5.4.1.6 Indonesia
- 5.4.1.7 Vietnam
- 5.4.1.8 Malaysia
- 5.4.1.9 Philippines
- 5.4.1.10 Rest of Asia-Pacific
- 5.4.2 North America
- 5.4.2.1 United States
- 5.4.2.2 Canada
- 5.4.2.3 Mexico
- 5.4.3 Europe
- 5.4.3.1 Germany
- 5.4.3.2 United Kingdom
- 5.4.3.3 France
- 5.4.3.4 Italy
- 5.4.3.5 Spain
- 5.4.3.6 Russia
- 5.4.3.7 NORDIC Countries
- 5.4.3.8 Turkey
- 5.4.3.9 Rest of Europe
- 5.4.4 South America
- 5.4.4.1 Brazil
- 5.4.4.2 Argentina
- 5.4.4.3 Colombia
- 5.4.4.4 Rest of South America
- 5.4.5 Middle-East and Africa
- 5.4.5.1 Saudi Arabia
- 5.4.5.2 United Arab Emirates
- 5.4.5.3 Qatar
- 5.4.5.4 South Africa
- 5.4.5.5 Nigeria
- 5.4.5.6 Egypt
- 5.4.5.7 Rest of Middle-East and Africa
- 5.4.1 Asia-Pacific
6 Competitive Landscape
- 6.1 Market Concentration
- 6.2 Strategic Moves
- 6.3 Market Share(%)/Ranking Analysis
- 6.4 Company Profiles (includes Global level Overview, Market level overview, Core Segments, Financials as available, Strategic Information, Market Rank/Share for key companies, Products and Services, and Recent Developments)
- 6.4.1 Alvinesa Natural Ingredients
- 6.4.2 Anhui Hailan Bio-technology Co., Ltd
- 6.4.3 ATPGroup
- 6.4.4 Australian Tartaric Products
- 6.4.5 Caviro
- 6.4.6 Changmao Biochemical Engineering Company Limited
- 6.4.7 Distillerie Mazzari S.p.A
- 6.4.8 Fuso Chemical Co., Ltd.
- 6.4.9 Giovanni Randi SpA
- 6.4.10 Industria Chimica Valenzana I.C.V. SpA
- 6.4.11 Merck KGaA
- 6.4.12 Ningbo Jinzhan Biotechnology Co., Ltd.
- 6.4.13 Tartaros Gonzalo Castello S.L.
- 6.4.14 The Greatwall Bi0-Chemical Engineering Co., Ltd.
- 6.4.15 The Tartaric Chemicals Corporation
- 6.4.16 Vinicas
7 Market Opportunities and Future Outlook
- 7.1 White-space and unmet-need assessment
- 7.2 Adoption in niche applications (biocontrol, advanced materials)
 酒石酸市场:2026-2032年全球市场预测(依纯度等级、形态、生产流程、应用及分销通路划分)
 酒石酸市场报告:按应用和地区划分 2026-2034 年
 酒石酸市场-全球产业规模、份额、趋势、机会及预测(依来源、类型、衍生物、应用、地区及竞争格局划分),2021-2031年
 酒石酸市场规模、份额及成长分析(按来源、类型、应用和地区划分)-2026-2033年产业预测
 全球酒石酸市场:表现及预测(2020-2031)
 酒石酸市场:预测(2025-2030)
 合成酒石酸市场:2024-2031年全球产业分析、规模、占有率、成长、趋势、预测酒石酸市场:全球产业分析,规模,占有率,成长,趋势,预测,2024年~2033年
 合成酒石酸市场,按产品、类型、应用、国家和地区 - 2024-2032 年行业分析、市场规模、市场份额和预测