


 |
市场调查报告书
商品编码
1851504
啤酒包装:市场份额分析、行业趋势、统计数据和成长预测(2025-2030 年)Beer Packaging - Market Share Analysis, Industry Trends & Statistics, Growth Forecasts (2025 - 2030) |
||||||
※ 本网页内容可能与最新版本有所差异。详细情况请与我们联繫。
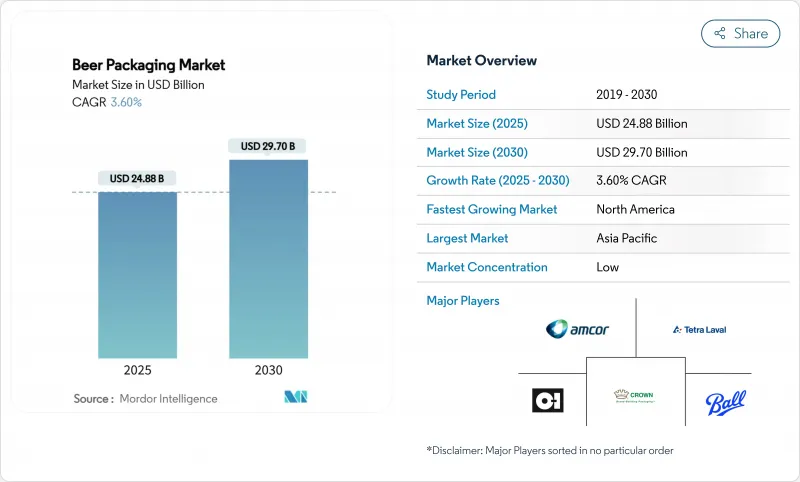
预计到 2025 年,啤酒包装市场规模将达到 248.8 亿美元,到 2030 年将达到 297 亿美元,预测期内复合年增长率为 3.60%。
这一成长反映了市场对永续材料日益增长的需求、高端包装形式的加速发展以及消费管道的持续转变。铝材的市场份额持续扩大,其可回收性和物流效率吸引了众多大大小小的啤酒厂;而随着低温运输品质保证的提升,PET包装的市场份额也在不断增长。玻璃包装销售量遥遥领先,但由于生产过程能源密集且运输成本较高,玻璃包装面临成本压力。区域机会主要集中在亚太地区(都市化推动了瓶装啤酒的销售)和北美地区(精酿啤酒厂正在寻求能够适应零售货架动态的差异化环保包装形式)。主要製罐商、玻璃製造商和软包装专家在供应端的投资表明,该行业正在向更快、更废弃物的技术转型,以减少材料投入并提高品牌灵活性。
全球啤酒包装市场趋势与洞察
北美精酿啤酒厂的快速成长推动了罐体设计的快速迭代
精酿啤酒厂的蓬勃发展正在重塑包装经济格局,像Ball公司的Dynamark Advanced Pro这样的数位印刷机能够实现每个托盘印刷多个图案,从而打破了传统的最低订购量限制。灵活的罐装生产线帮助酿酒商管理库存、试销新产品,并按季节推出新品,而无需购买过多的玻璃瓶。虽然数位印刷的成本比胶印高出近3倍,但全部区域拥有超过9000家啤酒厂,更快的销售速度和更强的货架吸引力足以抵消成本优势。
欧盟押金返还计划支持轻便可回收玻璃瓶的日益普及
在德国,强制押金制度实现了 98% 的回收率,鼓励了 Vetropack 的 Echovai 强化瓶等创新;而法国则增加了一个集中式清洁中心,每年可清洁 6000 万个瓶子,将成本结构从单方面处置转变为循环资产管理。
欧洲禁止使用一次性塑胶製品,以减少PET的使用
欧盟包装废弃物法规规定,到 2030 年,包装回收率必须达到 30%,并从 2025 年起逐步淘汰特定规格的包装。生产者延伸责任制收费提高了 PET 的成本,使其低于可无限循环利用的铝,这促使企业转向使用金属和轻质可回收玻璃。
细分市场分析
由于玻璃具有感官中性且消费者对其已有认知,预计到2024年,玻璃仍将保持80.98%的市场份额,但由于铝的可回收性和运输成本优势,其销量将会下降。这主要得益于2030年实现100%可回收包装的政策目标。 PET将以5.81%的复合年增长率成长,目前正逐渐转向用于满足啤酒碳酸化需求的阻隔涂层瓶,而纸质包装仍仅限于二级包装。
能源成本上涨和碳排放税的征收将进一步扩大铝相对于炉烧玻璃的总体成本优势。同时,诸如源自废弃食用油的生物对二甲苯PET等创新产品提升了品牌信誉,并预示着这种聚合物将得到更广泛的应用。儘管啤酒製造商仍保留一些用于高端产品的玻璃包装产品,但啤酒包装市场正越来越多地将新增产能转向更轻的基材。
到2024年,瓶装啤酒将占全球销售量的75.32%。然而,随着精酿啤酒、便利购物和外出消费等因素推动罐装啤酒市场朝金属罐方向发展,罐装啤酒的销售量将以6.75%的复合年增长率加速成长。由于新兴地区对清洗系统的资本投入,桶装啤酒的成长速度将会放缓,而袋装啤酒的成长则微乎其微。
数位印刷技术使小型啤酒生产商能够媲美跨国公司的包装质量,并在不造成不必要的库存积压的情况下提高产品周转率。对区域性易拉罐生产线的投资,例如巴西的生产线,降低了单位成本,并进一步扩大了供货规模带来的经济效益。玻璃製造商则透过压纹和锥形瓶身设计来应对这项挑战,从而提升了商店辨识度。
区域分析
亚太地区预计到2024年将以38.43%的市占率领跑,这主要得益于庞大的人口规模、不断增长的收入和快速的都市化,这些因素都有利于包装产品的普及。在越南和印尼,低温运输的扩展将促进PET材质产品的渗透;而在中国,预计到2024年,手工艺品行业的规模将增长至331亿元人民币,这将带动精品设计的铁罐和礼品型玻璃瓶的销售。
到2030年,北美将以6.43%的复合年增长率成为成长最快的地区。超过9000家精酿啤酒厂对小批量罐装啤酒有着稳定的需求,但关税和铝板短缺正在推高成本。像Ball公司在佛罗里达州的收购这样的投资,能够优化供应链,增加永续产能,并巩固铝业在该地区作为成长引擎的地位。
欧洲仍是高端啤酒市场,但人均啤酒消费量已趋于稳定。欧盟的回收政策正促使资本转向强化玻璃、可回收玻璃和高回收成分的易拉罐。德国啤酒商正透过安装压纹生产线来展示其高端包装,这些生产线在满足循环经济关键绩效指标的同时,也能达到工业速度。
其他福利:
- Excel格式的市场预测(ME)表
- 3个月的分析师支持
目录
第一章 引言
- 研究假设和市场定义
- 调查范围
第二章调查方法
第三章执行摘要
第四章 市场情势
- 市场概览
- 市场驱动因素
- 北美精酿啤酒厂的快速成长推动了罐体设计的快速迭代
- 欧盟押金返还计划支持轻便可回收玻璃瓶的日益普及
- 低温运输的快速发展使得PET瓶能够渗透到亚洲啤酒市场。
- 品牌优质化推动了德国啤酒公司推出压花特製瓶。
- 铝关税削减可能引发南美贸易转向
- 电子商务多件装产品推动了对英国纸板二次包装的需求。
- 市场限制
- 欧洲一次性塑胶禁令遏制了PET的使用
- 美国铝坯供应紧张推高了精酿啤酒製造商的罐体成本
- 澳洲消费者转向碳酸饮料导致玻璃製品销售量下降。
- 新兴市场油桶维修的高额资本支出限制了其回收率。
- 供应链分析
- 监理展望
- 波特五力分析
- 新进入者的威胁
- 买方/消费者的议价能力
- 供应商的议价能力
- 替代品的威胁
- 竞争对手之间的竞争
第五章 市场规模与成长预测
- 透过包装材料
- 玻璃
- 金属
- PET
- 纸
- 按包装类型
- 瓶子
- 能
- 桶
- 小袋
- 按包装尺寸
- 少于330毫升
- 331-650 ml
- 超过650毫升
- 透过分销管道
- 直销
- 间接销售
- 按地区
- 北美洲
- 美国
- 加拿大
- 墨西哥
- 欧洲
- 德国
- 英国
- 法国
- 义大利
- 西班牙
- 俄罗斯
- 其他欧洲地区
- 亚太地区
- 中国
- 印度
- 日本
- 韩国
- 澳洲、纽西兰
- 亚太其他地区
- 中东和非洲
- 中东
- 阿拉伯聯合大公国
- 沙乌地阿拉伯
- 土耳其
- 其他中东地区
- 非洲
- 南非
- 奈及利亚
- 埃及
- 其他非洲地区
- 南美洲
- 巴西
- 阿根廷
- 其他南美洲
- 北美洲
第六章 竞争情势
- 市场集中度
- 策略趋势
- 市占率分析
- 公司简介
- Amcor Ltd.
- Ardagh Group SA
- Crown Holdings Inc.
- Ball Corporation
- Tetra Laval International SA
- OI Glass Inc.
- Canpack Group
- Silgan Holdings Inc.
- Vidrala SA
- Allied Glass Containers Ltd.
- Plastipak Holdings Inc.
- Nampak Ltd.
- Orora Limited
- Graphic Packaging International
- Toyo Seikan Group Holdings Ltd.
- Envases Universales
- Berlin Packaging LLC
- Sidel(Sidel Group)
- Krones AG
第七章 市场机会与未来展望
The Beer packaging market size stands at USD 24.88 billion in 2025 and is expected to reach USD 29.70 billion in 2030, advancing at a 3.60% CAGR over the forecast period.
This growth reflects rising demand for sustainable materials, the acceleration of premium formats, and ongoing shifts in consumption channels. Aluminum's share continues to expand as recyclability and logistics efficiency attract large and small brewers alike, while PET gains traction where cold-chain quality assurance is improving. Glass holds a clear lead in volume but now contends with cost pressures from energy-intensive production and heavier freight loads. Regional opportunities cluster in Asia-Pacific, where urbanization lifts packaged beer sales, and in North America, where craft breweries seek differentiated, eco-friendly formats that match retail shelf dynamics. Supply-side investments by leading can makers, glass producers, and flexible-pack specialists underline an industry pivot toward high-speed, low-waste technologies that cut material inputs and boost brand agility.
Global Beer Packaging Market Trends and Insights
Surge in Craft Breweries Driving Short-Run Can Designs in North America
Craft brewery growth reshapes packaging economics as digital printing such as Ball's Dynamark Advanced Pro lets multiple graphics run on one pallet, eliminating historic minimum-order barriers. Flexible can lines help brewers manage inventory, pilot new SKUs, and execute seasonal launches without excess glass bottle purchases. Though digital print premiums approach 300% over offset, the cost is offset by faster sell-through rates and stronger shelf appeal at more than 9,000 breweries across the region.
Rising Adoption of Lightweight Returnable Glass Bottles Backed by EU Deposit-Return Schemes
Mandated deposit systems achieve 98% return rates in Germany, prompting innovations like Vetropack's Echovai tempered bottle that is 30% lighter yet rugged across multiple cycles. France's rollout adds centralized washing hubs capable of 60 million bottles per year, shifting cost structures from one-way disposal toward circular asset management.
Legislative Bans on Single-Use Plastics Curtailing PET in Europe
The EU Packaging and Packaging Waste Regulation enforces 30% recycled content by 2030 and phases out targeted formats from 2025. Extended Producer Responsibility fees raise PET costs relative to infinitely recyclable aluminum, prompting portfolio shifts toward metal and lightweight returnable glass.
Other drivers and restraints analyzed in the detailed report include:
- Rapid Cold-Chain Expansion Enabling PET Penetration in Asian Beer
- Brand Premiumization Fueling Embossed Specialty Bottles Among German Breweries
- Tight U.S. Aluminum Slab Supply Elevating Can Costs for Craft Brewers
For complete list of drivers and restraints, kindly check the Table Of Contents.
Segment Analysis
Glass preserved an 80.98% share in 2024 due to sensory neutrality and entrenched consumer associations. Yet aluminum's recyclability edge and transportation savings peel away volume, aided by policy targets for 100% recyclable packaging by 2030. PET, advancing at 5.81% CAGR, draws on barrier-coated bottles that now satisfy beer's carbonation needs, while paper remains confined to secondary packs.
Rising energy costs and carbon levies widen aluminum's total-cost edge over furnace-fired glass. Meanwhile, innovations like bio-paraxylene PET from used cooking oil improve brand credentials and foreshadow broader polymer adoption. Brewers keep niche glass SKUs for premium variants, but the Beer packaging market increasingly redirects new capacity toward lighter substrates.
Bottles supplied 75.32% of global volume in 2024. Still, cans are accelerating at a 6.75% CAGR as dynamism in craft beer, convenience shopping, and outdoor consumption tips formats in favor of metal. Keg growth remains muted by cleaning-system cap-ex in emerging regions, and pouches stay marginal.
Digital printing lets small brewers match multinational packaging quality, increasing SKU churn without wasteful overruns. Investment in regional can lines, as seen in Brazil, further scales economies that shrink per-unit costs and enhance availability. Glass manufacturers counter with embossing and tapered profiles that lift perceived value on-premise.
The Beer Packaging Market Report is Segmented by Packaging Material (Glass, Metal, PET, Paper), Packaging Type (Bottle, Can, Keg, Pouches), Pack Size (Less Than Equal To 330 Ml, 331-650 Ml, More Than 650 Ml), Distribution Channel (Direct Sales, Indirect Sales), and Geography (North America, Europe, Asia-Pacific, Middle East and Africa, South America). The Market Forecasts are Provided in Terms of Value (USD).
Geography Analysis
Asia-Pacific led with 38.43% share in 2024, underpinned by population scale, climbing incomes, and rapid urbanization that favor packaged formats. Cold-chain expansion in Vietnam and Indonesia supports PET penetration, while China's craft segment grew to CNY 33.1 billion in 2024, fostering boutique can designs and gift-oriented glass bottles alike.
North America posts the fastest 6.43% CAGR through 2030. More than 9,000 craft breweries generate steady demand for short-run cans, though tariff and slab shortages inflate costs. Investments such as Ball's Florida acquisition streamline supply networks and add sustainable capacity, reinforcing aluminum's role as the region's growth engine.
Europe remains a premium stronghold but confronts flat per-capita beer intake. The EU's recyclability mandate triggers capital shifts into tempered, returnable glass and high-recycled-content cans. German breweries showcase premium packaging by installing embossed lines that hit industrial speeds while meeting circular-economy KPIs.
- Amcor Ltd.
- Ardagh Group SA
- Crown Holdings Inc.
- Ball Corporation
- Tetra Laval International SA
- O-I Glass Inc.
- Canpack Group
- Silgan Holdings Inc.
- Vidrala SA
- Allied Glass Containers Ltd.
- Plastipak Holdings Inc.
- Nampak Ltd.
- Orora Limited
- Graphic Packaging International
- Toyo Seikan Group Holdings Ltd.
- Envases Universales
- Berlin Packaging LLC
- Sidel (Sidel Group)
- Krones AG
Additional Benefits:
- The market estimate (ME) sheet in Excel format
- 3 months of analyst support
TABLE OF CONTENTS
1 INTRODUCTION
- 1.1 Study Assumptions and Market Definition
- 1.2 Scope of the Study
2 RESEARCH METHODOLOGY
3 EXECUTIVE SUMMARY
4 MARKET LANDSCAPE
- 4.1 Market Overview
- 4.2 Market Drivers
- 4.2.1 Surge in Craft Breweries Driving Short-Run Can Designs in North America
- 4.2.2 Rising Adoption of Lightweight Returnable Glass Bottles Backed by EU Deposit-Return Schemes
- 4.2.3 Rapid Cold-Chain Expansion Enabling PET Penetration in Asian Beer
- 4.2.4 Brand Premiumization Fueling Embossed Specialty Bottles Among German Breweries
- 4.2.5 Aluminum Tariff Cuts Triggering Can Conversions in South America
- 4.2.6 E-commerce Multipacks Accelerating Corrugated Secondary Packaging Demand in the UK
- 4.3 Market Restraints
- 4.3.1 Legislative Bans on Single-Use Plastics Curtailing PET in Europe
- 4.3.2 Tight U.S. Aluminum Slab Supply Elevating Can Costs for Craft Brewers
- 4.3.3 Consumer Shift to Hard Seltzers Reducing Glass Volumes in Australia
- 4.3.4 High Cap-Ex for Keg Refurbishment Limiting Returnability in Emerging Markets
- 4.4 Supply-Chain Analysis
- 4.5 Regulatory Outlook
- 4.6 Porter's Five Forces Analysis
- 4.6.1 Threat of New Entrants
- 4.6.2 Bargaining Power of Buyers/Consumers
- 4.6.3 Bargaining Power of Suppliers
- 4.6.4 Threat of Substitute Products
- 4.6.5 Intensity of Competitive Rivalry
5 MARKET SIZE AND GROWTH FORECASTS (VALUE)
- 5.1 By Packaging Material
- 5.1.1 Glass
- 5.1.2 Metal
- 5.1.3 PET
- 5.1.4 Paper
- 5.2 By Packaging Type
- 5.2.1 Bottle
- 5.2.2 Can
- 5.2.3 Keg
- 5.2.4 Pouches
- 5.3 By Pack Size
- 5.3.1 Less than 330 ml
- 5.3.2 331-650 ml
- 5.3.3 More than 650 ml
- 5.4 By Distribution Channel
- 5.4.1 Direct Sales
- 5.4.2 Indirect Sales
- 5.5 By Geography
- 5.5.1 North America
- 5.5.1.1 United States
- 5.5.1.2 Canada
- 5.5.1.3 Mexico
- 5.5.2 Europe
- 5.5.2.1 Germany
- 5.5.2.2 United Kingdom
- 5.5.2.3 France
- 5.5.2.4 Italy
- 5.5.2.5 Spain
- 5.5.2.6 Russia
- 5.5.2.7 Rest of Europe
- 5.5.3 Asia-Pacific
- 5.5.3.1 China
- 5.5.3.2 India
- 5.5.3.3 Japan
- 5.5.3.4 South Korea
- 5.5.3.5 Australia and New Zealand
- 5.5.3.6 Rest of Asia-Pacific
- 5.5.4 Middle East and Africa
- 5.5.4.1 Middle East
- 5.5.4.1.1 United Arab Emirates
- 5.5.4.1.2 Saudi Arabia
- 5.5.4.1.3 Turkey
- 5.5.4.1.4 Rest of Middle East
- 5.5.4.2 Africa
- 5.5.4.2.1 South Africa
- 5.5.4.2.2 Nigeria
- 5.5.4.2.3 Egypt
- 5.5.4.2.4 Rest of Africa
- 5.5.5 South America
- 5.5.5.1 Brazil
- 5.5.5.2 Argentina
- 5.5.5.3 Rest of South America
- 5.5.1 North America
6 COMPETITIVE LANDSCAPE
- 6.1 Market Concentration
- 6.2 Strategic Moves
- 6.3 Market Share Analysis
- 6.4 Company Profiles (includes Global level Overview, Market level overview, Core Segments, Financials as available, Strategic Information, Market Rank/Share for key companies, Products and Services, and Recent Developments)
- 6.4.1 Amcor Ltd.
- 6.4.2 Ardagh Group SA
- 6.4.3 Crown Holdings Inc.
- 6.4.4 Ball Corporation
- 6.4.5 Tetra Laval International SA
- 6.4.6 O-I Glass Inc.
- 6.4.7 Canpack Group
- 6.4.8 Silgan Holdings Inc.
- 6.4.9 Vidrala SA
- 6.4.10 Allied Glass Containers Ltd.
- 6.4.11 Plastipak Holdings Inc.
- 6.4.12 Nampak Ltd.
- 6.4.13 Orora Limited
- 6.4.14 Graphic Packaging International
- 6.4.15 Toyo Seikan Group Holdings Ltd.
- 6.4.16 Envases Universales
- 6.4.17 Berlin Packaging LLC
- 6.4.18 Sidel (Sidel Group)
- 6.4.19 Krones AG
7 MARKET OPPORTUNITIES AND FUTURE OUTLOOK
- 7.1 White-space and Unmet-Need Assessment
 啤酒包装市场:2026-2032年全球市场预测(依包装类型、材质、包装尺寸及瓶盖类型划分)
 啤酒包装市场规模、份额、趋势和预测:按材料类型、包装类型、形式和地区划分,2026-2034 年
 全球啤酒包装市场:市场规模、份额、成长和行业分析:按材料类型、产品类型和区域预测(至2034年)
 2026年全球啤酒包装市场报告
 啤酒桶市场 - 全球产业规模、份额、趋势、机会和预测(按材料、应用、产能、地区、竞争格局划分,2021-2031年)
 啤酒包装市场规模、份额及成长分析(按类型、材料、啤酒类型及地区划分)-2026-2033年产业预测
 美国啤酒包装市场规模、份额、趋势分析报告:按材料、产品、最终用途、细分市场预测,2025-2030 年啤酒包装市场规模、份额、趋势分析报告:按材料、产品、最终用途、地区、细分市场预测,2025-2030 年
 2032 年啤酒桶市场预测:按类型、材料、容量、分销管道、最终用户和地区进行的全球分析
 啤酒包装全球市场报告:趋势、预测和竞争分析(至 2031 年)