


 |
市场调查报告书
商品编码
1851514
燃料电池:市场份额分析、行业趋势、统计数据和成长预测(2025-2030 年)Fuel Cell - Market Share Analysis, Industry Trends & Statistics, Growth Forecasts (2025 - 2030) |
||||||
※ 本网页内容可能与最新版本有所差异。详细情况请与我们联繫。
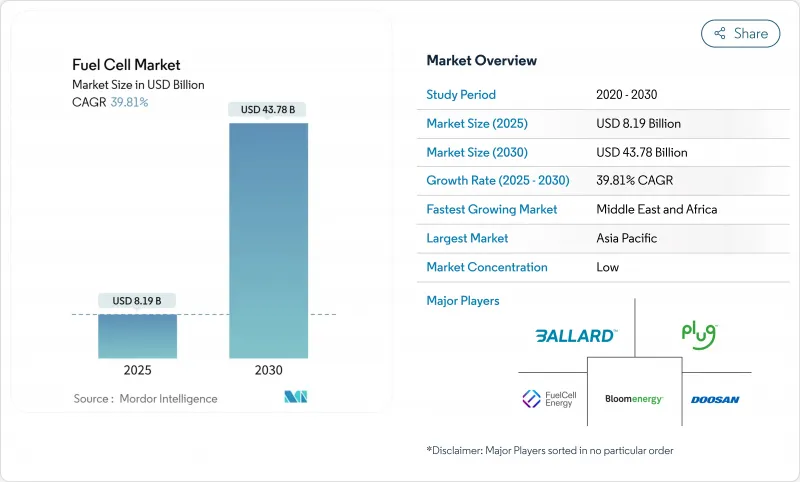
预计到 2025 年,燃料电池市场规模将达到 81.9 亿美元,到 2030 年将达到 437.8 亿美元,预测期(2025-2030 年)复合年增长率为 39.81%。
燃料电池市场的扩张主要得益于交通运输、资料中心和公用事业规模应用领域需求的激增,而这些领域都受惠于清洁能源政策的推动。绿氢和蓝氢的成本下降、亚太地区加氢走廊的快速建设以及重型卡车製造商加速投资,都拓宽了燃料电池的商业性路径。创新势头正转向用于固定负载的固体氧化物燃料电池,而固体电解质膜燃料电池在汽车、巴士和堆高机领域仍占据主导地位。铂族金属供应链风险和氢基础设施的不足限制了近期增长,而航运运营商和公共产业日益增长的兴趣则进一步扩大了燃料电池市场的潜在用户群。
全球燃料电池市场趋势与洞察
绿色和蓝氢生产成本下降
美国清洁氢气生产税额扣抵(最高可达3美元/公斤)和欧盟可再生能源指令中针对工业领域42%可再生氢气配额等政策奖励,正在推动投资项目的发展。 2020年至2024年间,最终做出投资决策的计划数量激增七倍,反映出资本流动的不断深化。由于氢燃料通常占燃料电池总拥有成本的近一半,因此价格较低的氢分子将直接促进其更广泛的应用。燃料电池市场的先驱者预测,价格低于2美元/公斤的氢气将成为推动远距运输车辆实现与柴油价格持平的关键因素。
亚太地区汽车製造商对燃料电池电动车的承诺
丰田、现代和本田已承诺投入数十亿美元用于氢能蓝图,其中包括未来两年内供应4.5万辆燃料电池电动车(FCEV)的协议。中国的目标是到2035年实现100万辆燃料电池汽车和2000座加氢站,而韩国则将氢燃料电池卡车纳入其国家智慧电网计画。汽车製造商正透过调整生产计画、与能源公司成立合资企业以及共同投资建造加氢站来缩短规模化生产的时间。这些需求讯号会透过电堆供应商、压缩机製造商和加氢站整合商传递到燃料电池市场。
日本和韩国以外地区氢气加註基础设施的匮乏
除日本和韩国的成熟走廊外,其他地区的加氢网络密度仍不足。德国拥有约170座公共加氢站,在欧洲处于领先地位,但其覆盖范围仍无法满足区域货运路线的需求。在美国,只有加州开展了大规模的加氢建设计画,而每公斤12-15美元的加氢价格阻碍了车队的全面部署。基础建设的不足减缓了车队的转型速度,延长了早期用户的投资回收期,并降低了燃料电池市场的整体规模。
细分市场分析
预计车辆领域将在燃料电池市场中扮演核心角色,到2024年将占全球销售量的80.9%。商用卡车、城市公车和轻型车辆均依赖PEMFC架构来实现快速加氢和远距。近期235辆氢燃料电池卡车的批发销售,以及欧洲燃料电池公车的大订单,显示市场需求曲线正趋于成熟。随着氢气价格的下降和维护成本的降低,燃料电池与柴油车的总成本差距正在缩小。
资料中心、通讯塔和医院等固定式应用占据剩余的19.1%市场份额,并且成长迅速。超大规模业者正在试验建造兆瓦级燃料电池系统,以取代柴油发电机。这些早期成功案例表明,随着运作时间和排放法规的逐步完善,燃料电池市场在2030年后行动应用和固定式应用之间的份额将更加均衡。
预计2024年,PEMFC(质子交换膜燃料电池)将维持70.4%的市场份额,主要得益于乘用车和物料输送车队的应用。其较低的工作温度允许频繁启停,从而提高了在都市区的运转率。此外,电堆寿命的延长和膜回收计画的实施将进一步提升PEMFC的经济效益。
然而,固态氧化物燃料电池(SOFC)预计将以最快的速度成长,到2030年复合年增长率(CAGR)将达到51.1%。其接近60%的电力效率和灵活的燃料配置将使公共产业和资料中心客户能够今天运作管道天然气,明天使用氢气。 Bloom Energy的多兆瓦订单凸显了这项转变。因此,预计到2035年,SOFC系统的燃料电池市场规模将超过200亿美元,这反映了其在基本负载替代和微电网应用的多元化需求。碱性燃料电池、磷酸燃料电池和熔融碳酸盐燃料电池则满足特定的工业需求,并完善了燃料电池的技术频谱。
燃料电池市场报告按应用(车辆、非车辆)、技术(聚合物电解质膜燃料电池、固体氧化物燃料电池、碱性燃料电池、其他)、燃料类型(氢气、天然气、氨气、其他)、终端用户行业(运输、公共产业、商业和工业、其他)以及地区(北美、欧洲、亚太地区、南美、中东和非洲)进行细分。
区域分析
到2024年,亚太地区将占据全球燃料电池市场57.8%的份额。日本的战略蓝图对燃料电池汽车和家用微型热电联产装置提供补贴,而韩国则将氢能与智慧城市计画捆绑在一起。中国设定了2035年拥有100万辆燃料电池电动车和2000座加氢站的目标,这一规模在其他国家都无法比拟。地方政府正在资助电解槽建设并免除通行费,以降低车辆营运成本。成熟的汽车集团正在将燃料电池整合到卡车、SUV和堆高机中,从而锁定区域供应商的零件需求。
北美位居第二,这主要得益于美国的政策利好。清洁氢气生产扣除额和七个区域氢能中心将调动数十亿美元资金用于电解、储存和下游计划。加州的先进清洁卡车法规正在推动中型和重型车队的早期需求,而加拿大各省则在支持氢燃料电池公车的发展。德克萨斯州、伊利诺伊州和维吉尼亚的数据中心营运商已签署合同,建造兆瓦级固体氧化物燃料电池(SOFC)电站,以提高电网可靠性,进一步深化了该地区的燃料电池市场。
欧洲将利用其「Fit-for-55」气候方案,推动燃料电池在卡车、铁路和海运领域的应用。最新的二氧化碳排放标准要求在2040年将重型车辆排放气体减少90%,这使得氢动力成为一条切实可行的途径。德国拥有超过170座公共站,在欧洲大陆处于领先地位。欧洲氢能银行和创新基金为竞标提供津贴,以降低电解槽和燃料电池堆工厂规模化建设的风险。从西班牙到法国的跨境管线升级改造将为未来的绿色氢气输送奠定基础设施基础。
预计中东和非洲将成为成长最快的地区,年复合成长率预计达到41.2%。丰富的太阳能和风能资源将打造一个具有竞争力的绿氢能出口中心。埃及、阿联酋和沙乌地阿拉伯都计划建造数吉瓦级电解槽园区,并与氨生产系统相连,为航运客户提供服务。现有的天然气管道和港口基础设施为向氢燃料转型提供了平台。非洲各国正在转向本地燃料电池微电网,以稳定脆弱的电网并取代柴油发电机,预示着新一轮需求的到来。
其他福利:
- Excel格式的市场预测(ME)表
- 3个月的分析师支持
目录
第一章 引言
- 研究假设和市场定义
- 调查范围
第二章调查方法
第三章执行摘要
第四章 市场情势
- 市场概览
- 最新进展
- 市场驱动因素
- 绿色和蓝氢发电成本下降
- 亚太地区汽车製造商对燃料电池电动车的承诺
- 政府对重型车辆运输的零排放强制规定(北美和欧盟)
- 资料中心对长期备用电源的需求
- 海洋脱碳目标推动燃料电池发展
- 企业现场分散式发电的净零投资
- 市场限制
- 日本和韩国以外地区氢气加註基础设施的匮乏
- 铂族金属和镍价格波动推高了累积成本。
- 在近海高硫环境中,固态氧化物燃料电池(SOFC)的性能劣化
- 美国建筑规范认证的漏洞延缓了固定设施的安装。
- 供应链分析
- 监理展望
- 技术展望
- 波特五力模型
- 供应商的议价能力
- 消费者议价能力
- 新进入者的威胁
- 替代品的威胁
- 竞争对手之间的竞争
第五章 市场规模与成长预测
- 透过使用
- 车辆(轿车、巴士和长途客车、卡车、物料输送设备、铁路、船舶)
- 非车辆用电(固定式电源、可携式电源、微型热电联产)
- 透过技术
- 聚合物电解质膜燃料电池(PEMFC)
- 固体氧化物燃料电池(SOFC)
- 碱性燃料电池(AFC)
- 其他[磷酸燃料电池(PAFC)、熔融碳酸盐燃料电池(MCFC)、直接甲醇燃料电池(DMFC)]。
- 按燃料类型
- 氢
- 天然气/甲烷
- 氨
- 其他(甲醇、沼气)
- 按最终用户行业划分
- 运输
- 公用事业
- 商业和工业
- 其他(国防、住房)
- 按地区
- 北美洲
- 美国
- 加拿大
- 墨西哥
- 欧洲
- 英国
- 德国
- 法国
- 西班牙
- 北欧国家
- 俄罗斯
- 其他欧洲地区
- 亚太地区
- 中国
- 印度
- 日本
- 韩国
- 马来西亚
- 泰国
- 印尼
- 越南
- 澳洲
- 亚太其他地区
- 南美洲
- 巴西
- 阿根廷
- 哥伦比亚
- 南美洲其他地区
- 中东和非洲
- 阿拉伯聯合大公国
- 沙乌地阿拉伯
- 南非
- 其他中东和非洲地区
- 北美洲
第六章 竞争情势
- 市场集中度
- 策略性倡议(併购、伙伴关係、购电协议)
- 市场占有率分析(主要企业的市场排名/份额)
- 公司简介
- Ballard Power Systems Inc.
- Plug Power Inc.
- FuelCell Energy Inc.
- Bloom Energy Corporation
- Doosan Fuel Cell Co., Ltd.
- Cummins Inc.(Hydrogenics)
- Toshiba Energy Systems & Solutions Corp.
- Panasonic Corporation
- Horizon Fuel Cell Technologies Pte. Ltd.
- Intelligent Energy Ltd.
- Nuvera Fuel Cells, LLC
- SFC Energy AG
- Mitsubishi Power Ltd.
- Hyundai Mobis Co., Ltd.
- Toyota Motor Corporation
- Nikola Corporation
- Ceres Power Holdings plc
- Ballard Motive Solutions Ltd.
- PowerCell Sweden AB
- AFC Energy plc
- Advent Technologies Holdings Inc.
- Gencell Ltd.
- Proton Motor Power Systems plc
第七章 市场机会与未来展望
The Fuel Cell Market size is estimated at USD 8.19 billion in 2025, and is expected to reach USD 43.78 billion by 2030, at a CAGR of 39.81% during the forecast period (2025-2030).
Expansion is rooted in surging demand from transportation, data centers, and utility-scale applications, each benefiting from cleaner-energy policy mandates. Falling costs of green and blue hydrogen, rapid roll-outs of hydrogen refueling corridors in Asia-Pacific, and accelerating investment from heavy-duty truck makers together widen commercial pathways. Innovation momentum is shifting toward solid oxide fuel cells that serve stationary loads, while polymer electrolyte membrane fuel cells continue to dominate cars, buses, and forklifts. Growing interest from maritime operators and utilities further broadens the addressable base of the fuel cell market, even as supply-chain risks around platinum group metals and hydrogen infrastructure gaps temper near-term growth.
Global Fuel Cell Market Trends and Insights
Falling Costs of Green & Blue Hydrogen Generation
Green hydrogen production costs are set to decline by up to 60% by 2030 as electrolyzer manufacturing scales and renewable power prices fall.Policy incentives such as the U.S. Clean Hydrogen Production Tax Credit of up to USD 3.00/kg and the EU Renewable Energy Directive's 42% renewable-hydrogen quota for industry underpin investment pipelines. A seven-fold jump in projects reaching final investment decision between 2020 and 2024 reflects deepening capital flows. As hydrogen fuel typically represents nearly half of a fuel cell's total cost of ownership, cheaper molecules directly widen adoption. Developers in the fuel cell market anticipate that sub-USD 2/kg hydrogen will trigger parity with diesel in long-haul fleets.
Automaker Commitments to FCEVs in Asia-Pacific
Toyota, Hyundai, and Honda have collectively pledged multi-billion-dollar roadmaps for hydrogen mobility, including supply contracts for 45,000 FCEVs over the next two years. China targets 1 million fuel-cell vehicles and 2,000 stations by 2035, while South Korea links hydrogen trucks to its national smart-grid plan. Automakers' aligned production schedules, joint ventures with energy firms, and station co-investment compress scale-up timelines. Their demand signals cascade along the fuel cell market through stack suppliers, compressor makers, and refueling integrators.
Scarcity of Hydrogen Refueling Infrastructure Outside JP & KR
Network density remains insufficient outside the mature corridors of Japan and South Korea. Germany leads Europe with about 170 public hydrogen stations, yet coverage still trails the needs of regional trucking routes. In the U.S., only California offers a cohesive buildout plan, and pump prices of USD 12-15/kg deter fleet wide roll-outs. Infrastructure delays slow fleet conversion, stretching payback periods for early adopters and reducing overall volumes in the fuel cell market.
Other drivers and restraints analyzed in the detailed report include:
- Government Zero-Emission Mandates in Heavy-Duty Transport (NA & EU)
- Demand for Long-Duration Backup Power in Data Centers
- PGM & Nickel Price Volatility Inflating Stack Costs
For complete list of drivers and restraints, kindly check the Table Of Contents.
Segment Analysis
The vehicular segment generated 80.9% of global revenue in 2024, confirming its central role within the fuel cell market. Commercial trucks, city buses, and light-duty cars rely on PEMFC architecture that delivers fast refueling and long range. Recent wholesale of 235 hydrogen trucks, coupled with bulk orders for European fuel-cell buses, signals maturing demand curves. The total cost gap versus diesel narrows as hydrogen prices fall and maintenance savings accrue.
Stationary deployments for data centers, telecom towers, and hospitals capture the remaining 19.1% share, yet post sharp growth. Hyperscale operators trial multi-megawatt installations that displace diesel gensets. These early wins suggest that the fuel cell market will balance more evenly between mobile and stationary uses after 2030 as uptime and emission credentials prove out.
PEMFC retained a 70.4% share in 2024, underpinned by passenger cars and material-handling fleets. Its low operating temperature suits frequent starts and stops, which lifts utilization rates in urban duty cycles. Stack lifetime improvements and membrane recycling programs further cement PEMFC economics.
SOFC, however, is the fastest climber with a forecast 51.1% CAGR to 2030. Electrical efficiencies near 60% and flexible fuel inputs empower utilities and data-center customers to run on pipeline gas today and hydrogen tomorrow. Bloom Energy's multi-megawatt orders underscore this inflection. As a result, the fuel cell market size for SOFC systems is expected to pass USD 20 billion by 2035, reflecting a mix of base-load replacements and microgrid applications. Alkaline, phosphoric acid, and molten carbonate fuel cells address specific industrial niches, completing the technology spectrum.
The Fuel Cell Market Report is Segmented by Application (Vehicular and Non-Vehicular), Technology (Polymer Electrolyte Membrane Fuel Cell, Solid Oxide Fuel Cell, Alkaline Fuel Cell, and Others), Fuel Type (Hydrogen, Natural Gas, Ammonia, and Others), End-User Industry (Transportation, Utilities, Commercial and Industrial, and Others), and Geography (North America, Europe, Asia-Pacific, South America, and Middle East and Africa).
Geography Analysis
Asia-Pacific held a 57.8% share of the fuel cell market in 2024. Japan's strategic roadmap subsidizes fuel-cell cars and residential micro-CHP units, while South Korea bundles hydrogen with smart-city initiatives. China's target of 1 million FCEVs and 2,000 stations by 2035 signals a scale unmatched elsewhere. Local governments fund electrolyzers and provide toll exemptions that cut fleet operating costs. Established automotive groups embed fuel cells across trucks, SUVs, and forklifts, locking in component demand for regional suppliers.
North America ranked second, propelled by policy tailwinds in the United States. The Clean Hydrogen Production Tax Credit and seven Regional Hydrogen Hubs mobilize billions toward electrolysis, storage, and downstream projects. California's Advanced Clean Trucks rule anchors early demand in medium- and heavy-duty fleets, while Canadian provinces support hydrogen buses. Data-center operators in Texas, Illinois, and Virginia are contracting multi-megawatt SOFC plants to bolster grid reliability, adding depth to the regional fuel cell market.
Europe leverages its Fit-for-55 climate package to stimulate fuel-cell adoption in trucks, rail, and maritime. Updated CO2 standards require a 90% cut in heavy-duty vehicle emissions by 2040, making hydrogen propulsion a credible path. Germany's 170-plus public stations lead continental coverage. The European Hydrogen Bank and Innovation Fund align bidders with grant finance, derisking scale-up for electrolyzer and stack plants. Cross-border pipeline upgrades from Spain to France pave the infrastructure for future green-hydrogen flows.
The Middle East & Africa offers the fastest growth outlook at a forecast 41.2% CAGR. Ample solar and wind resources enable competitive green-hydrogen export hubs. Egypt, the United Arab Emirates, and Saudi Arabia each map multi-gigawatt electrolyzer parks tied to ammonia production for shipping customers. Existing natural-gas pipelines and port infrastructure provide a ready platform for conversion to hydrogen blends. African economies eye local fuel-cell microgrids that stabilize weak grids and displace diesel gensets, signalling a fresh demand wave.
- Ballard Power Systems Inc.
- Plug Power Inc.
- FuelCell Energy Inc.
- Bloom Energy Corporation
- Doosan Fuel Cell Co., Ltd.
- Cummins Inc. (Hydrogenics)
- Toshiba Energy Systems & Solutions Corp.
- Panasonic Corporation
- Horizon Fuel Cell Technologies Pte. Ltd.
- Intelligent Energy Ltd.
- Nuvera Fuel Cells, LLC
- SFC Energy AG
- Mitsubishi Power Ltd.
- Hyundai Mobis Co., Ltd.
- Toyota Motor Corporation
- Nikola Corporation
- Ceres Power Holdings plc
- Ballard Motive Solutions Ltd.
- PowerCell Sweden AB
- AFC Energy plc
- Advent Technologies Holdings Inc.
- Gencell Ltd.
- Proton Motor Power Systems plc
Additional Benefits:
- The market estimate (ME) sheet in Excel format
- 3 months of analyst support
TABLE OF CONTENTS
1 Introduction
- 1.1 Study Assumptions & Market Definition
- 1.2 Scope of the Study
2 Research Methodology
3 Executive Summary
4 Market Landscape
- 4.1 Market Overview
- 4.2 Recent Trends & Developments
- 4.3 Market Drivers
- 4.3.1 Falling Costs of Green & Blue Hydrogen Generation
- 4.3.2 Automaker Commitments to FCEVs in Asia-Pacific
- 4.3.3 Government Zero-Emission Mandates in Heavy-Duty Transport (NA & EU)
- 4.3.4 Demand for Long-Duration Backup Power in Data Centers
- 4.3.5 Maritime Decarbonization Targets Accelerating Fuel Cell Adoption
- 4.3.6 Corporate Net-Zero Investment into On-Site Distributed Generation
- 4.4 Market Restraints
- 4.4.1 Scarcity of Hydrogen Refueling Infrastructure Outside JP & KR
- 4.4.2 PGM & Nickel Price Volatility Inflating Stack Costs
- 4.4.3 SOFC Performance Degradation in Maritime High-Sulfur Environments
- 4.4.4 Certification Gaps in US Building Codes Slowing Stationary Installations
- 4.5 Supply-Chain Analysis
- 4.6 Regulatory Outlook
- 4.7 Technological Outlook
- 4.8 Porte's Five Forces
- 4.8.1 Bargaining Power of Suppliers
- 4.8.2 Bargaining Power of Consumers
- 4.8.3 Threat of New Entrants
- 4.8.4 Threat of Substitute Products & Services
- 4.8.5 Intensity of Competitive Rivalry
5 Market Size & Growth Forecasts
- 5.1 By Application
- 5.1.1 Vehicular (Passenger Cars, Buses & Coaches, Trucks, Material Handling Equipment, Rail, Marine Vessels)
- 5.1.2 Non-Vehicular (Stationary Power, Portable Power, Micro-Combined Heat & Power)
- 5.2 By Technology
- 5.2.1 Polymer Electrolyte Membrane Fuel Cell (PEMFC)
- 5.2.2 Solid Oxide Fuel Cell (SOFC)
- 5.2.3 Alkaline Fuel Cell (AFC)
- 5.2.4 Others [Phosphoric Acid Fuel Cell (PAFC), Molten Carbonate Fuel Cell (MCFC), Direct Methanol Fuel Cell (DMFC)]
- 5.3 By Fuel Type
- 5.3.1 Hydrogen
- 5.3.2 Natural Gas/Methane
- 5.3.3 Ammonia
- 5.3.4 Others (Methanol, Biogas)
- 5.4 By End-User Industry
- 5.4.1 Transportation
- 5.4.2 Utilities
- 5.4.3 Commercial and Industrial
- 5.4.4 Others (Defense, Residential)
- 5.5 By Geography
- 5.5.1 North America
- 5.5.1.1 United States
- 5.5.1.2 Canada
- 5.5.1.3 Mexico
- 5.5.2 Europe
- 5.5.2.1 United Kingdom
- 5.5.2.2 Germany
- 5.5.2.3 France
- 5.5.2.4 Spain
- 5.5.2.5 Nordic Countries
- 5.5.2.6 Russia
- 5.5.2.7 Rest of Europe
- 5.5.3 Asia-Pacific
- 5.5.3.1 China
- 5.5.3.2 India
- 5.5.3.3 Japan
- 5.5.3.4 South Korea
- 5.5.3.5 Malaysia
- 5.5.3.6 Thailand
- 5.5.3.7 Indonesia
- 5.5.3.8 Vietnam
- 5.5.3.9 Australia
- 5.5.3.10 Rest of Asia-Pacific
- 5.5.4 South America
- 5.5.4.1 Brazil
- 5.5.4.2 Argentina
- 5.5.4.3 Colombia
- 5.5.4.4 Rest of South America
- 5.5.5 Middle East and Africa
- 5.5.5.1 United Arab Emirates
- 5.5.5.2 Saudi Arabia
- 5.5.5.3 South Africa
- 5.5.5.4 Rest of Middle East and Africa
- 5.5.1 North America
6 Competitive Landscape
- 6.1 Market Concentration
- 6.2 Strategic Moves (M&A, Partnerships, PPAs)
- 6.3 Market Share Analysis (Market Rank/Share for key companies)
- 6.4 Company Profiles (includes Global level Overview, Market level overview, Core Segments, Financials as available, Strategic Information, Products & Services, and Recent Developments)
- 6.4.1 Ballard Power Systems Inc.
- 6.4.2 Plug Power Inc.
- 6.4.3 FuelCell Energy Inc.
- 6.4.4 Bloom Energy Corporation
- 6.4.5 Doosan Fuel Cell Co., Ltd.
- 6.4.6 Cummins Inc. (Hydrogenics)
- 6.4.7 Toshiba Energy Systems & Solutions Corp.
- 6.4.8 Panasonic Corporation
- 6.4.9 Horizon Fuel Cell Technologies Pte. Ltd.
- 6.4.10 Intelligent Energy Ltd.
- 6.4.11 Nuvera Fuel Cells, LLC
- 6.4.12 SFC Energy AG
- 6.4.13 Mitsubishi Power Ltd.
- 6.4.14 Hyundai Mobis Co., Ltd.
- 6.4.15 Toyota Motor Corporation
- 6.4.16 Nikola Corporation
- 6.4.17 Ceres Power Holdings plc
- 6.4.18 Ballard Motive Solutions Ltd.
- 6.4.19 PowerCell Sweden AB
- 6.4.20 AFC Energy plc
- 6.4.21 Advent Technologies Holdings Inc.
- 6.4.22 Gencell Ltd.
- 6.4.23 Proton Motor Power Systems plc
7 Market Opportunities & Future Outlook
- 7.1 White-space & Unmet-Need Assessment
 2026年全球再生燃料电池市场报告
 电池和燃料电池材料市场规模、份额和成长分析:按材料类型、应用、终端用户产业和地区划分-2026-2033年产业预测
 全球燃料电池工厂相关设备市场规模、份额、趋势和成长分析报告(2026-2034年)燃料电池全球市场规模、份额、趋势和成长分析报告(2026-2034)2026年全球太空燃料电池市场报告2026年全球燃料电池市场报告
 燃料电池市场-全球产业规模、份额、趋势、机会及预测(按类型、应用、规模、地区及竞争格局划分,2021-2031年)
 2026-2030年全球Nafion市场
 质子传导陶瓷燃料电池(PCFC)市场规模、份额和成长分析(按类型、应用和地区划分)-产业预测(2026-2033)
 下一代反应材料平台市场预测至2032年:按材料类型、反应机制、整合度、技术、最终用户和地区分類的全球分析