


 |
市场调查报告书
商品编码
1851545
饮料包装:市场份额分析、行业趋势、统计数据和成长预测(2025-2030 年)Beverage Packaging - Market Share Analysis, Industry Trends & Statistics, Growth Forecasts (2025 - 2030) |
||||||
※ 本网页内容可能与最新版本有所差异。详细情况请与我们联繫。
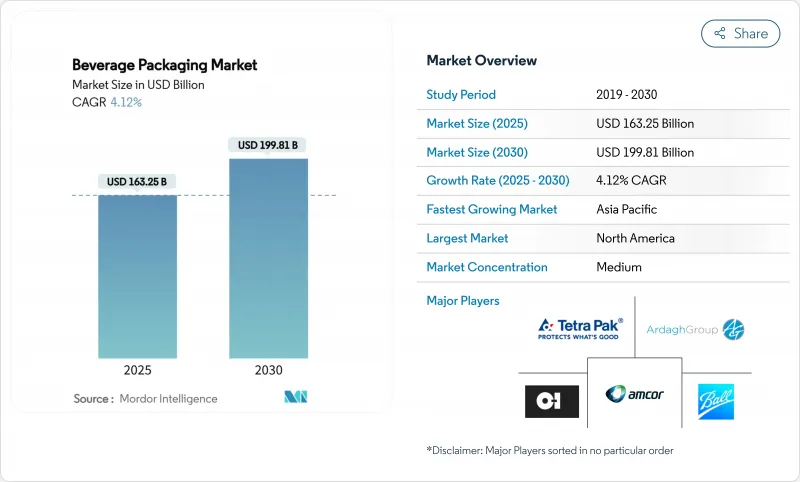
预计到 2025 年,饮料包装市场价值将达到 1,632.5 亿美元,到 2030 年将达到 1998.1 亿美元,年复合成长率为 4.12%。
推动成长的因素包括全球范围内对再生材料含量基准值制定的统一法规,以及高端饮料新品上市和铝罐产能扩张等并行需求引擎。能够应对再生材料含量强制性要求、不断上涨的原生树脂成本以及消费者偏好转向低环境影响包装形式的包装供应商正在赢得市场份额。对闭合迴路回收、数位浮水印和适用于电商的多包装产品进行策略性投资,正在使后进企业分开来。诸如安靠(Amkor)和贝里全球(Berry Global)即将进行的合併等整合,持续重塑着竞争格局,为拥有多元化产品组合的公司带来规模经济效益。
全球饮料包装市场趋势与洞察
优质化即饮饮料
高端即饮饮料的推出正促使品牌商从普通塑胶包装升级为玻璃或精製铝包装。在英国,价值168亿英镑(212亿美元)的烈酒产业预计到2030年将以每年16.2%的速度成长,仅2023年就有超过50家新的酿酒厂开业。 92%的美国消费者将玻璃与品质和无限循环利用联繫起来,玻璃供应商正利用这一高端趋势。品牌商将晶莹剔透的容器与智慧瓶盖和QR码标籤结合,提供产品来源资讯、会员奖励和认证回收方式。饮料包装市场正受惠于高端产品每公升包装成本的增加,从而抵消了主流碳酸软性饮料销售疲软的影响。
铝罐产能快速扩张
铝的无限可回收性和超过70%的闭合迴路回收率正在推动全球产能竞赛。波尔公司正在佛罗里达州增设一条生产线,并计划于2024年在奥勒冈州破土动工兴建一座工厂。诺贝丽斯公司正在阿拉巴马州建造一座年产60万吨的轧延,这是该公司与阿达格公司签订的长期供应协议的一部分,因为预计到2031年,纸板需求将以每年4%的速度增长。因此,在饮料包装市场,综合金属供应商正在获得成本竞争力和永续性通讯的优势,对啤酒和发泡水的塑胶包装构成压力。
原生树脂价格不稳定
2025年初,原油价格波动和炼油厂停产推高了PTA和MEG的成本,迫使中国和欧洲的聚酯瓶盖生产商閒置产能以调整库存。持有现货树脂合约的包装加工商利润空间受到压缩,促使他们转向远期合约和机械回收。因此,饮料包装市场正倾向于那些持有可回收原材料库存的供应商,以保护其客户免受价格波动的影响。
细分市场分析
到2024年,塑胶将占销售额的42%,反映了其成熟的供应链和成本优势。然而,再生材料含量强制要求和不断扩大的押金返还政策对PET的主导地位构成了挑战。儘管轻量化和化学回收计划持续推进,但塑胶饮料包装市场规模预计仅以4.12%的复合年增长率成长,市场份额仍在萎缩。纸板的复合年增长率高达6.65%,是所有材料中最高的。以铝罐为代表的金属包装的復兴,显示监管机构和消费者对可再生或无限循环利用的基材的需求日益增长。 Graphic Packaging International推出的Boardio纸板罐和EnviroClip包装盒,旨在取代先前使用收缩膜包装的碳酸饮料多包装。一体化工厂利用国内纤维供应和75%的回收率来应对原生树脂价格的波动。
儘管物流排放不断增加,饮料包装产业也正在见证玻璃作为一种高端材料的重新定位。 OI Glass公司正投资1.5亿美元对其位于英国阿洛阿的工厂进行现代化改造,采用混合熔炉和轻质瓶,目标是到2030年减少25%的二氧化碳排放。 Novelis公司的工厂铝製封闭式回收率超过70%,显示该公司对长期需求充满信心。总而言之,这些转变意味着到2030年,随着材料组合的多样化,塑胶在饮料包装领域的市场份额将会下降,即使人口成长导致塑胶的绝对吨位增加。
由于瓶装饮料用途广泛,可用于盛装碳酸饮料、水、乳製品替代品和酒精饮料,预计到2024年,瓶装饮料将占饮料市场销售额的38%。在瓶装饮料的推动下,预计到2030年,饮料包装市场规模将以3.7%的年复合成长率温和成长,同时包装形式也将更加多样化。瓶盖支撑结构和先进的阻隔涂层(例如等离子涂层和二氧化硅涂层)进一步减轻了瓶身重量。然而,由于每公升包装的材料重量比瓶装饮料低60-80%,软包装将以7.23%的复合年增长率实现显着增长,使其更适合电商销售。
多包装葡萄酒和鸡尾酒袋采用单一材料复合材料,经受住了跌落测试,降低了运输成本,并逐渐被路边取货计划所接受。纸盒包装继续用于无菌乳製品、果汁以及现在的植物来源拿铁,这得益于利乐公司的超高温瞬时灭菌(UHT)灌装生产线,该生产线可减少25%的能源消耗。罐装产品在精酿啤酒、能量饮料和气泡水中仍占有一席之地,其快速冷却的特性有助于提升品牌忠诚度。虽然啤酒桶的销售量占比不到3%,仍属于小众产品,但不銹钢桶的循环利用周期超过25年,符合零废弃物的概念。
区域分析
2024年,北美地区占全球销售额的27%,主要得益于较高的人均饮料消费量和优质化的发展空间。皇冠控股公司(Crown Holdings)2024年北美销量成长5%,这主要得益于维吉尼亚和内华达州新增的易拉罐生产线。然而,各州关于繫绳瓶盖和生产者延伸责任费的法律法规造成了合规的复杂性,这有利于多元化跨国公司。加拿大到2030年实现rPET(再生聚对苯二甲酸乙二醇酯)统一的目标将促进区域回收基础设施的建设,并进一步加强饮料包装市场中的循环供应商。来自亚太地区的轻质瓶进口给国内加工商带来了竞争压力和成本挑战。
亚太地区预计到2030年将以5.61%的复合年增长率成长,主要受都市化和可支配所得成长的推动。在中国,2023年前10个月饮料产量增加了2.7%,其中啤酒产量激增22%。印度将于2025年4月起强制要求使用30%的再生PET(rPET),将对再生材料的需求产生影响,并对不合规者处以惩罚性课税。拥有内部回收设施的跨国公司(例如可口可乐在菲律宾的PETValue工厂)将占据市场优势,而规模较小的加工商则面临原材料短缺的问题。日本加工商正专注于「即食」健康饮品,并推广使用无菌包装袋进行便携式营养补充。
欧洲在严格的法规方面展现了领导力,例如于2025年2月生效的《塑胶包装和回收条例》(PPWR),该条例要求所有包装材料在2028年前必须可回收, 宝特瓶在2030年前必须使用30%的再生PET(rPET)。因此,欧元区饮料包装市场正在转向可回收设计通讯协定,例如单一材料套筒和水性油墨。食品级rPET的供需失衡维持了其溢价,并促进了灌装商和回收商之间的合作。在环境、社会和治理(ESG)限制下,玻璃产能正在合理化,导致区域葡萄酒和顶级烈酒的供应趋紧,有助于保持价值。随着零售商在各成员国努力推进塑胶减量蓝图,柔性纸基解决方案正日益受到青睐。
其他福利:
- Excel格式的市场预测(ME)表
- 3个月的分析师支持
目录
第一章 引言
- 研究假设和市场定义
- 调查范围
第二章调查方法
第三章执行摘要
第四章 市场情势
- 市场概览
- 市场驱动因素
- 优质化即饮饮料
- 铝罐产能快速扩张
- PET轻量化和繫绳帽法规
- 电子商务多件装商品(主要是酒类)的成长
- 数位浮水印在流通领域的兴起
- 浓缩饮料和「家用汽水」生态系统
- 市场限制
- 原生树脂价格不稳定
- 再生PET薄片供应瓶颈
- 加速推行反一次性塑胶政策
- 投资者对ESG的审查抑制了玻璃资本的投资
- 价值链分析
- 监管环境
- 技术展望
- 波特五力分析
- 供应商的议价能力
- 买方/消费者的议价能力
- 新进入者的威胁
- 替代品的威胁
- 竞争对手之间的竞争
- 评估市场宏观经济趋势
第五章 市场规模与成长预测
- 依材料类型
- 塑胶
- 金属
- 玻璃
- 纸板
- 依产品类型
- 瓶子
- 能
- 小袋
- 纸盒
- 啤酒桶
- 按包装类型
- 无菌
- 热填充
- 冷填充/碳酸化
- 蒸馏
- 可在常温储存
- 冷链配送
- 按饮料类型
- 碳酸饮料
- 酒精饮料
- 瓶装水
- 牛奶
- 果菜汁
- 能量饮料
- 植物性饮料
- 其他饮料类型
- 按地区
- 北美洲
- 美国
- 加拿大
- 墨西哥
- 欧洲
- 英国
- 德国
- 法国
- 义大利
- 西班牙
- 奥地利
- 波兰
- 俄罗斯
- 其他欧洲地区
- 亚太地区
- 中国
- 印度
- 日本
- 澳洲
- 亚太其他地区
- 南美洲
- 巴西
- 阿根廷
- 南美洲其他地区
- 中东
- 沙乌地阿拉伯
- 阿拉伯聯合大公国
- 土耳其
- 其他中东地区
- 非洲
- 南非
- 其他非洲地区
- 北美洲
第六章 竞争情势
- 市场集中度
- 策略趋势
- 市占率分析
- 公司简介
- Amcor plc
- Ball Corporation
- Tetra Laval International SA
- OI Glass Inc.
- Crown Holdings Inc.
- Ardagh Group SA
- Ardagh Metal Packaging SA
- Verallia SA
- Vidrala SA
- Vetropack Holding Ltd.
- Silgan Holdings Inc.
- Berry Global Group Inc.
- Mondi plc
- Sonoco Products Company
- CCL Industries Inc.
- Smurfit Kappa Group plc
- CANPACK SA
- Huhtamaki Oyj
- Toyo Seikan Group Holdings Ltd.
- Nampak Ltd.
- Krones AG
- Guala Closures Group
第七章 市场机会与未来展望
The beverage packaging market was valued at USD 163.25 billion in 2025 and is forecast to expand at a 4.12% CAGR, reaching USD 199.81 billion by 2030.
Growth is propelled by converging global regulations that standardize recycled-content thresholds, while premium ready-to-drink launches and a wave of aluminum-can capacity additions provide parallel demand engines. Packaging suppliers able to navigate recycled-material mandates, cost inflation for virgin resin, and shifting consumer preferences toward low-impact formats are capturing share. Strategic investments in closed-loop recycling, digital watermarking, and e-commerce-ready multipacks are differentiating leaders from laggards. Consolidation-exemplified by the pending Amcor-Berry Global merger-continues to reshape the competitive baseline, creating scale benefits for firms with multi-format portfolios.
Global Beverage Packaging Market Trends and Insights
Premiumisation in Ready-to-Drink Beverages
Premium RTD launches are prompting brands to upgrade from commoditized plastics to glass and sleek aluminum, enabling higher shelf price points while still meeting recycled-content requirements. In the United Kingdom, a spirits sector worth GBP 16.8 billion (USD 21.2 billion) in 2024 recorded more than 50 new distilleries during 2023, and RTD spirits are projected to expand 16.2% per year to 2030. Glass suppliers are capitalizing on premium cues, with 92% of US consumers associating glass with quality and infinite recyclability. Brand owners are pairing high-clarity containers with smart closures and QR-coded labels that unlock provenance data, loyalty rewards, and authenticated recycling instructions. The beverage packaging market benefits as premium SKUs carry higher packaging spend per liter, offsetting volume softness in mainstream carbonates.
Surge in Aluminium-Can Capacity Expansions
Aluminum's infinite recyclability and closed-loop recovery rates above 70% have spurred a global capacity race. Ball Corporation added a Florida line and broke ground on an Oregon plant in 2024. Novelis is building a 600,000-tonne rolling mill in Alabama under long-term supply agreements with Ardagh to accommodate forecast 4% annual can-sheet demand growth through 2031. The beverage packaging market therefore sees integrated metal suppliers gaining cost leverage and sustainability messaging advantages, pressuring plastics in beer and sparkling water.
Volatile Virgin-Resin Prices
Crude oil swings and refinery outages pushed PTA and MEG costs higher in early 2025, forcing polyester bottle-chip producers in China and Europe to idle capacity to re-balance inventories. Packaging converters on spot resin contracts saw margin compression, encouraging forward contracts or integration into mechanical recycling. The beverage packaging market therefore tilts toward suppliers holding equity stakes in recycle-ready feedstock, shielding customers from volatility.
Other drivers and restraints analyzed in the detailed report include:
- PET Lightweighting and Tethered-Cap Regulations
- Growth of E-commerce Multipacks
- Supply Bottlenecks for Recycled PET Flakes
For complete list of drivers and restraints, kindly check the Table Of Contents.
Segment Analysis
Plastic retained 42% of 2024 revenue, underlining entrenched supply chains and cost advantages. Yet recycled-content directives and deposit-return expansion are challenging PET's dominance. The beverage packaging market size for plastic is projected to advance only at the overall 4.12% CAGR, tempering its share despite ongoing lightweighting and chemical-recycling projects. Paperboard's 6.65% CAGR-highest among materials-and metal's comeback via aluminum cans illustrate regulatory pull and consumer push toward renewable or infinitely recyclable substrates. Graphic Packaging International's launch of Boardio paperboard canisters and EnviroClip carriers targets carbonated soft drink multipacks once controlled by shrink-film. Integrated mills leverage domestic fiber supply and 75% recycling rates, cushioning them against virgin-resin volatility.
The beverage packaging industry is also witnessing glass repositioned as a prestige material notwithstanding higher logistics emissions. O-I Glass committed USD 150 million to modernize its Alloa, UK plant with hybrid furnaces and lightweight bottles, aiming for a 25% CO2 cut by 2030. Aluminum enjoys a closed-loop rate above 70%, and Novelis' forthcoming mill signals confidence in long-term demand. Collectively, these shifts suggest a diversified material mix by 2030, with plastics losing points of beverage packaging market share even as absolute tonnage rises in line with population growth.
Bottles accounted for 38% of 2024 revenue thanks to versatility across carbonates, water, dairy alternates, and alcohol. The beverage packaging market size attributed to bottles is projected to grow modestly at 3.7% to 2030 amid format diversification. Tethered-cap compliance and advanced barrier coatings (e.g., plasma or silicon oxide) are unlocking incremental weight savings. However, pouches are set to capture outsized gains via a 7.23% CAGR, reflecting 60-80% lower material weight per liter and suitability for e-commerce.
Multipack wine and cocktail pouches withstand drop tests, reduce shipping costs, and utilize mono-material laminates increasingly accepted in curbside programs. Cartons continue to service aseptic dairy, juice, and now plant-based lattes, propelled by Tetra Pak's UHT filling lines with energy cuts of 25%. Cans sustain relevance through craft beer, energy drinks, and sparkling water, and their rapid chilling characteristics underpin brand loyalty. Beer kegs remain a niche at under 3% of volume, but stainless-steel re-use cycles of 25+ years align with zero-waste narratives.
The Beverage Packaging Market Report is Segmented by Material Type (Plastic, Metal, Glass, and Paperboard), Product Type (Bottles, Cans, Pouches, Cartons, and Beer Kegs), Packaging Format (Aseptic, Hot-Fill, Cold-Fill/Carbonated, Retortable, and More), Beverage Type (Carbonated Drinks, Alcoholic Beverages, Bottled Water, Milk, and More), and Geography. The Market Forecasts are Provided in Terms of Value (USD).
Geography Analysis
North America captured 27% of 2024 revenue due to to high per-capita beverage intake and premiumization headroom. Crown Holdings registered 5% North American volume growth in 2024, boosted by new Virginia and Nevada can lines. Yet state-level legislation on tethered caps and expanded-producer-responsibility fees creates compliance complexity that favors diversified multinationals. Canada's harmonized rPET targets to 2030 incent regional reclamation infrastructure, further bolstering circular-ready suppliers within the beverage packaging market. Competitive pressures arise from Asia-Pacific imports of lightweight bottles, challenging domestic converters on cost.
Asia-Pacific is forecast to post a 5.61% CAGR through 2030, underpinned by urbanization and rising disposable incomes. China recorded 2.7% output growth in beverages across the first ten months of 2023 while beer production jumped 22%. India's rPET mandate at 30% from April 2025 introduces both demand for recycled feedstock and punitive taxes for non-compliance. Multinationals with in-house recycling (e.g., Coca-Cola's PETValue facility in the Philippines) gain a foothold, whereas small converters face input scarcity. Japanese processors focus on "ready-to-eat" and healthy beverages, encouraging aseptic pouch uptake for portable nutrition.
Europe commands stringent regulatory leadership with the PPWR effective February 2025 mandating all packaging be recyclable by 2028 and 30% rPET in PET bottles by 2030. The beverage packaging market in the bloc therefore pivots toward design-for-recycling protocols such as monomaterial sleeves and water-based inks. Supply-demand imbalances in food-grade rPET keep premiums elevated, encouraging partnerships between fillers and recyclers. Glass capacity rationalization amid ESG constraints tightens supply for regional wine and premium spirits, supporting value retention. Flexible paper-based solutions gain traction as retailers commit to plastic reduction roadmaps across member states.
- Amcor plc
- Ball Corporation
- Tetra Laval International SA
- O-I Glass Inc.
- Crown Holdings Inc.
- Ardagh Group S.A.
- Ardagh Metal Packaging S.A.
- Verallia S.A.
- Vidrala S.A.
- Vetropack Holding Ltd.
- Silgan Holdings Inc.
- Berry Global Group Inc.
- Mondi plc
- Sonoco Products Company
- CCL Industries Inc.
- Smurfit Kappa Group plc
- CANPACK S.A.
- Huhtamaki Oyj
- Toyo Seikan Group Holdings Ltd.
- Nampak Ltd.
- Krones AG
- Guala Closures Group
Additional Benefits:
- The market estimate (ME) sheet in Excel format
- 3 months of analyst support
TABLE OF CONTENTS
1 INTRODUCTION
- 1.1 Study Assumptions and Market Definition
- 1.2 Scope of the Study
2 RESEARCH METHODOLOGY
3 EXECUTIVE SUMMARY
4 MARKET LANDSCAPE
- 4.1 Market Overview
- 4.2 Market Drivers
- 4.2.1 Premiumisation in ready-to-drink (RTD) beverages
- 4.2.2 Surge in aluminium-can capacity expansions
- 4.2.3 PET lightweighting and tethered-cap regulations
- 4.2.4 Growth of e-commerce multipacks (mainly alcohol)
- 4.2.5 Rise of digital watermarks for circularity (under-radar)
- 4.2.6 Beverage concentrates and "soda-at-home" ecosystems (under-radar)
- 4.3 Market Restraints
- 4.3.1 Volatile virgin-resin prices
- 4.3.2 Supply bottlenecks for recycled PET flakes
- 4.3.3 Anti-single-use plastics policy acceleration (under-radar)
- 4.3.4 Investor ESG scrutiny curbing cap-ex in glass (under-radar)
- 4.4 Value Chain Analysis
- 4.5 Regulatory Landscape
- 4.6 Technological Outlook
- 4.7 Porter's Five Forces Analysis
- 4.7.1 Bargaining Power of Suppliers
- 4.7.2 Bargaining Power of Buyers/Consumers
- 4.7.3 Threat of New Entrants
- 4.7.4 Threat of Substitutes
- 4.7.5 Intensity of Competitive Rivalry
- 4.8 Assessment of Macro Economic Trends on the Market
5 MARKET SIZE AND GROWTH FORECASTS (VALUES)
- 5.1 By Material Type
- 5.1.1 Plastic
- 5.1.2 Metal
- 5.1.3 Glass
- 5.1.4 Paperboard
- 5.2 By Product Type
- 5.2.1 Bottles
- 5.2.2 Cans
- 5.2.3 Pouches
- 5.2.4 Cartons
- 5.2.5 Beer Kegs
- 5.3 By Packaging Format
- 5.3.1 Aseptic
- 5.3.2 Hot-Fill
- 5.3.3 Cold-Fill/Carbonated
- 5.3.4 Retortable
- 5.3.5 Shelf-Stable Ambient
- 5.3.6 Chilled Distribution
- 5.4 By Beverage Type
- 5.4.1 Carbonated Drinks
- 5.4.2 Alcoholic Beverages
- 5.4.3 Bottled Water
- 5.4.4 Milk
- 5.4.5 Fruit and Vegetable Juices
- 5.4.6 Energy Drinks
- 5.4.7 Plant-based Drinks
- 5.4.8 Other Beverage Types
- 5.5 By Geography
- 5.5.1 North America
- 5.5.1.1 United States
- 5.5.1.2 Canada
- 5.5.1.3 Mexico
- 5.5.2 Europe
- 5.5.2.1 United Kingdom
- 5.5.2.2 Germany
- 5.5.2.3 France
- 5.5.2.4 Italy
- 5.5.2.5 Spain
- 5.5.2.6 Austria
- 5.5.2.7 Poland
- 5.5.2.8 Russia
- 5.5.2.9 Rest of Europe
- 5.5.3 Asia-Pacific
- 5.5.3.1 China
- 5.5.3.2 India
- 5.5.3.3 Japan
- 5.5.3.4 Australia
- 5.5.3.5 Rest of Asia-Pacific
- 5.5.4 South America
- 5.5.4.1 Brazil
- 5.5.4.2 Argentina
- 5.5.4.3 Rest of South America
- 5.5.5 Middle East
- 5.5.5.1 Saudi Arabia
- 5.5.5.2 United Arab Emirates
- 5.5.5.3 Turkey
- 5.5.5.4 Rest of Middle East
- 5.5.6 Africa
- 5.5.6.1 South Africa
- 5.5.6.2 Rest of Africa
- 5.5.1 North America
6 COMPETITIVE LANDSCAPE
- 6.1 Market Concentration
- 6.2 Strategic Moves
- 6.3 Market Share Analysis
- 6.4 Company Profiles (includes Global level Overview, Market level overview, Core Segments, Financials as available, Strategic Information, Market Rank/Share for key companies, Products and Services, and Recent Developments)
- 6.4.1 Amcor plc
- 6.4.2 Ball Corporation
- 6.4.3 Tetra Laval International SA
- 6.4.4 O-I Glass Inc.
- 6.4.5 Crown Holdings Inc.
- 6.4.6 Ardagh Group S.A.
- 6.4.7 Ardagh Metal Packaging S.A.
- 6.4.8 Verallia S.A.
- 6.4.9 Vidrala S.A.
- 6.4.10 Vetropack Holding Ltd.
- 6.4.11 Silgan Holdings Inc.
- 6.4.12 Berry Global Group Inc.
- 6.4.13 Mondi plc
- 6.4.14 Sonoco Products Company
- 6.4.15 CCL Industries Inc.
- 6.4.16 Smurfit Kappa Group plc
- 6.4.17 CANPACK S.A.
- 6.4.18 Huhtamaki Oyj
- 6.4.19 Toyo Seikan Group Holdings Ltd.
- 6.4.20 Nampak Ltd.
- 6.4.21 Krones AG
- 6.4.22 Guala Closures Group
7 MARKET OPPORTUNITIES AND FUTURE OUTLOOK
- 7.1 White-space and Unmet-Need Assessment
 饮料包装市场:2026-2032年全球市场预测(依饮料类型、材料类型、包装形式、营运模式及通路划分)
 2026年全球饮料包装市场报告
 饮料包装市场商机、成长要素、产业趋势分析及2026-2035年预测。
 日本包装饮料市场规模、份额、趋势和预测:按类型、包装类型、通路和地区划分,2026-2034年热灌装包装全球市场报告(2026年)日本饮料包装市场报告:按材料、产品、应用和地区划分(2026-2034年)
 饮料包装创新市场预测至2032年:按材料、包装类型、创新类型、饮料类别、技术、最终用户和地区分類的全球分析饮料容器回收市场机会、成长驱动因素、产业趋势分析及预测(2025-2034年)2032 年塑胶中性水市场预测:按产品类型、包装类型、塑胶中性机制、价格分布范围、分销管道、最终用户和地区进行的全球分析
 美国饮料包装:市场份额分析、行业趋势、统计数据和成长预测(2025-2030 年)