


 |
市场调查报告书
商品编码
1910441
动态随机存取记忆体(DRAM):市场占有率分析、产业趋势与统计资料、成长预测(2026-2031)Dynamic Random Access Memory (DRAM) - Market Share Analysis, Industry Trends & Statistics, Growth Forecasts (2026 - 2031) |
||||||
※ 本网页内容可能与最新版本有所差异。详细情况请与我们联繫。
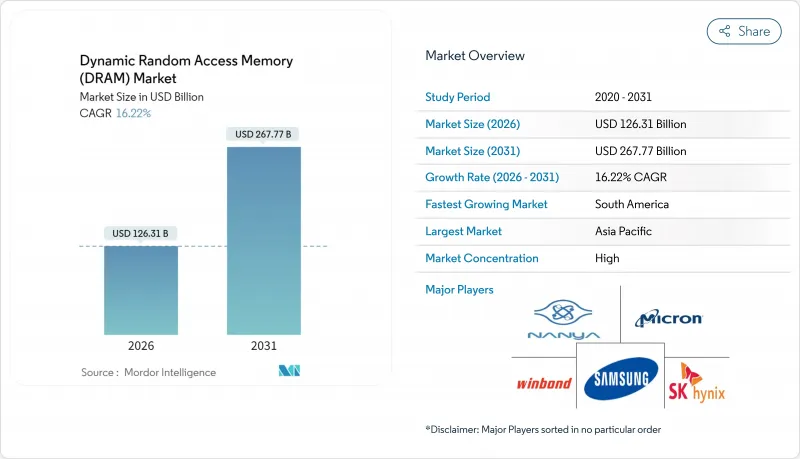
2025 年动态随机存取记忆体 (DRAM) 市值为 1,086.8 亿美元,预计到 2031 年将达到 2,677.7 亿美元,高于 2026 年的 1,263.1 亿美元。
预测期(2026-2031 年)的复合年增长率预计为 16.22%。
人工智慧伺服器的加速普及、高频宽记忆体的快速成长以及日益严格的汽车认证要求,正促使采购标准从单纯追求容量转向兼顾频宽、电力消耗和散热性能。超大规模云端营运商已于2024年开始用DDR5和HBM3E模组升级机架,亚洲行动电话OEM厂商也已将其大部分旗舰和中阶机型迁移至LPDDR5X,并在2025年中期之前保持了95%以上的晶圆厂整体运转率。分区架构正在取代传统的ECU网络,迅速提升每辆电动车(EV)的记忆体容量,推动汽车DRAM需求达到数GB等级。同时,盈利的HBM3E和传统DDR4产品线之间的供应竞争,正推高价格,并重塑PC、智慧型手机和工业IoT闆卡的成本绩效格局。
全球DRAM市场趋势与洞察
超大规模资料中心中人工智慧和生成式人工智慧工作负载的成长趋势
NVIDIA 的 2025 年 Blackwell GP-AI 平台树立了超越传统 DDR 架构的频宽新标桿,推动伺服器平均记忆体容量从 2024 年的 256GB 成长到 2025 年年中的数Terabyte等级。由于每个 HBM3E 堆迭都能提供超过 1TB/s 的效能,云端服务供应商重新设计了机架,采用了以记忆体为中心的拓扑结构。三星量产就绪的 CXL 2.0 DRAM 使 Azure 等服务供应商能够跨主机共享内存,从而提高利用率并推迟对额外计算节点的资本支出。供应商随即调整晶圆生产,从 DDR4 转向 HBM,导致传统等级的供应短缺,同时加速了高端市场的利润成长。
亚太地区5G旗舰和中阶智慧型手机中LPDDR晶片的应用迅速扩展
美光的1年期LPDDR5X样品(运行速度为9200 MT/s)于2025年第一季开始向行动电话製造商交付,功耗降低20%,并将中国和印度机型的标准配置记忆体从8GB提升至12GB。小米、OPPO和传音等新兴品牌正在签署远期合约,占用亚太地区越来越多的晶圆厂产能,迫使供应商调整行动和资料中心生产线之间的产能分配。这种转变使得LPDDR的成长速度超过了自2015年LPDDR4量产以来任何其他行动记忆体。
週期性的供需关係导致平均售价(ASP)出现剧烈波动。
由于市场对高利润率的HBM内存的需求不断增长,晶圆厂将DDR4内存的投产时间推迟至2025年初,导致主流内存模组现货价格在5月份飙升了50%。 DDR5记忆体合约价格也上涨了15%至20%,促使OEM厂商透过重新设计产品物料清单或超额订购来对冲价格进一步上涨的风险。这种反馈循环加剧了市场波动,恶化了生产计画的前景,并使DRAM市场的预期复合年增长率下降了2个百分点以上。
细分市场分析
到2025年,DDR5在DRAM市场中所占份额虽小,但成长速度最快,预计复合年增长率将达到29.1%,这主要得益于JEDEC的JESD79-5C标准更新,该标准将性能上限提升至8,800 Mbps。这项技术飞跃使得一级云端供应商能够采用DDR5和HBM3E混合配置,从而使每个插槽的有效频宽翻倍。美光的1Y DDR5在2025年2月实现了9,200 MT/s的效能,这一突破促使伺服器OEM厂商加快了平台更新换代。同时,DDR4在2025年之前保持了44.78%的DRAM市场份额,因为企业IT预算继续优先考虑成本优化配置。随着工业和汽车设计向新标准过渡,传统的DDR3和DDR2市场份额持续下滑。
供应商面临艰难的权衡。每将一片晶圆重新分配给DDR5,就意味着用于PC的DDR4晶片供应减少,导致中国笔记型电脑组装的成本飙升。长期持有DDR4库存的拥有者利用套利机会,自2017年起以溢价出售库存。 JEDEC推出的新型CAMM2外形规格消除了SO-DIMM的高度限制,使笔记型电脑和边缘伺服器能够采用更高密度的单层封装。这些封装技术的进步推动了动态随机存取记忆体(DRAM)市场向更高频宽标准的转变,无论是消费性装置还是企业级装置。
预计到2025年,19nm至10nm製程范围将占DRAM市场规模的41.85%,到2031年将成长24.4%,因为供应商在不增加10nm以下製程产量比率风险的前提下,提高了每片晶圆的晶粒数量。采用EUV技术的1Y製程已于2025年第一季开始量产并实现获利,但其产量比率比成熟的1z製程至少低8个百分点。因此,许多装置製造商续签了1z和1y等级的合约以降低成本风险,从而提高了中节点製程的产量。
SK海力士公布了垂直闸极DRAM蓝图,计划从2027年起实现晶圆级堆迭,这标誌着晶片製造製程将从横向微缩长期转向三维结构。平面微缩技术的反覆尝试,在计入光罩模组、材料成本和折旧免税额后,成本降低幅度不足12%,迫使晶圆厂不仅要探索几何尺寸的缩小,还要进行结构重新设计。行动和消费性电子产品对成本的高度敏感性,导致了分级生产模式的出现,价格敏感型产品仍保留20nm以上的製程节点。这种模式实现了晶圆厂生产的多元化,并增强了整体营收的稳定性。
动态随机存取记忆体 (DRAM) 市场按架构(DDR2 及更早版本、DDR3、DDR4、DDR5、LPDDR、GDDR)、技术节点(20nm 及以上、19nm-10nm、10nm 以下)、容量(最高 4GB、4-8GB、8-16GB、16GB 以上)、容量(GB 及以上)和笔记型电脑、伺服器和超大规模资料中心、其他)以及地区(北美、欧洲、亚太地区、南美、中东和非洲)进行细分。
区域分析
预计到2025年,亚太地区将维持30.88%的营收份额,主要得益于韩国、台湾和中国当地晶圆厂的集中布局。韩国供应商承诺在2028年将产能扩大120兆韩元(约840亿美元),旨在维持主导。同时,台湾代工组装透过利用逻辑节点前端技术并引入硅穿孔(TSV)技术来降低热阻,从而扩展了其先进封装生产线,以满足不断增长的HBM4需求。
北美是最大的消费市场,这主要得益于超大规模营运商加速机架更新以及美国汽车製造商整合区域控制器。美光科技获得了《晶片法案》(CHIPS Act)提供的61亿美元资金筹措,用于建造一座新的巨型晶圆厂,此举旨在降低地缘政治风险并缩短国内客户的前置作业时间。欧洲继续专注于汽车和工业应用领域的技术,德国原始设备製造商(OEM)要求产品具备更宽的温度范围和更长的使用寿命,这使得产品能够获得更高的价格。
预计南美洲将以21.6%的复合年增长率成长,这主要得益于巴西、阿根廷和墨西哥大力发展电子组装生态系统,以实现供应链在地化。政策奖励降低了国产组装记忆体组件的进口关税,促使筹资策略发生虽小但意义重大的转变。中东和非洲地区在波湾合作理事会资料中心建设以及尼日利亚和肯亚智慧型手机普及率上升的推动下,实现了中等个位数的成长,但政治不稳定仍然阻碍着智慧型手机的广泛应用。这些区域发展表明,儘管製造活动仍集中在东亚,但充满活力的随机存取记忆体(DRAM)市场正在实现收入来源多元化。
其他福利:
- Excel格式的市场预测(ME)表
- 3个月的分析师支持
目录
第一章 引言
- 研究假设和市场定义
- 调查范围
第二章调查方法
第三章执行摘要
第四章 市场情势
- 市场概览
- 市场驱动因素
- 超大规模资料中心中人工智慧和生成式人工智慧工作负载的成长趋势
- 亚太地区5G旗舰和中阶智慧型手机LPDDR采用率激增
- 汽车区域/域控制器中从NOR到高温DRAM的过渡
- 边缘人工智慧和工业IoT闆卡需要扩展温度范围的DRAM模组
- 云端服务供应商的 CXL 连线记忆体池迁移
- 市场限制
- 週期性的供需关係导致平均售价(ASP)出现剧烈波动。
- 10nm以下EUV製程产量比率下降问题
- 对中国的地缘政治出口限制限制了高密度伺服器DRAM的出货量。
- 价值链分析
- 技术展望
- 监理展望
- 波特五力分析
- 供应商的议价能力
- 买方的议价能力
- 新进入者的威胁
- 替代品的威胁
- 竞争对手之间的竞争
- 定价分析
- DRAM现货价格(每GB)
- 价格趋势分析
- 宏观经济影响分析
第五章 市场规模与成长预测
- 建筑设计
- DDR2 及更早世代
- DDR3
- DDR4
- DDR5
- LPDDR
- GDDR
- 依技术节点
- 20奈米或以上
- 19nm-10nm
- 小于 10 奈米(极紫外光)
- 按产能
- 4 GB 或更少
- 4-8 GB
- 8-16 GB
- 16GB 或更多
- 最终用途
- 智慧型手机和平板电脑
- 个人电脑和笔记型电脑
- 伺服器和超大规模资料中心
- 图形和游戏主机
- 汽车电子
- 家用电子电器(机上盒、智慧电视、VR/AR)
- 工业和物联网设备
- 其他的
- 按地区
- 北美洲
- 美国
- 加拿大
- 墨西哥
- 欧洲
- 德国
- 法国
- 英国
- 北欧国家
- 其他欧洲地区
- 亚太地区
- 中国
- 台湾
- 韩国
- 日本
- 印度
- 亚太其他地区
- 南美洲
- 巴西
- 智利
- 阿根廷
- 其他南美洲
- 中东和非洲
- 中东
- 沙乌地阿拉伯
- 阿拉伯聯合大公国
- 土耳其
- 其他中东地区
- 非洲
- 南非
- 其他非洲地区
- 中东
- 北美洲
第六章 竞争情势
- 市场集中度
- 策略趋势
- 市占率分析
- 公司简介
- Samsung Electronics Co., Ltd.
- SK Hynix Inc.
- Micron Technology Inc.
- ChangXin Memory Technologies Inc.(CXMT)
- Nanya Technology Corporation
- Winbond Electronics Corporation
- Powerchip Semiconductor Manufacturing Corp.(PSMC)
- Fujian Jinhua Integrated Circuit Co., Ltd.(JHICC)
- GigaDevice Semiconductor(Beijing)Inc.
- Etron Technology Inc.
- Integrated Silicon Solution Inc.(ISSI)
- Elite Semiconductor Memory Technology Inc.(ESMT)
- Zentel Electronics Corporation
- Alliance Memory, Inc.
- AP Memory Technology Corp.
- Phison Electronics Corporation
- JSC Mikron(Mikron Group)
- AMIC Technology Corporation
- Utron Technology Inc.
- Hua Hong Semiconductor Limited
第七章 市场机会与未来展望
The Dynamic Random Access Memory market was valued at USD 108.68 billion in 2025 and estimated to grow from USD 126.31 billion in 2026 to reach USD 267.77 billion by 2031, at a CAGR of 16.22% during the forecast period (2026-2031).
Accelerated adoption of AI-centric servers, the steep ramp-up of high-bandwidth memory, and tighter automotive qualification requirements have shifted purchasing criteria from capacity alone to a balanced focus on bandwidth, power, and thermal performance. Hyperscale cloud operators began refreshing racks with DDR5 and HBM3E modules during 2024, while handset OEMs in Asia moved much of their flagship and mid-tier portfolios to LPDDR5X, collectively keeping fab utilization above 95% through mid-2025. Memory content per electric vehicle rose quickly as zonal architectures replaced traditional ECU networks, pushing automotive DRAM demand into multi-gigabyte territory. At the same time, supply allocation conflicts between lucrative HBM3E and legacy DDR4 lines triggered price surges that reshaped cost-performance trade-offs for PCs, smartphones, and industrial IoT boards.
Global Dynamic Random Access Memory (DRAM) Market Trends and Insights
Ascending content footprint of AI and generative-AI workloads in hyperscale data centers
NVIDIA's 2025 Blackwell GP-AI platforms established bandwidth baselines that eclipsed conventional DDR architectures, lifting average server memory from 256 GB in 2024 to multi-terabyte deployments by mid-2025. With each HBM3E stack delivering more than 1 TB/s, cloud operators re-architected racks around memory-centric topologies. Samsung delivered production-ready CXL 2.0 DRAM that allowed Azure and other providers to pool memory across hosts, improving utilization while deferring capex on additional compute nodes. Suppliers consequently shifted wafer starts from DDR4 to HBM, triggering tightness in legacy grades but accelerating profit growth in the premium segment.
Soaring LPDDR adoption in 5G flagship and mid-tier smartphones across APAC
Micron's 1Y LPDDR5X samples running at 9,200 MT/s reached handset makers in Q1 2025, cutting power by 20% and raising baseline configurations in Chinese and Indian models from 8 GB to 12 GB RAM. Xiaomi, OPPO, and emerging brands such as Transsion are locked in forward contracts that consume a growing slice of APAC fab capacity, forcing suppliers to juggle commitments between mobile and datacenter lines. The shift gave LPDDR a steeper growth curve than any other mobile memory since LPDDR4 entered mass production in 2015.
Supply-demand cyclicality driving extreme ASP volatility
High-margin HBM pull-ins persuaded fabs to postpone DDR4 runs early in 2025, igniting a 50% spot-price jump for mainstream modules in May. DDR5 contracts also climbed 15-20%, prompting OEMs to re-engineer product bills of materials or over-order to hedge against further spikes. The feedback loop amplified volatility and cut visibility for production planning, knocking two-plus points from the Dynamic Random Access Memory market's forecast CAGR.
Other drivers and restraints analyzed in the detailed report include:
- Automotive zonal and domain controllers migrating from NOR to high-temperature DRAM
- Edge-AI and industrial IoT boards requiring extended-temperature DRAM modules
- Yield-erosion challenges below 10 nm EUV nodes
For complete list of drivers and restraints, kindly check the Table Of Contents.
Segment Analysis
DDR5 accounted for a minimal share of the Dynamic Random Access Memory market in 2025, yet carried the fastest 29.1% forecast CAGR, underpinned by JEDEC's JESD79-5C update that lifted performance ceilings to 8,800 Mbps. That technical leap allowed tier-1 cloud builders to run mixed DDR5-HBM3E configurations that doubled per-socket effective bandwidth. Micron's 1Y DDR5 reached 9,200 MT/s in February 2025, a milestone that pushed server OEMs to pull forward platform refreshes. Meanwhile, DDR4 retained a 44.78% Dynamic Random Access Memory market share through 2025 because corporate IT budgets still favoured cost-optimized configurations. Legacy DDR3 and DDR2 footprints continued to shrink as industrial and automotive design-ins migrated to newer standards.
Suppliers confronted a balancing act: every wafer reassigned to DDR5 meant fewer DDR4 chips for PCs, driving cost spikes that flowed downstream to notebook assemblers in China. Holders of long-tail inventory exploited arbitrage trading, unloading stockpiled DDR4 at premiums unseen since 2017. JEDEC's new CAMM2 form factor removed the height constraints of SO-DIMMs, letting laptops and edge servers adopt denser single-sided stacks. Those packaging gains fed into the Dynamic Random Access Memory market's momentum toward higher-bandwidth norms across consumer and enterprise devices.
The 19 nm-10 nm bracket held 41.85% of the Dynamic Random Access Memory market size in 2025 and is projected to grow 24.4% through 2031 as suppliers squeeze additional dies per wafer without plunging into the yield-risk chasm of sub-10 nm. EUV-enabled 1Y production began shipping revenue units in Q1 2025, but line yields remained at least eight points below mature 1z lines. Consequently, many device makers renewed agreements for 1z and 1y grades to buffer cost risk, giving mid-node processes a volume boost.
SK Hynix laid out a vertical-gate DRAM roadmap that promises wafer-level stacking beyond 2027, signalling the long-term pivot from lateral scaling to 3D architectures. Each successive planar shrink delivers less than 12% cost reduction after mask set, materials, and depreciation are factored in, nudging fabs to look for structural redesigns rather than geometrical shrink alone. Cost sensitivity in mobile and consumer electronics kept >=20 nm nodes alive for price-focused SKUs, ensuring a stratified production mix that diversified fab output and underpinned overall revenue resiliency.
Dynamic Random Access Memory Market is Segmented by Architecture (DDR2 and Earlier, DDR3, DDR4, DDR5, LPDDR, and GDDR), Technology Node (>=20 Nm, 19 Nm-10 Nm, and <10 Nm), Capacity (<=4 GB, 4-8 GB, 8-16 GB, and >=16 GB), End-Use Application (Smartphones and Tablets, Pcs and Laptops, Servers and Hyperscale Data Centers, and More), and Geography (North America, Europe, Asia-Pacific, South America, and Middle East and Africa).
Geography Analysis
Asia-Pacific retained a 30.88% revenue position in 2025 on the strength of fabs clustered across South Korea, Taiwan, and mainland China. South Korean suppliers pledged KRW 120 trillion (USD 84 billion) for capacity build-outs through 2028, a figure intended to safeguard leadership in both HBM and traditional DRAM production. Taiwan's contract assembly houses, meanwhile, expanded advanced packaging lines to service rising HBM4 demand, leveraging front-end know-how from logic nodes to introduce Through-Silicon-Via innovations that reduce thermal resistance.
North America formed the largest consumption market as hyperscale builders accelerated rack refreshes and automakers in the United States integrated zonal controllers. Micron secured USD 6.1 billion CHIPS Act funding to construct a new megafab, a move aimed at de-risking geopolitical exposure and shortening lead times for domestic clients. Europe maintained a technology focus on automotive and industrial applications, with German OEMs insisting on extended temperature and longevity guarantees that fetched premium pricing.
South America is forecast to grow at a 21.6% CAGR as Brazil, Argentina, and Mexico nurture electronics assembly ecosystems to localize supply. Policy incentives cut import tariffs on memory components assembled domestically, creating modest but meaningful shifts in sourcing strategies. The Middle East and Africa displayed mid-single-digit growth anchored by data-center build-outs in Gulf Cooperation Council states and rising smartphone penetration in Nigeria and Kenya, yet political instability continued to temper wider adoption. Combined, these regional narratives underscore how the Dynamic Random Access Memory market diversifies revenue streams even as manufacturing remains concentrated in East Asia.
- Samsung Electronics Co., Ltd.
- SK Hynix Inc.
- Micron Technology Inc.
- ChangXin Memory Technologies Inc. (CXMT)
- Nanya Technology Corporation
- Winbond Electronics Corporation
- Powerchip Semiconductor Manufacturing Corp. (PSMC)
- Fujian Jinhua Integrated Circuit Co., Ltd. (JHICC)
- GigaDevice Semiconductor (Beijing) Inc.
- Etron Technology Inc.
- Integrated Silicon Solution Inc. (ISSI)
- Elite Semiconductor Memory Technology Inc. (ESMT)
- Zentel Electronics Corporation
- Alliance Memory, Inc.
- AP Memory Technology Corp.
- Phison Electronics Corporation
- JSC Mikron (Mikron Group)
- AMIC Technology Corporation
- Utron Technology Inc.
- Hua Hong Semiconductor Limited
Additional Benefits:
- The market estimate (ME) sheet in Excel format
- 3 months of analyst support
TABLE OF CONTENTS
1 INTRODUCTION
- 1.1 Study Assumptions and Market Definition
- 1.2 Scope of the Study
2 RESEARCH METHODOLOGY
3 EXECUTIVE SUMMARY
4 MARKET LANDSCAPE
- 4.1 Market Overview
- 4.2 Market Drivers
- 4.2.1 Ascending Content Footprint of AI and Generative-AI Workloads in Hyperscale Data Centers
- 4.2.2 Soaring LPDDR Adoption in 5G Flagship and Mid-Tier Smartphones Across APAC
- 4.2.3 Automotive Zonal/Domain Controllers Migrating from NOR to High-Temperature DRAM
- 4.2.4 Edge-AI and Industrial IoT Boards Requiring Extended-Temperature DRAM Modules
- 4.2.5 Cloud Service Providers' Transition to CXL-attached Memory Pools
- 4.3 Market Restraints
- 4.3.1 Supply-Demand Cyclicality Driving Extreme ASP Volatility
- 4.3.2 Yield-Erosion Challenges Below 10 nm EUV Nodes
- 4.3.3 Geopolitical Export Controls on China Limiting High-density Server DRAM Shipments
- 4.4 Value Chain Analysis
- 4.5 Technological Outlook
- 4.6 Regulatory Outlook
- 4.7 Porter's Five Forces Analysis
- 4.7.1 Bargaining Power of Suppliers
- 4.7.2 Bargaining Power of Buyers
- 4.7.3 Threat of New Entrants
- 4.7.4 Threat of Substitute Products
- 4.7.5 Intensity of Competitive Rivalry
- 4.8 Pricing Analysis
- 4.8.1 DRAM Spot Price (Per GB)
- 4.8.2 Pricing Trends Analysis
- 4.9 Macroeconomic Impact Analysis
5 MARKET SIZE AND GROWTH FORECASTS (VALUE)
- 5.1 By Architecture
- 5.1.1 DDR2 and Earlier
- 5.1.2 DDR3
- 5.1.3 DDR4
- 5.1.4 DDR5
- 5.1.5 LPDDR
- 5.1.6 GDDR
- 5.2 By Technology Node
- 5.2.1 >=20 nm
- 5.2.2 19 nm - 10 nm
- 5.2.3 <10 nm (EUV)
- 5.3 By Capacity
- 5.3.1 <=4 GB
- 5.3.2 4 - 8 GB
- 5.3.3 8 - 16 GB
- 5.3.4 >=16 GB
- 5.4 By End-use Application
- 5.4.1 Smartphones and Tablets
- 5.4.2 PCs and Laptops
- 5.4.3 Servers and Hyperscale Data Centers
- 5.4.4 Graphics and Gaming Consoles
- 5.4.5 Automotive Electronics
- 5.4.6 Consumer Electronics (Set-top Boxes, Smart TV, VR/AR)
- 5.4.7 Industrial and IoT Devices
- 5.4.8 Others
- 5.5 By Geography
- 5.5.1 North America
- 5.5.1.1 United States
- 5.5.1.2 Canada
- 5.5.1.3 Mexico
- 5.5.2 Europe
- 5.5.2.1 Germany
- 5.5.2.2 France
- 5.5.2.3 United Kingdom
- 5.5.2.4 Nordics
- 5.5.2.5 Rest of Europe
- 5.5.3 Asia-Pacific
- 5.5.3.1 China
- 5.5.3.2 Taiwan
- 5.5.3.3 South Korea
- 5.5.3.4 Japan
- 5.5.3.5 India
- 5.5.3.6 Rest of Asia-Pacific
- 5.5.4 South America
- 5.5.4.1 Brazil
- 5.5.4.2 Chile
- 5.5.4.3 Argentina
- 5.5.4.4 Rest of South America
- 5.5.5 Middle East and Africa
- 5.5.5.1 Middle East
- 5.5.5.1.1 Saudi Arabia
- 5.5.5.1.2 United Arab Emirates
- 5.5.5.1.3 Turkey
- 5.5.5.1.4 Rest of Middle East
- 5.5.5.2 Africa
- 5.5.5.2.1 South Africa
- 5.5.5.2.2 Rest of Africa
- 5.5.5.1 Middle East
- 5.5.1 North America
6 COMPETITIVE LANDSCAPE
- 6.1 Market Concentration
- 6.2 Strategic Moves
- 6.3 Market Share Analysis
- 6.4 Company Profiles (includes Global-level Overview, Market-level Overview, Core Segments, Financials as available, Strategic Information, Market Rank/Share for key companies, Products and Services, and Recent Developments)
- 6.4.1 Samsung Electronics Co., Ltd.
- 6.4.2 SK Hynix Inc.
- 6.4.3 Micron Technology Inc.
- 6.4.4 ChangXin Memory Technologies Inc. (CXMT)
- 6.4.5 Nanya Technology Corporation
- 6.4.6 Winbond Electronics Corporation
- 6.4.7 Powerchip Semiconductor Manufacturing Corp. (PSMC)
- 6.4.8 Fujian Jinhua Integrated Circuit Co., Ltd. (JHICC)
- 6.4.9 GigaDevice Semiconductor (Beijing) Inc.
- 6.4.10 Etron Technology Inc.
- 6.4.11 Integrated Silicon Solution Inc. (ISSI)
- 6.4.12 Elite Semiconductor Memory Technology Inc. (ESMT)
- 6.4.13 Zentel Electronics Corporation
- 6.4.14 Alliance Memory, Inc.
- 6.4.15 AP Memory Technology Corp.
- 6.4.16 Phison Electronics Corporation
- 6.4.17 JSC Mikron (Mikron Group)
- 6.4.18 AMIC Technology Corporation
- 6.4.19 Utron Technology Inc.
- 6.4.20 Hua Hong Semiconductor Limited
7 MARKET OPPORTUNITIES AND FUTURE OUTLOOK
- 7.1 White-space and Unmet-need Assessment
 全球动态随机存取记忆体(DRAM)市场:按产品类型、密度、最终用途产业、应用、国家和地区划分-产业分析、市场规模、份额和预测(2025-2032)
 按路径、记忆体容量、电压和应用分類的加固型DRAM市场,全球预测(2026-2032年)
 动态随机存取记忆体 (DRAM) 市场分析及至 2035 年预测:按类型、产品类型、技术、应用、最终用户、外形、装置、功能和安装类型划分
 2026年全球DRAM模组及组件市场报告2026年全球电阻式随机存取记忆体(ReRAM)市场报告新型记忆体市场:以外形规格、技术、模组容量、速度等级、应用和最终用户产业划分-2026-2032年全球预测
 DRAM市场规模、份额和成长分析(按类型、应用、最终用户产业、外形规格和地区划分)-2026-2033年产业预测
 动态随机存取记忆体 (DRAM) 市场规模、份额和成长分析(按类型、应用、最终用户产业和地区划分)—产业预测,2026-2033 年
 随机存取记忆体市场按类型、产品和地区划分
 伺服器DRAM需求激增,推动主要供应商提高产量