


 |
市场调查报告书
商品编码
1851588
锂离子电池:市场份额分析、行业趋势、统计数据和成长预测(2025-2030 年)Lithium-ion Battery - Market Share Analysis, Industry Trends & Statistics, Growth Forecasts (2025 - 2030) |
||||||
※ 本网页内容可能与最新版本有所差异。详细情况请与我们联繫。
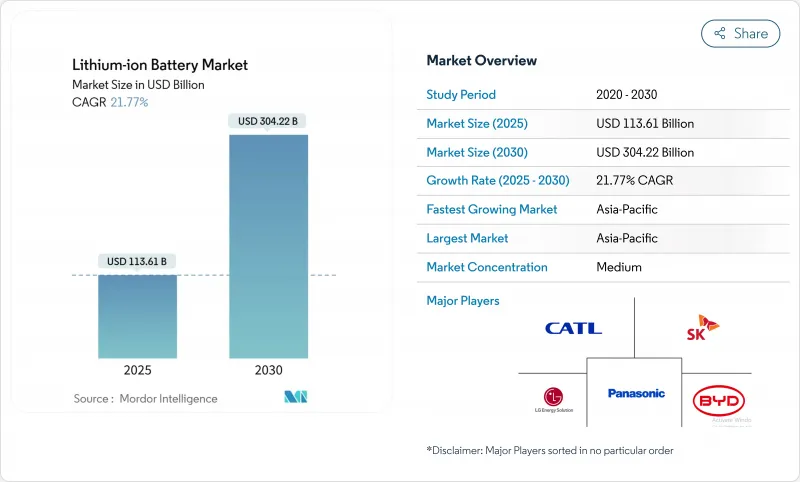
预计到 2025 年,锂离子电池市场规模将达到 1,136.1 亿美元,到 2030 年将达到 3,042.2 亿美元,在预测期(2025-2030 年)内复合年增长率为 21.77%。
到2024年,平均电池组价格将降至115美元/千瓦时,这将是自2017年以来最大的年度降幅。亚太地区55%的市占率反映了中国在电池生产和负极材料领域的领先地位,而北美和欧洲正在加速本地化以规避供应风险。产品创新主要集中在提高能量密度上,富硅负极正逐步走向商业性实用化。电力公司正在采用多小时储能係统来稳定可再生能源发电,而汽车製造商正在将入门级电动车转向成本优化的磷酸铁锂电池。这些因素共同作用,强化了销售成长和成本下降的良性循环,将支撑长期需求。
全球锂离子电池市场趋势及洞察
远距电动车平台对高能量密度电池的需求快速成长
製造商的目标是研发能量密度超过300Wh kg⁻¹的电芯,并承诺在不增加电池组尺寸的情况下实现400英里的续航里程。硅基负极的比能量比石墨负极高40%。这一趋势与电芯到电池组的一体化架构的采用相吻合,该架构可降低结构重量和製造成本。预计到2029年,这种新型电池的价格将与现有电池持平,比先前预期提前了三年。汽车製造商认为,这些进步对于电动车在北美和欧洲市场的普及至关重要,因为里程焦虑是这两个市场的主要障碍。因此,采购合约越来越明确规定能量密度目标,从而在锂离子电池市场开闢了一个新的高端细分市场。
中国的产业政策(「中国製造2025」)将加速国内锂离子超级工厂的兴建。
到2024年,中国将占据全球电池储能产能的93.5%,反映了其在电芯製造和上游材料方面无可比拟的规模优势。从原料提炼到组件组装的垂直整合,使得中国电池的生产成本比欧洲同行低约20%,即便原料投入相近。业界领导企业宁德时代(CATL)正利用这一成本优势,在印尼和匈牙利扩张,以确保镍的供应,并在匈牙利建设数吉瓦时的工厂,为欧洲原始设备製造商(OEM)供货。政策主导的快速成长正在巩固中国在电池供应领域的主导地位,迫使其他地区为本地计划提供补贴以维持战略自主。这种结构性优势奠定了中国企业在锂离子电池市场的关键地位。
中国的环境法规收紧了石墨负极的供应
中国供应全球约90%的负极材料。黑龙江和内蒙古的环境检查导致2024年产量暂时减少15%。美国和欧洲的下游电池工厂报告交货前置作业时间延长,现货价格上涨,暴露出地域集中度风险。韩国和美国的合成石墨计划旨在实现供应多元化,但预计商业化生产将落后需求数年。短缺风险促使一些汽车製造商提前评估富硅负极材料,并重塑整个锂离子电池市场的材料蓝图。
细分市场分析
到2024年,NMC将占据锂离子电池市场45%的份额,这主要得益于其高能量密度,尤其适用于高阶电动车。预计到2030年,磷酸铁锂(LFP)锂离子电池市场规模将以23.4%的复合年增长率成长,随着对成本敏感的车款越来越受欢迎,NMC的领先优势将受到削弱。改进的阴极涂层和更严格的电池公差正在将LFP的能量密度提升到以往只有富镍电池才能达到的水平,从而降低电池组总成本并缓解钴价格波动的影响。
不同应用领域的需求轨迹各不相同。 NMC在高性能电动车和航太计划中占据了一席之地,这些专案需要最大续航里程;而LCO在主流消费性电子产品领域仍然具有重要地位。 LTO和LMFP则服务于对循环寿命和耐温性要求极高的特定应用场景。跨化学体系的杂合反应,例如在LFP中添加锰,凸显了供应商如何客製化电化学系统以满足锂离子电池产业特定的性能需求。
到2024年,圆柱形电芯将占据锂离子电池市场50%的份额,这主要得益于现有汽车製造商采用高度自动化的组装。然而,软包电芯凭藉其轻薄的外形和即使在有限空间内也能保持的高封装效率,预计到2030年将以22.5%的复合年增长率增长。对比测试表明,当应用于滑板底盘时,软包电芯在电池组层面的单位重量能量密度比圆柱形电芯高出6-8%。
棱柱形电池约占总出货量的40%,兼具良好的机械强度和体积效率,因此在中国的公车和卡车平台上广受欢迎。由此可见,外形规格的差异体现在各厂商的设计理念:特斯拉的4680圆柱形电池蓝图优先考虑规模和能量密度,而比亚迪的刀片式棱柱形电池则强调安全性和成本。这种并存的局面表明,在日益多元化的锂离子电池市场中,差异化策略能够蓬勃发展。
锂离子电池市场报告按产品类型(钴酸锂、磷酸锂铁、镍锰钴锂、其他)、外形规格(圆柱形、棱柱形、软包)、功率容量(0-3,000 mAh、3,001-10,000 mAh、其他)、欧洲亚克、南美电器、其他汽车、其他汽车、北美市场)。
区域分析
预计到2024年,亚太地区将占锂离子电池市场55%的份额,到2030年将以31%的复合年增长率成长。仅中国就占全球电池产量的约70%和负极材料的约90%,这得益于其规模经济和一体化的供应链。日本和韩国继续专注于高性能化学品,而印度则在生产连结奖励计画计划下加快建设国内超级工厂,目标是到2030年实现年产能104吉瓦时。
北美将受惠于抑制通膨的立法,预计到2030年,电池标示容量达到每年1,300吉瓦时,足以满足1,000万辆电动车的需求。新建厂集中在中西部-东南部走廊沿线,集中了电池级镍、氢氧化锂和回收设施。扩大正极前驱体材料的生产规模仍面临挑战,目前正在与亚洲合作伙伴开展合资项目,以转移製程技术。
在波兰115GWh的LG能源解决方案综合体和匈牙利新计画的引领下,欧洲的目标是到2030年占全球电池产量的30%。严格的碳排放法规正推动製造商转向再生能源和完善的回收系统。同时,在南美洲,阿根廷的Sal de Vida公司计划每年生产1.5万吨电池级碳酸盐。在中东和非洲,LG正利用关键的矿产合作关係来满足该地区对太阳能+储能的伙伴关係,例如其在乌干达的锂离子电池组工厂。
其他福利:
- Excel格式的市场预测(ME)表
- 3个月的分析师支持
目录
第一章 引言
- 研究假设和市场定义
- 调查范围
第二章调查方法
第三章执行摘要
第四章 市场情势
- 市场概览
- 市场驱动因素
- 远距电动车平台对高能量密度电池的需求快速成长
- 中国的产业政策(「中国製造2025」)正加速兴建国内锂离子超级工厂。
- 美国公用事业规模电池采购快速扩张
- 北欧国家从VRLA到锂离子固定式资料中心备份的过渡
- 国际海事组织温室气体减量目标推动欧洲船用锂离子电池的普及
- 印度对成本敏感的入门级电动车整车製造商转向磷酸铁锂电池
- 市场限制
- 中国的环境法规正在收紧石墨负极的供应。
- 乌克兰衝突后高压电解液添加剂成本上涨
- 美国和欧盟在关键矿产上的贸易壁垒破坏了跨大西洋供应链。
- 大洋洲缺乏回收基础设施,减缓了物质循环流动。
- 供应链分析
- 最新进展
- 监理展望
- 技术展望
- 价格趋势分析
- 波特五力模型
- 供应商的议价能力
- 买方的议价能力
- 新进入者的威胁
- 替代品的威胁
- 竞争对手之间的竞争
第五章 市场规模与成长预测
- 依产品类型
- 钴酸锂(LCO)
- 磷酸锂铁(LFP)
- 锂镍锰钴(NMC)
- 锂镍钴铝(NCA)
- 锰酸锂(LMO)
- 钛酸锂(LTO)
- 按外形规格
- 圆柱形
- 棱镜
- 小袋
- 按功率容量
- 0~3,000 mAh
- 3,001~10,000 mAh
- 10,001~60,000 mAh
- 60,000mAh 或以上
- 按最终用途行业划分
- 汽车(电动车、油电混合车、插电式油电混合车)
- 消费性电子产品
- 工业和电动工具
- 固定式储能
- 航太/国防
- 船
- 按地区
- 北美洲
- 美国
- 加拿大
- 墨西哥
- 欧洲
- 英国
- 德国
- 法国
- 西班牙
- 北欧国家
- 俄罗斯
- 其他欧洲地区
- 亚太地区
- 中国
- 印度
- 日本
- 韩国
- 马来西亚
- 泰国
- 印尼
- 越南
- 澳洲
- 亚太其他地区
- 南美洲
- 巴西
- 阿根廷
- 哥伦比亚
- 其他南美洲国家
- 中东和非洲
- 阿拉伯聯合大公国
- 沙乌地阿拉伯
- 南非
- 埃及
- 其他中东和非洲地区
- 北美洲
第六章 竞争情势
- 市场集中度
- 策略性倡议(併购、合作、购电协议)
- 市场占有率分析(主要企业的市场排名/份额)
- 公司简介
- Contemporary Amperex Technology Co., Ltd.(CATL)
- BYD Company Limited
- LG Energy Solution Ltd.
- Panasonic Holdings Corp.
- Samsung SDI Co., Ltd.
- SK On Co., Ltd.
- AESC(Envision AESC Group)
- CALB Co., Ltd.
- Gotion High-Tech Co., Ltd.
- EVE Energy Co., Ltd.
- Farasis Energy Inc.
- Sunwoda Electronic Co., Ltd.
- Murata Manufacturing Co., Ltd.
- VARTA AG
- Toshiba Corporation
- Saft Groupe SAS
- Northvolt AB
- Microvast Holdings, Inc.
- A123 Systems LLC
- Hitachi Energy Ltd.
- Lithium Werks BV
- Tesla Inc.(Battery Division)
第七章 市场机会与未来展望
The Lithium-ion Battery Market size is estimated at USD 113.61 billion in 2025, and is expected to reach USD 304.22 billion by 2030, at a CAGR of 21.77% during the forecast period (2025-2030).
Momentum comes from steep cost deflation-average pack prices fell to USD 115 per kWh in 2024, their sharpest annual drop since 2017-and from policy mandates that require large-scale electrification across transport and power systems. A 55% market share in Asia-Pacific reflects China's command of cell production and anode materials, while North America and Europe accelerate localisation to hedge supply risk. Product innovation pivots around energy density gains, with silicon-rich anodes moving toward commercial viability. Utilities are adopting multi-hour storage to stabilise renewable generation, and automakers shift entry-level EVs toward cost-oriented LFP chemistry. Together these factors reinforce a virtuous cycle of rising volumes and falling cost that underpins long-term demand.
Global Lithium-ion Battery Market Trends and Insights
Surging Demand for High-Energy-Density Batteries in Long-Range EV Platforms
Manufacturers are pushing beyond 300 Wh kg-1 toward cells that promise 400-mile driving range without enlarging packs. Silicon-dominant anodes raise specific energy by up to 40% relative to graphite. The move coincides with adoption of cell-to-pack architectures that reduce structural weight and lower production cost. Price parity with incumbent chemistries is now expected before 2029, three years sooner than earlier estimates. Automakers view these advances as critical to mainstream EV acceptance in North America and Europe, markets where range anxiety remains a primary hurdle. As a result, procurement contracts increasingly stipulate energy density targets, creating new premium niches in the lithium-ion battery market.
China's Industrial Policy ("Made in China 2025") Accelerating Domestic Li-ion Gigafactory Build-out
China shipped 93.5% of global energy-storage batteries in 2024, reflecting unrivalled scale in cell manufacturing and upstream materials. Vertical integration spans raw-material refining through module assembly, enabling production costs roughly 20% below European peers despite similar commodity inputs. Champion supplier CATL leverages this cost edge to expand in Indonesia, securing nickel supply, and in Hungary, where a multi-GWh plant will serve European OEMs. The policy-driven surge cements China's supplier dominance and forces rival regions to subsidise local projects to preserve strategic autonomy. This structural advantage sustains a pivotal role for Chinese firms in the lithium-ion battery market.
Graphite Anode Supply Tightness Owing to Chinese Environmental Curtailments
China supplies about 90% of global anode material. Temporary shutdowns in Heilongjiang and Inner Mongolia cut output 15% during 2024 environmental inspections. Downstream cell plants in the United States and Europe reported lead-time extensions and spot-price increases, exposing geographic concentration risk. Synthetic graphite projects in South Korea and the United States aim to diversify supply; however, commercial volumes will lag demand for several years. Shortage risk prompts some automakers to evaluate silicon-rich anodes faster than planned, reshaping material roadmaps across the lithium-ion battery market.
Other drivers and restraints analyzed in the detailed report include:
- Rapid Roll-out of Utility-Scale Battery Energy Storage Procurements in the United States
- Stationary Data-Centre Back-up Migration from VRLA to Lithium-ion in Nordic Countries
- High-Voltage Electrolyte Additive Cost Inflation Post-Ukraine Conflict
For complete list of drivers and restraints, kindly check the Table Of Contents.
Segment Analysis
NMC accounted for 45% of lithium-ion battery market share in 2024, supported by its high energy density that suits premium EVs. The lithium-ion battery market size for LFP is forecast to rise at 23.4% CAGR through 2030, eroding NMC's lead as cost-sensitive models proliferate. Improved cathode coatings and tighter cell tolerances lift LFP energy density into ranges once reserved for nickel-rich chemistries, lowering total pack cost and mitigating cobalt-price volatility.
Demand trajectories are diverging by application. NMC retains a foothold in performance EVs and aerospace projects requiring maximal range, whereas LCO maintains relevance in flagship consumer electronics. LTO and LMFP serve niche use cases where extreme cycle life or temperature tolerance is paramount. Cross-chemistry hybridisation-such as adding manganese to LFP-highlights how suppliers customise electro-chemistry to address specific performance envelopes inside the lithium-ion battery industry.
Cylindrical cells held 50% of the lithium-ion battery market in 2024, anchored by automotive incumbents exploiting highly automated assembly lines. Pouch cells, however, expand 22.5% CAGR by 2030 as their thin profile enables higher packing efficiency in constrained spaces. Comparative testing shows pouch formats deliver 6-8% higher gravimetric energy at pack level when integrated into skateboard chassis.
Prismatic cells, representing around 40% of shipments, strike a balance between mechanical robustness and volumetric efficiency, making them popular among Chinese bus and truck platforms. The form-factor landscape thus segments by OEM design philosophy: Tesla's 4680 cylindrical cell roadmap prioritises scale and energy density, while BYD's blade-style prismatics champion safety and cost. This coexistence demonstrates how differentiated strategies thrive within the diversified lithium-ion battery market.
The Lithium-Ion Battery Market Report is Segmented by Product Type (Lithium Cobalt Oxide, Lithium Iron Phosphate, Lithium Nickel Manganese Cobalt, and Others), Form Factor (Cylindrical, Prismatic, and Pouch), Power Capacity (0 To 3, 000 MAh, 3, 001 To 10, 000 MAh, and Others), End-Use Industry (Automotive, Consumer Electronics, and Others), and Geography (North America. Europe, Asia-Pacific, South America, and Middle East and Africa).
Geography Analysis
Asia-Pacific commanded 55% of the lithium-ion battery market in 2024 and is forecast to post a 31% CAGR to 2030. China alone accounts for roughly 70% of global cell output and 90% of anode materials, leveraging economies of scale and integrated supply chains. Japan and South Korea continue to focus on high-performance chemistries, while India accelerates domestic gigafactory builds under its Production-Linked Incentive programme targeting 104 GWh annual capacity by 2030.
North America benefits from the Inflation Reduction Act, with cell nameplate capacity projected to reach 1,300 GWh yr-1 by 2030, sufficient for 10 million EVs. New plants cluster along the Midwest-to-Southeast corridor where battery-grade nickel, lithium-hydroxide and recycling facilities co-locate. Challenges remain in scaling precursor cathode materials, prompting joint ventures with Asian partners to transfer process know-how.
Europe seeks 30% of global cell production by 2030, led by Poland's 115 GWh LG Energy Solution complex and new projects in Hungary. Strict carbon-footprint regulations push manufacturers toward renewable electricity and robust recycling schemes. Meanwhile, South America monetises lithium brine resources, with Argentina's Sal de Vida targeting 15 kt yr-1 of battery-grade carbonate. The Middle East & Africa leverages critical mineral partnerships, exemplified by a Ugandan lithium-ion pack plant serving regional solar-plus-storage demand.
- Contemporary Amperex Technology Co., Ltd. (CATL)
- BYD Company Limited
- LG Energy Solution Ltd.
- Panasonic Holdings Corp.
- Samsung SDI Co., Ltd.
- SK On Co., Ltd.
- AESC (Envision AESC Group)
- CALB Co., Ltd.
- Gotion High-Tech Co., Ltd.
- EVE Energy Co., Ltd.
- Farasis Energy Inc.
- Sunwoda Electronic Co., Ltd.
- Murata Manufacturing Co., Ltd.
- VARTA AG
- Toshiba Corporation
- Saft Groupe SAS
- Northvolt AB
- Microvast Holdings, Inc.
- A123 Systems LLC
- Hitachi Energy Ltd.
- Lithium Werks BV
- Tesla Inc. (Battery Division)
Additional Benefits:
- The market estimate (ME) sheet in Excel format
- 3 months of analyst support
TABLE OF CONTENTS
1 Introduction
- 1.1 Study Assumptions & Market Definition
- 1.2 Scope of the Study
2 Research Methodology
3 Executive Summary
4 Market Landscape
- 4.1 Market Overview
- 4.2 Market Drivers
- 4.2.1 Surging Demand for High-Energy-Density Batteries in Long-Range EV Platforms
- 4.2.2 China's Industrial Policy ("Made in China 2025") Accelerating Domestic Li-ion Gigafactory Build-out
- 4.2.3 Rapid Roll-out of Utility-Scale Battery Energy Storage Procurements in the United States
- 4.2.4 Stationary Data-centre Back-up Migration from VRLA to Lithium-ion in Nordic Countries
- 4.2.5 Maritime IMO GHG targets Driving Marine-Grade Li-ion Adoption in Europe
- 4.2.6 OEM Shift to LFP Chemistry for Cost-Sensitive Entry-Level EVs in India
- 4.3 Market Restraints
- 4.3.1 Graphite Anode Supply Tightness Owing to Chinese Environmental Curtailments
- 4.3.2 High-Voltage Electrolyte Additive Cost Inflation Post-Ukraine Conflict
- 4.3.3 US-EU Trade Barriers on Critical Minerals Undermining Trans-Atlantic Supply Chains
- 4.3.4 Recycling Infrastructure Lag Delaying Circular Material Flows in Oceania
- 4.4 Supply-Chain Analysis
- 4.5 Recent Trends & Developments
- 4.6 Regulatory Outlook
- 4.7 Technology Outlook
- 4.8 Price Trend Analysis
- 4.9 Porter's Five Forces
- 4.9.1 Bargaining Power of Suppliers
- 4.9.2 Bargaining Power of Buyers
- 4.9.3 Threat of New Entrants
- 4.9.4 Threat of Substitutes
- 4.9.5 Intensity of Competitive Rivalry
5 Market Size & Growth Forecasts
- 5.1 By Product Type
- 5.1.1 Lithium Cobalt Oxide (LCO)
- 5.1.2 Lithium Iron Phosphate (LFP)
- 5.1.3 Lithium Nickel Manganese Cobalt (NMC)
- 5.1.4 Lithium Nickel Cobalt Aluminium (NCA)
- 5.1.5 Lithium Manganese Oxide (LMO)
- 5.1.6 Lithium Titanate (LTO)
- 5.2 By Form Factor
- 5.2.1 Cylindrical
- 5.2.2 Prismatic
- 5.2.3 Pouch
- 5.3 By Power Capacity
- 5.3.1 0 to 3,000 mAh
- 5.3.2 3,001 to 10,000 mAh
- 5.3.3 10,001 to 60,000 mAh
- 5.3.4 Above 60,000 mAh
- 5.4 By End-use Industry
- 5.4.1 Automotive (EV, HEV, PHEV)
- 5.4.2 Consumer Electronics
- 5.4.3 Industrial and Power Tools
- 5.4.4 Stationary Energy Storage
- 5.4.5 Aerospace and Defense
- 5.4.6 Marine
- 5.5 By Geography
- 5.5.1 North America
- 5.5.1.1 United States
- 5.5.1.2 Canada
- 5.5.1.3 Mexico
- 5.5.2 Europe
- 5.5.2.1 United Kingdom
- 5.5.2.2 Germany
- 5.5.2.3 France
- 5.5.2.4 Spain
- 5.5.2.5 Nordic Countries
- 5.5.2.6 Russia
- 5.5.2.7 Rest of Europe
- 5.5.3 Asia-Pacific
- 5.5.3.1 China
- 5.5.3.2 India
- 5.5.3.3 Japan
- 5.5.3.4 South Korea
- 5.5.3.5 Malaysia
- 5.5.3.6 Thailand
- 5.5.3.7 Indonesia
- 5.5.3.8 Vietnam
- 5.5.3.9 Australia
- 5.5.3.10 Rest of Asia-Pacific
- 5.5.4 South America
- 5.5.4.1 Brazil
- 5.5.4.2 Argentina
- 5.5.4.3 Colombia
- 5.5.4.4 Rest of South America
- 5.5.5 Middle East and Africa
- 5.5.5.1 United Arab Emirates
- 5.5.5.2 Saudi Arabia
- 5.5.5.3 South Africa
- 5.5.5.4 Egypt
- 5.5.5.5 Rest of Middle East and Africa
- 5.5.1 North America
6 Competitive Landscape
- 6.1 Market Concentration
- 6.2 Strategic Moves (M&A, Partnerships, PPAs)
- 6.3 Market Share Analysis (Market Rank/Share for key companies)
- 6.4 Company Profiles (includes Global level Overview, Market level overview, Core Segments, Financials as available, Strategic Information, Products & Services, and Recent Developments)
- 6.4.1 Contemporary Amperex Technology Co., Ltd. (CATL)
- 6.4.2 BYD Company Limited
- 6.4.3 LG Energy Solution Ltd.
- 6.4.4 Panasonic Holdings Corp.
- 6.4.5 Samsung SDI Co., Ltd.
- 6.4.6 SK On Co., Ltd.
- 6.4.7 AESC (Envision AESC Group)
- 6.4.8 CALB Co., Ltd.
- 6.4.9 Gotion High-Tech Co., Ltd.
- 6.4.10 EVE Energy Co., Ltd.
- 6.4.11 Farasis Energy Inc.
- 6.4.12 Sunwoda Electronic Co., Ltd.
- 6.4.13 Murata Manufacturing Co., Ltd.
- 6.4.14 VARTA AG
- 6.4.15 Toshiba Corporation
- 6.4.16 Saft Groupe SAS
- 6.4.17 Northvolt AB
- 6.4.18 Microvast Holdings, Inc.
- 6.4.19 A123 Systems LLC
- 6.4.20 Hitachi Energy Ltd.
- 6.4.21 Lithium Werks BV
- 6.4.22 Tesla Inc. (Battery Division)
7 Market Opportunities & Future Outlook
- 7.1 White-space & Unmet-Need Assessment
 2026-2030年全球锂离子电池市场
 圆柱形全极耳电池製造设备市场:按设备类型、电池类型、製造阶段、产能、技术类型、最终用途划分,全球预测(2026-2032年)
 锂离子电池市场规模、份额、趋势和预测:按产品类型、功率容量、应用和地区划分,2026-2034年
 锂离子电池市场分析及预测(至2035年):类型、产品类型、应用、技术、组件、材料类型、最终用户、功能、安装类型、解决方案
 2026-2034年全球锂离子电池市场规模、份额、趋势和成长分析报告全球工业锂离子电池市场规模、份额、趋势和成长分析报告(2026-2034)日本锂离子电池市场报告:按产品类型、功率容量、应用和地区划分(2026-2034年)
 2026年全球可充电聚锂离子电池市场报告2026年全球锂离子电池市场报告
 全球锂离子电池市场:依类型、电力容量、应用、形状和设计、地区划分 - 市场规模、产业动态、机会分析和预测(2026-2035年)