


 |
市场调查报告书
商品编码
1910448
数位转型(DX):市场占有率分析、产业趋势与统计、成长预测(2026-2031)Digital Transformation (DX) - Market Share Analysis, Industry Trends & Statistics, Growth Forecasts (2026 - 2031) |
||||||
※ 本网页内容可能与最新版本有所差异。详细情况请与我们联繫。
预计数位转型(DX)市场将从 2025 年的 1.65 兆美元成长到 2026 年的 2.01 兆美元,到 2031 年将达到 5.33 兆美元,2026 年至 2031 年的复合年增长率为 21.55%。
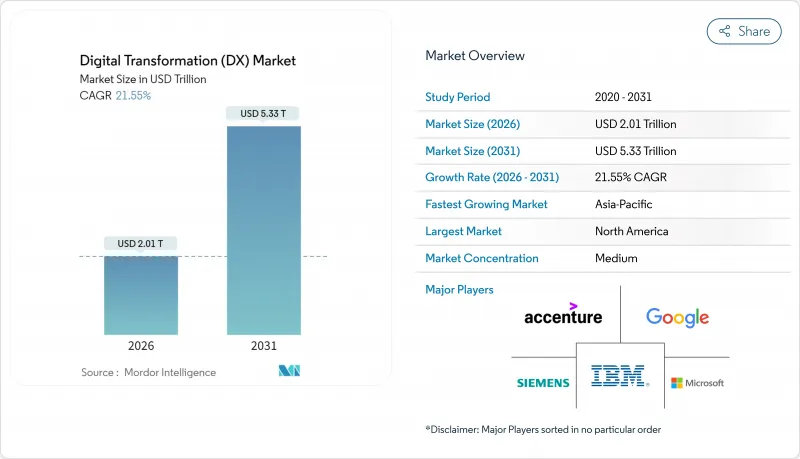
这一强劲成长得益于企业人工智慧的广泛应用、云端优先的支出策略以及监管要求企业实现营运数位化。企业自主制定的人工智慧政策正在推动企业运算在地化,而5G网路则为製造业和医疗保健产业开闢了即时应用情境。低程式码平台正在将应用开发拓展到IT部门之外,而ESG报告法规则加速了资料驱动型合规投资。随着企业在创新目标与旧有系统成本压力之间寻求平衡,渐进式现代化策略正日益受到青睐。由于企业寻求多供应商云端和人工智慧策略以避免被单一供应商锁定,市场竞争仍然保持温和。然而,超大规模云端服务供应商的资本支出正在重新定义数位转型(DX)市场的规模经济。
全球数位转型(DX)市场趋势与洞察
云端优先策略推动企业IT支出快速成长
各组织正在将预算从本地硬体重新分配到支援人工智慧工作负载和混合工作模式的云端原生平台。例如,亚马逊网路服务 (AWS) 的人工智慧助理 Amazon Q 已解答了超过 100 万个内部开发人员的问题,节省了 45 万小时的人力工作。云端经济缩短了采购週期,并将支出从资本预算转移到营运预算,从而加快了实验速度。微软与可口可乐的合作等策略协议表明,生成式人工智慧服务将建构在可扩展的云端基础上。随着企业将云端基础设施视为必需品,供应商正在扩展区域资料中心,以符合各国的资料法规。
跨功能人工智慧/机器学习整合的进展
人工智慧正从试点阶段走向大规模生产。高盛已在多个部门部署了人工智慧助手,联合健康集团正在管理超过1000个人工智慧应用案例,用于自动化理赔处理和临床决策。国防、工业和零售业的领导企业也正在效仿类似的模式,将生成模型融入设计、维护和客户体验工作流程。同时,员工技能提升与资料管治架构也不断完善,使人工智慧从实验性附加功能转变为核心能力。
由于遗留技术债所导致的锁定效应
企业仍然将高达 80% 的 IT 预算用于维护使用了数十年的系统,从而减少了创新资金。 ServiceNow 的一项研究表明,老旧应用程式每年为企业造成每个系统 4 万美元的损失,并每週浪费员工 17 小时的时间。政府机构尤其面临这个问题,它们将 1000 亿美元的 IT 支出中的绝大部分用于维护遗留资产。由此产生的技术债增加了网路安全风险,因为过时的软体缺乏现代化的控制措施。
细分市场分析
到2025年,人工智慧和机器学习将占据数位转型市场份额的28.05%,预计该细分市场将以23.9%的复合年增长率成长,这印证了数据驱动的自动化是一项策略差异化优势。推动数位转型市场规模成长的主要因素是企业正在扩展聊天机器人、建议引擎和预测性维护模型。高盛和洛克希德马丁的生产部署案例表明,这些系统正从试点阶段迈向关键任务阶段。扩增实境工具可将工业员工的培训留任率提高275%,而沃尔玛的食品溯源网路等区块链解决方案则可将溯源检查时间从7天缩短至2.2秒。
同时,边缘运算丛集正以前所未有的速度在感测器附近处理数据,从而避免云端延迟的损失。与数位双胞胎同步的工业机器人能够实现汽车和电子工厂的持续流程最佳化。增材製造生产线利用即时列印工具零件来减少停机时间。这些技术共同推动了数位转型(DX)在重工业领域的市场渗透。
预计到2025年,云端解决方案将占据数位转型(DX)市场62.65%的份额,并在2031年之前以22.1%的复合年增长率成长。这一市场份额与超大规模资料中心超大规模资料中心业者十亿美元的资料中心建设密切相关。 AWS的「Project Rainier」丛集将Trainium 2晶片集群化,旨在打造全球最强大的AI训练电脑。微软800亿美元的基础建设投资也印证了投资週期的加速。儘管企业仍会维护本地节点来处理受监管的工作负载,但混合架构正变得越来越普遍。 Oracle与Oracle云端的合作提供了低延迟、双向且无出口费用的连线。
云端运算的经济模式对缺乏伺服器部署资金的中小型企业也极具吸引力。计量收费模式将成本与实际使用量挂钩,而区域可用区则符合资料居住法规的要求。随着时间的推移,平台锁定问题促使许多公司将微服务分布在多个云端平台上,从而催生了对跨平台编配工具的需求。
数位转型 (DX) 市场按技术(人工智慧/机器学习、扩增实境(VR/AR) 等)、部署模式(云端、本地部署、混合部署)、组织规模(大型企业、中小企业 (SME))、垂直产业(金融、保险和证券 (BFSI)、医疗保健和生命科学、製造业和工业等)以及地区进行细分。市场预测以价值(美元)为单位。
区域分析
到2025年,北美将占据数位转型(DX)市场31.95%的份额,主要得益于充裕的创业投资和接近性超大规模云端总部的地理优势。光是在德克萨斯州,一项耗资5000亿美元的资料中心扩建计划(其中包括英伟达超级电脑)以及德克萨斯投资300亿美元的晶片工厂,就创造了数千个技术就业机会。联邦和州政府机构正在部署「汉弗莱」等人工智慧助理来自动化行政任务,进一步推动了市场需求。美国墨加协定(USMCA)下的跨国合作正在支持加拿大和墨西哥製造业的数位化。
亚太地区正经历最快成长速度,年复合成长率高达22.0%,这主要得益于政府主导的基础建设发展计画和行动优先的消费行为。数位钱包约占电子商务支付的70%,凸显了该地区数位支付的指数级成长。印度、日本和韩国都已製定国家人工智慧战略,澳洲昆士兰州也已累计12亿澳元(约8亿美元)用于发展自主云端服务。这些趋势共同推动了数位转型市场的潜在成长。
欧洲高度重视数位主权,并依据eIDAS 2.0标准强制要求在2027年实现欧洲数位身分钱包的普遍认可。德国的EuroStack计画预计到2035年将投资3,000亿欧元用于计算堆迭的本地化。石勒苏益格-荷尔斯泰因州逐步淘汰专属软体的做法,体现了主权概念的实际应用。儘管南美洲和中东及非洲地区落后于领先地区,但外国对光纤骨干、云端区域和5G部署的投资不断增加,正在为其开闢新的服务机会。
其他福利:
- Excel格式的市场预测(ME)表
- 3个月的分析师支持
目录
第一章 引言
- 研究假设和市场定义
- 调查范围
第二章调查方法
第三章执行摘要
第四章 市场情势
- 市场概览
- 市场驱动因素
- 云端优先策略推动企业IT支出快速成长
- 加强人工智慧/机器学习在各业务职能中的集成
- 利用5G进行即时数据应用的案例
- ESG报告的数位化
- 「数位主权」公共部门资金筹措趋势
- 利用低程式码/无程式码平台实现数位转型民主化
- 市场限制
- 由于遗留技术债所导致的锁定效应
- 网路人才短缺和薪资上涨的压力
- 数位身分监管碎片化
- ESG审核中范围3的数据品质差距
- 供应链分析
- 监管环境
- 技术展望
- 波特五力模型
- 新进入者的威胁
- 供应商的议价能力
- 买方的议价能力
- 替代品的威胁
- 竞争对手之间的竞争
- 产业生态系分析
- 对影响市场的宏观经济因素进行评估
第五章 市场规模与成长预测
- 透过技术
- 人工智慧和机器学习
- 扩增实境(VR/AR)
- 物联网 (IoT)
- 工业机器人
- 区块链
- 数位双胞胎
- 积层製造/工业3D列印
- 边缘运算
- 其他的
- 按部署模式
- 云
- 本地部署
- 杂交种
- 按组织规模
- 大公司
- 中小企业
- 按行业
- BFSI
- 医疗保健和生命科学
- 製造业和工业
- 零售与电子商务
- 能源与公共产业
- 汽车/运输设备
- 政府和公共部门
- 其他(媒体、教育等)
- 按地区
- 北美洲
- 美国
- 加拿大
- 墨西哥
- 南美洲
- 巴西
- 阿根廷
- 其他南美洲
- 欧洲
- 德国
- 英国
- 法国
- 义大利
- 西班牙
- 其他欧洲地区
- 亚太地区
- 中国
- 日本
- 印度
- 韩国
- 东南亚
- 亚太其他地区
- 中东和非洲
- 中东
- 沙乌地阿拉伯
- 阿拉伯聯合大公国
- 土耳其
- 其他中东地区
- 非洲
- 南非
- 奈及利亚
- 埃及
- 其他非洲地区
- 中东
- 北美洲
第六章 竞争情势
- 市场集中度
- 策略趋势
- 市占率分析
- 公司简介
- Accenture
- Microsoft
- IBM
- Google(Alphabet)
- AWS(Amazon)
- SAP
- Oracle
- Adobe
- Salesforce
- Cisco Systems
- Dell Technologies
- Siemens
- Hewlett Packard Enterprise
- Cognex
- Apple
- ServiceNow
- Infosys
- Capgemini
- Wipro
- Schneider Electric
- Honeywell
- Hitachi
- Fujitsu
- Huawei
第七章 市场机会与未来展望
The digital transformation market is expected to grow from USD 1.65 trillion in 2025 to USD 2.01 trillion in 2026 and is forecast to reach USD 5.33 trillion by 2031 at 21.55% CAGR over 2026-2031.
Strong growth stems from enterprise AI adoption, cloud-first spending priorities, and regulatory mandates that compel organizations to digitize operations. Sovereign-AI policies push companies to localize computing, while 5G networks open real-time use cases in manufacturing and healthcare. Low-code platforms extend application development beyond IT departments, and ESG reporting rules accelerate data-driven compliance investments. Incremental modernization strategies gain favor as enterprises balance innovation goals with legacy-system cost pressures. Competitive intensity remains moderate because businesses pursue multi-vendor cloud and AI strategies to avoid lock-in, yet hyperscale-provider capital expenditure is redefining scale economics in the digital transformation market.
Global Digital Transformation (DX) Market Trends and Insights
Cloud-first enterprise IT spending boom
Organizations are reallocating budgets from on-premise hardware toward cloud-native platforms that support AI workloads and hybrid work models. For example, Amazon Web Services resolved more than 1 million internal developer questions with its AI assistant Amazon Q, saving 450,000 hours of manual effort. Cloud economics shorten procurement cycles and shift spending from capital to operating budgets, allowing faster experimentation. Strategic deals, such as Microsoft's partnership with Coca-Cola, show how generative-AI services ride atop scalable cloud foundations. As enterprises view cloud infrastructure as essential, vendors expand regional data centers to comply with sovereign-data rules.
Rising AI/ML integration across business functions
AI moves from pilots to production at scale. Goldman Sachs rolled out AI assistants across multiple departments, and UnitedHealth Group manages more than 1,000 AI use cases that automate claims and clinical decisions. Defense, industrial, and retail leaders replicate the pattern, embedding generative models in design, maintenance, and customer-experience workflows. Workforce upskilling and data-governance frameworks mature in tandem, making AI a core competency rather than an experimental add-on.
Legacy technical-debt lock-ins
Enterprises still devote up to 80% of IT budgets to maintain decades-old systems, reducing funds for innovation. ServiceNow found that aging applications cost USD 40,000 annually per system and drain 17 employee hours weekly.Government agencies illustrate the problem, spending the majority of their USD 100 billion IT outlay on legacy assets. The resulting technical debt inflates cybersecurity risk because outdated software lacks modern controls.
Other drivers and restraints analyzed in the detailed report include:
- 5G-enabled real-time data use-cases
- Mandatory ESG reporting digitisation
- Cyber-talent scarcity and wage inflation
For complete list of drivers and restraints, kindly check the Table Of Contents.
Segment Analysis
AI and ML claimed 28.05% of digital transformation market share in 2025, and the segment is expected to grow at 23.9% CAGR, reinforcing that data-driven automation is a strategic differentiator. This portion of the digital transformation market size is fueled by enterprises scaling chatbots, recommendation engines, and predictive-maintenance models. Production deployments at Goldman Sachs and Lockheed Martin exemplify the shift from pilots to mission-critical systems. Extended-Reality tools deliver 275% training-retention gains for industrial employees, while blockchain solutions such as Walmart's food-traceability network cut provenance checks from 7 days to 2.2 seconds.
A parallel wave of edge-computing clusters processes data near sensors to avoid cloud-latency penalties. Industrial robotics synchronized with digital twins allow continuous process optimization in automotive and electronics plants. Additive-manufacturing lines use real-time prints of tooling components to shrink downtime. Together these technologies deepen the digital transformation market penetration across heavy industries.
Cloud solutions owned 62.65% of digital transformation market share in 2025 and will expand at 22.1% CAGR through 2031. This share of the digital transformation market size correlates with hyperscalers' multi-billion-dollar data-center builds. AWS's Project Rainier clusters Trainium 2 chips into the world's most powerful AI training computer. Microsoft's USD 80 billion infrastructure spend underscores escalating investment cycles. Enterprises retain on-premises nodes for regulated workloads, yet hybrid architectures flourish; Oracle's pact with Google Cloud allows bidirectional low-latency links with no egress fees.
Cloud economics also attract small businesses that lack capital budgets for servers. Pay-as-you-go models align costs with usage, and regional availability zones satisfy data-residency regulations. Over time, platform lock-in concerns lead many firms to distribute microservices across multiple clouds, creating demand for cross-plane orchestration tools.
Digital Transformation Market is Segmented by Technology (AI and ML, Extended Reality (VR/AR), and More), Deployment Model (Cloud, On-Premises, Hybrid), Organization Size (Large Enterprises, Small and Medium Enterprises (SMEs)), Industry Vertical (BFSI, Healthcare and Life-Sciences, Manufacturing and Industrial, and More), and by Geography. The Market Forecasts are Provided in Terms of Value (USD).
Geography Analysis
North America secured 31.95% of digital transformation market share in 2025, anchored by deep venture capital pools and proximity to hyperscale-cloud headquarters. Texas alone hosts a USD 500 billion data-center expansion featuring NVIDIA supercomputers, plus Texas Instruments' USD 30 billion chip plant that adds thousands of tech jobs. Federal and state agencies adopt AI assistants like "Humphrey" to automate administrative tasks, further boosting demand. Cross-border initiatives under USMCA support manufacturing digitisation throughout Canada and Mexico.
Asia-Pacific delivers the fastest growth at 22.0% CAGR due to extensive government infrastructure programs and mobile-first consumer behavior. Digital wallets account for nearly 70% of e-commerce checkouts, highlighting the region's leapfrog adoption curves. India, Japan, and South Korea each articulate national AI strategies, while Australia's Queensland earmarked AUD 1.2 billion (USD 800 million) for sovereign-cloud services. Combined, these moves expand the addressable digital transformation market.
Europe emphasizes digital sovereignty under eIDAS 2.0, mandating universal acceptance of European Digital Identity Wallets by 2027. Germany's EuroStack program predicts EUR 300 billion investment to localize compute stacks by 2035. Schleswig-Holstein's migration away from proprietary software shows practical implementation of sovereignty ideals. South America and the Middle East and Africa trail the leading regions but experience rising foreign investment in fiber backbones, cloud regions, and 5G rollouts, unlocking new service opportunities.
- Accenture
- Microsoft
- IBM
- Google (Alphabet)
- AWS (Amazon)
- SAP
- Oracle
- Adobe
- Salesforce
- Cisco Systems
- Dell Technologies
- Siemens
- Hewlett Packard Enterprise
- Cognex
- Apple
- ServiceNow
- Infosys
- Capgemini
- Wipro
- Schneider Electric
- Honeywell
- Hitachi
- Fujitsu
- Huawei
Additional Benefits:
- The market estimate (ME) sheet in Excel format
- 3 months of analyst support
TABLE OF CONTENTS
1 INTRODUCTION
- 1.1 Study Assumptions and Market Definition
- 1.2 Scope of the Study
2 RESEARCH METHODOLOGY
3 EXECUTIVE SUMMARY
4 MARKET LANDSCAPE
- 4.1 Market Overview
- 4.2 Market Drivers
- 4.2.1 Cloud-first enterprise IT spending boom
- 4.2.2 Rising AI/ML integration across business functions
- 4.2.3 5G-enabled real-time data use-cases
- 4.2.4 Mandatory ESG reporting digitisation
- 4.2.5 "Digital-sovereignty" public-sector funding waves
- 4.2.6 Low-code / no-code platforms democratising DX
- 4.3 Market Restraints
- 4.3.1 Legacy technical-debt lock-ins
- 4.3.2 Cyber-talent scarcity and wage inflation
- 4.3.3 Digital-identity regulatory fragmentation
- 4.3.4 Scope-3 data-quality gaps for ESG audits
- 4.4 Supply-Chain Analysis
- 4.5 Regulatory Landscape
- 4.6 Technological Outlook
- 4.7 Porter's Five Forces
- 4.7.1 Threat of New Entrants
- 4.7.2 Bargaining Power of Suppliers
- 4.7.3 Bargaining Power of Buyers
- 4.7.4 Threat of Substitutes
- 4.7.5 Competitive Rivalry
- 4.8 Industry Ecosystem Analysis
- 4.9 Assesment of Macroeconomic Factors on the market
5 MARKET SIZE AND GROWTH FORECASTS (VALUE)
- 5.1 By Technology
- 5.1.1 AI and ML
- 5.1.2 Extended Reality (VR/AR)
- 5.1.3 Internet of Things (IoT)
- 5.1.4 Industrial Robotics
- 5.1.5 Blockchain
- 5.1.6 Digital Twin
- 5.1.7 Additive Manufacturing / Industrial 3-D Printing
- 5.1.8 Edge Computing
- 5.1.9 Others
- 5.2 By Deployment Model
- 5.2.1 Cloud
- 5.2.2 On-Premise
- 5.2.3 Hybrid
- 5.3 By Organization Size
- 5.3.1 Large Enterprises
- 5.3.2 Small and Medium Enterprises (SMEs)
- 5.4 By Industry Vertical
- 5.4.1 BFSI
- 5.4.2 Healthcare and Life-Sciences
- 5.4.3 Manufacturing and Industrial
- 5.4.4 Retail and E-commerce
- 5.4.5 Energy and Utilities
- 5.4.6 Automotive and Transportation
- 5.4.7 Government and Public Sector
- 5.4.8 Others (Media, Education, etc.)
- 5.5 By Geography
- 5.5.1 North America
- 5.5.1.1 United States
- 5.5.1.2 Canada
- 5.5.1.3 Mexico
- 5.5.2 South America
- 5.5.2.1 Brazil
- 5.5.2.2 Argentina
- 5.5.2.3 Rest of South America
- 5.5.3 Europe
- 5.5.3.1 Germany
- 5.5.3.2 United Kingdom
- 5.5.3.3 France
- 5.5.3.4 Italy
- 5.5.3.5 Spain
- 5.5.3.6 Rest of Europe
- 5.5.4 Asia-Pacific
- 5.5.4.1 China
- 5.5.4.2 Japan
- 5.5.4.3 India
- 5.5.4.4 South Korea
- 5.5.4.5 Southeast Asia
- 5.5.4.6 Rest of Asia-Pacific
- 5.5.5 Middle East and Africa
- 5.5.5.1 Middle East
- 5.5.5.1.1 Saudi Arabia
- 5.5.5.1.2 United Arab Emirates
- 5.5.5.1.3 Turkey
- 5.5.5.1.4 Rest of Middle East
- 5.5.5.2 Africa
- 5.5.5.2.1 South Africa
- 5.5.5.2.2 Nigeria
- 5.5.5.2.3 Egypt
- 5.5.5.2.4 Rest of Africa
- 5.5.5.1 Middle East
- 5.5.1 North America
6 COMPETITIVE LANDSCAPE
- 6.1 Market Concentration
- 6.2 Strategic Moves
- 6.3 Market Share Analysis
- 6.4 Company Profiles {(includes Global level Overview, Market level overview, Core Segments, Financials as available, Strategic Information, Market Rank/Share for key companies, Products and Services, and Recent Developments)}
- 6.4.1 Accenture
- 6.4.2 Microsoft
- 6.4.3 IBM
- 6.4.4 Google (Alphabet)
- 6.4.5 AWS (Amazon)
- 6.4.6 SAP
- 6.4.7 Oracle
- 6.4.8 Adobe
- 6.4.9 Salesforce
- 6.4.10 Cisco Systems
- 6.4.11 Dell Technologies
- 6.4.12 Siemens
- 6.4.13 Hewlett Packard Enterprise
- 6.4.14 Cognex
- 6.4.15 Apple
- 6.4.16 ServiceNow
- 6.4.17 Infosys
- 6.4.18 Capgemini
- 6.4.19 Wipro
- 6.4.20 Schneider Electric
- 6.4.21 Honeywell
- 6.4.22 Hitachi
- 6.4.23 Fujitsu
- 6.4.24 Huawei
7 MARKET OPPORTUNITIES AND FUTURE OUTLOOK
- 7.1 White-space and Unmet-need Assessment
 2026-2030年全球数位转型服务市场
 数位转型市场分析及预测(至2035年):按类型、产品、服务、技术、组件、应用、部署、最终用户、流程和解决方案划分
 2026-2034年全球数位转型市场规模、份额、趋势和成长分析报告
 全球 AI RAN 市场(2026 年 1 月)数位转型市场-2026-2031年预测
 数位转型市场-全球产业规模、份额、趋势、机会及预测(依技术、最终用途、部署方式、地区及竞争格局划分,2021-2031年)
 数位化赋能服务市场:依服务类型、技术、组织规模、垂直产业和部署模式划分-2026-2032年全球预测
 中东数位转型:市场占有率分析、产业趋势与统计、成长预测(2026-2031)
 工程生产力平台市场预测至2032年:按组件、平台用户、技术、最终用户和地区分類的全球分析印度成长展望:转型与大趋势,2040 年