


 |
市场调查报告书
商品编码
1851646
云端人工智慧:市场占有率分析、产业趋势、统计数据和成长预测(2025-2030 年)Cloud AI - Market Share Analysis, Industry Trends & Statistics, Growth Forecasts (2025 - 2030) |
||||||
※ 本网页内容可能与最新版本有所差异。详细情况请与我们联繫。
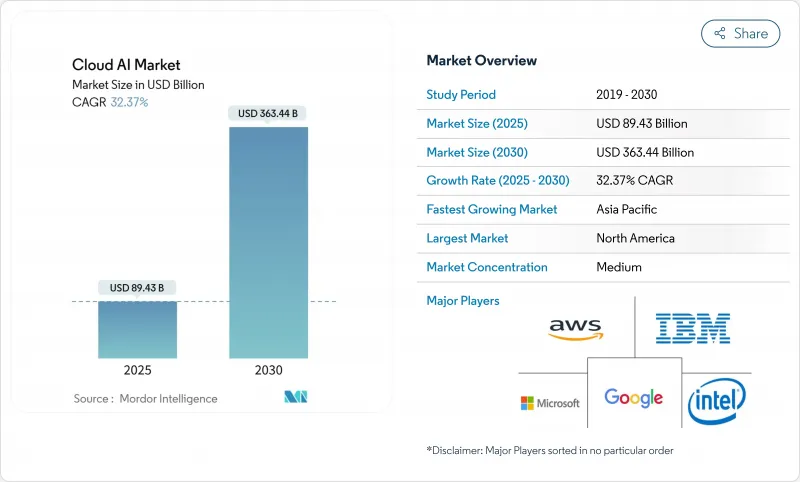
预计到 2025 年,云端运算 AI 市场规模将达到 894.3 亿美元,到 2030 年将扩大到 3,634.4 亿美元,复合年增长率为 32.37%。
微软向 OpenAI 投资 130 亿美元,亚马逊向 Anthropic 投资 80 亿美元等生成式人工智慧伙伴关係,正在扩大产能、降低进入门槛,并加速企业实现价值的速度。 GPU 分片技术正在降低基础设施成本,而医疗保健和金融服务等产业的特定法规则更有利于那些能够展现出强大管治的供应商。供应链动态,尤其是高频宽记忆体的供应链动态,正在推动超大规模资料中心营运商采取晶片多元化策略,而注重碳排放的工作负载编配也开始影响资料中心的选址决策。
全球云端人工智慧市场趋势与洞察
人工智慧即服务 (AIaaS) 的采用率不断提高
企业正从资本密集的本地部署转向计量收费的人工智慧服务。微软的人工智慧业务在2025财年第二季达到130亿美元的年收入,为Azure的成长贡献了16个百分点。 AWS Trainium2等客製化晶片可带来30-40%的性价比提升,扩大了必须满足区域资料主权法规的中型企业取得人工智慧的管道。欧洲和亚洲的采用率尤其高,这两个地区60%的中型企业预计到2025年将拥有本地训练的语言模型。
巨量资料量不断成长
非结构化资料占企业资料资产的 80% 以上,推动了对即时人工智慧分析的需求。医疗保健领域的应用案例包括:梅奥诊所处理 10 万名患者的基因组记录,以提高疾病早期检测率;金融服务业应用云人工智慧将洗钱防制筛检中的误报率降低了 95%;边缘云融合使製造商能够以毫秒级的响应时间对物联网数据流进行预测性维护。
GPU/HBM供应链持续短缺
SK海力士控制着70%的HBM市场,并表示其产能将在2025年之前全部售罄,这将给云端服务供应商带来成本压力。 AWS正在透过Trainium客製化晶片来应对,而Oracle购买了数千块NVIDIA Blackwell GPU以维持训练能力。记忆体供应紧张导致DDR5和VRAM价格上涨,促使三星与AMD签署了一项价值30亿美元的HBM3E供应协议。
细分市场分析
到2024年,解决方案将占云端人工智慧市场的63%。企业已倾向于采用可与现有DevOps流程整合的打包平台,以确保快速部署和效能稳定。随着采用率的不断提高,专家指导对于迁移蓝图和管治至关重要,这将推动服务领域的复合年增长率达到33.98%。
服务成长反映了涵盖策略、模型调优和营运管理等方面的多年转型计划。例如,Accenture正在为其在AWS上的Anthropic部署专案对1400名工程师进行再培训,直接解决企业技能缺口问题。解决方案与服务结合的产品越来越受欢迎,使企业能够在快速采用人工智慧的同时建立内部能力。
到2024年,银行、金融服务和保险(BFSI)产业将占据云端人工智慧市场份额的29%,这主要得益于诈骗分析和智慧投顾等应用情境。然而,医疗保健产业预计将以35.61%的复合年增长率成长,这主要得益于人工智慧驱动的诊断和环境临床文件记录。
医院正在部署大规模语言模型,用于放射科分诊和个人化治疗建议。美国食品药物管理局 (FDA) 于 2025 年 1 月发布的指南提供了清晰的监管路径,并鼓励资本投资。製造业和零售业分别利用人工智慧进行缺陷检测和库存优化。
云端人工智慧市场报告按类型(解决方案和服务)、垂直产业(银行、金融服务和保险、医疗保健、汽车和旅游、其他)、部署模式(公共云端、私有云端、其他)、应用(诈欺和风险分析、行销和个人化、其他)、技术(机器学习、生成式人工智慧、其他)和地区进行细分。
区域分析
北美将在2024年维持41%的云端人工智慧市场份额,这主要得益于超大规模资料中心营运商的布局和创业投资资金。监管政策的明朗化,例如美国食品药物管理局(FDA)发布的人工智慧设备指南,将推动生命科学和金融领域的应用。包括亚马逊对Anthropic的80亿美元投资以及微软持续整合OpenAI在内的资本支出,将进一步巩固该地区的领先地位。
亚太地区是成长最快的地区,复合年增长率高达32.41%。预计到2025年,中国将在云端运算领域投入460亿美元,阿里巴巴的多年资本支出承诺也正在推动基础设施的扩张。日本的发展势头强劲,Oracle投资80亿美元,东京也被选为OpenAI在印太地区的首个分公司所在地。印度和东南亚将受益于数位公共基础设施项目和开发团体。
儘管监管环境复杂,欧洲仍维持稳定成长。欧盟人工智慧法律提供了一个统一的框架,有利于拥有认证管治的供应商。主权云端倡议和碳减排指令正在推动混合架构的发展。在政府支持的资料中心投资推动下,中东和非洲等新兴市场正率先采用人工智慧技术。
其他福利:
- Excel格式的市场预测(ME)表
- 3个月的分析师支持
目录
第一章 引言
- 研究假设和市场定义
- 调查范围
第二章调查方法
第三章执行摘要
第四章 市场情势
- 市场概览
- 市场驱动因素
- 巨量资料量不断成长
- 人工智慧即服务 (AIaaS) 的采用率不断提高
- 对虚拟助理和GenAI聊天机器人的需求不断增长
- GenAI GPU 分工扩大了中小企业的使用范围。
- 边缘云端人工智慧互通性标准(ONNX、MEDAL 等)
- 奖励碳意识工作负载编配
- 市场限制
- 技术工人短缺和资料安全问题
- GPU/HBM供应链持续短缺
- 人工智慧资料中心的能源限制和碳排放法规
- 地缘政治GPU出口法律规范
- 价值链分析
- 监管环境
- 技术展望
- 波特五力分析
- 新进入者的威胁
- 供应商的议价能力
- 买方的议价能力
- 替代品的威胁
- 竞争对手之间的竞争
第五章 市场规模与成长预测
- 按类型
- 解决方案
- 服务
- 按最终用户行业划分
- BFSI
- 卫生保健
- 汽车与出行
- 零售与电子商务
- 政府/公共部门
- 教育
- 製造业
- 按部署模式
- 公有云
- 私有云端
- 混合/多重云端
- 透过使用
- 人工智慧在客户服务和客服中心的应用
- 预测性维护和资产管理
- 诈欺和风险分析
- 行销与个人化
- 电脑视觉服务
- 透过技术
- 机器学习
- 自然语言处理
- 电脑视觉
- 生成式人工智慧
- 增强型人工智慧和边缘人工智慧
- 按地区
- 北美洲
- 美国
- 加拿大
- 墨西哥
- 南美洲
- 巴西
- 阿根廷
- 智利
- 其他南美洲
- 欧洲
- 德国
- 英国
- 法国
- 义大利
- 西班牙
- 荷兰
- 俄罗斯
- 其他欧洲地区
- 亚太地区
- 中国
- 印度
- 日本
- 韩国
- ASEAN
- 亚太其他地区
- 中东和非洲
- 中东
- 海湾合作委员会(沙乌地阿拉伯、阿联酋、卡达等)
- 土耳其
- 其他中东地区
- 非洲
- 南非
- 奈及利亚
- 肯亚
- 其他非洲地区
- 北美洲
第六章 竞争情势
- 市场集中度
- 策略趋势
- 市占率分析
- 公司简介
- Amazon Web Services
- Microsoft Corp.
- Google LLC
- IBM Corp.
- Salesforce Inc.
- NVIDIA Corp.
- Oracle Corp.
- Alibaba Cloud
- SAP SE
- ServiceNow
- Databricks
- Snowflake Inc.
- Hugging Face
- OpenAI LP
- Anthropic PBC
- CoreWeave
- AMD Inc.
- Intel Corp.
- Wipro Ltd.
- Infosys Ltd.
- SoundHound AI Inc.
- Twilio Inc.
第七章 市场机会与未来展望
The Cloud AI market reached USD 89.43 billion in 2025 and is forecast to advance to USD 363.44 billion by 2030, reflecting a 32.37% CAGR.
Generative AI partnerships, such as Microsoft's USD 13 billion commitment to OpenAI and Amazon's USD 8 billion investment in Anthropic, are expanding capacity, lowering entry barriers, and accelerating time-to-value for enterprises. Mid-market adoption is rising as GPU-fractionalization technologies reduce infrastructure costs, while sector-specific regulations in healthcare and financial services favor providers that can demonstrate robust governance. Supply-chain dynamics, notably in high-bandwidth memory, spur chip diversification strategies among hyperscalers, and carbon-aware workload orchestration begins to influence data-center siting decisions.
Global Cloud AI Market Trends and Insights
Growing Adoption of AI-as-a-Service (AIaaS)
Enterprises are shifting from capital-heavy on-premises deployments to pay-as-you-go AI services. Microsoft's AI business reached a USD 13 billion annual run rate in Q2 FY 2025, contributing 16 percentage points to Azure growth. Custom silicon such as AWS Trainium2 delivers 30-40% price-performance gains, broadening AI accessibility for mid-market firms that must meet regional data-sovereignty rules. Uptake is evident across Europe and Asia, where 60% of mid-size enterprises expect regionally trained language models by 2025.
Rising Big-Data Volume
Unstructured data exceeds 80% of enterprise information assets, driving demand for real-time AI analytics. Healthcare use cases include Mayo Clinic processing genomic records from 100,000 patients to improve early disease detection. Financial services apply cloud AI to reduce false positives in anti-money-laundering screening by 95%. Edge-cloud convergence allows manufacturers to perform predictive maintenance on IoT data streams with millisecond response times.
Persistent GPU/HBM Supply-Chain Shortages
SK Hynix controls 70% of the HBM market and reports full allocation through 2025, creating cost pressures for cloud providers. AWS counters with Trainium custom chips, while Oracle procures thousands of NVIDIA Blackwell GPUs to sustain training capacity. Tight memory supply has triggered price spikes in DDR5 and VRAM, with Samsung inking a USD 3 billion HBM3E supply deal with AMD.
Other drivers and restraints analyzed in the detailed report include:
- Increasing Demand for Virtual Assistants and GenAI Chatbots
- GenAI GPU-Fractionalization Expanding SME Access
- Lack of Skilled Workforce and Data-Security Concerns
For complete list of drivers and restraints, kindly check the Table Of Contents.
Segment Analysis
Solutions represented 63% of the Cloud AI market in 2024. Enterprises gravitated to packaged platforms that integrate with existing DevOps pipelines, ensuring quick deployment and consistent performance. As adoption deepens, professional guidance becomes essential for migration roadmaps and governance, pushing the Services segment to a forecast 33.98% CAGR.
Services growth reflects multi-year transformation programs that include strategy, model tuning, and managed operations. Firms such as Accenture have retrained 1,400 engineers for Anthropic-on-AWS implementations, directly addressing enterprise skills gaps. Combined solution-service offerings are growing in popularity, enabling organizations to onboard AI quickly while building internal competencies.
BFSI held 29% Cloud AI market share in 2024 due to fraud analytics and robo-advisory use cases. However, Healthcare is set to grow at 35.61% CAGR, buoyed by AI-enabled diagnostics and ambient clinical documentation.
Hospitals deploy large language models for radiology triage and personalized treatment recommendations. The FDA's January 2025 guidance provides a clear regulatory path, encouraging capital investment. Manufacturing and retail follow, leveraging AI for defect detection and inventory optimization, respectively.
The Cloud AI Market Report is Segmented by Type (Solution and Service), End-User Vertical (BFSI, Healthcare, Automotive and Mobility, and More), Deployment Model (Public Cloud, Private Cloud, and More), Application (Fraud and Risk Analytics, Marketing and Personalisation, and More), Technology (Machine Learning, Generative AI, and More), and Geography.
Geography Analysis
North America retained 41% Cloud AI market share in 2024, anchored by hyperscaler footprints and venture funding. Regulatory clarity, exemplified by the FDA's AI device guidelines, encourages adoption across life-sciences and finance. Capital outlays include Amazon's USD 8 billion Anthropic investment and Microsoft's continued OpenAI integration, reinforcing regional dominance.
Asia Pacific is the fastest-growing territory with 32.41% CAGR. China's projected USD 46 billion cloud spend for 2025, along with Alibaba's multi-year capex commitment, fuels infrastructure expansion. Japan accelerates with Oracle's USD 8 billion pledge and Tokyo's selection for OpenAI's first Indo-Pacific branch. India and Southeast Asia benefit from digital public-infrastructure programs and rising developer communities.
Europe shows steady growth amid complex regulation. The EU AI Act provides a harmonized framework that advantages providers with certified governance. Sovereign cloud initiatives and carbon-reduction mandates encourage hybrid architectures. Emerging markets in the Middle East and Africa witness early uptake, backed by sovereign-wealth investments in data centers.
- Amazon Web Services
- Microsoft Corp.
- Google LLC
- IBM Corp.
- Salesforce Inc.
- NVIDIA Corp.
- Oracle Corp.
- Alibaba Cloud
- SAP SE
- ServiceNow
- Databricks
- Snowflake Inc.
- Hugging Face
- OpenAI LP
- Anthropic PBC
- CoreWeave
- AMD Inc.
- Intel Corp.
- Wipro Ltd.
- Infosys Ltd.
- SoundHound AI Inc.
- Twilio Inc.
Additional Benefits:
- The market estimate (ME) sheet in Excel format
- 3 months of analyst support
TABLE OF CONTENTS
1 INTRODUCTION
- 1.1 Study Assumptions and Market Definition
- 1.2 Scope of the Study
2 RESEARCH METHODOLOGY
3 EXECUTIVE SUMMARY
4 MARKET LANDSCAPE
- 4.1 Market Overview
- 4.2 Market Drivers
- 4.2.1 Rising big-data volume
- 4.2.2 Growing adoption of AI-as-a-Service (AIaaS)
- 4.2.3 Increasing demand for virtual assistants and GenAI chatbots
- 4.2.4 GenAI GPU-fractionalization expanding SME access
- 4.2.5 Edge-cloud AI interoperability standards (e.g., ONNX, MEDAL)
- 4.2.6 Carbon-aware workload orchestration incentives
- 4.3 Market Restraints
- 4.3.1 Lack of skilled workforce and data-security concerns
- 4.3.2 Persistent GPU/HBM supply-chain shortages
- 4.3.3 AI datacentre energy constraints and carbon regulations
- 4.3.4 Geopolitical GPU export-control frameworks
- 4.4 Value Chain Analysis
- 4.5 Regulatory Landscape
- 4.6 Technological Outlook
- 4.7 Porter's Five Forces Analysis
- 4.7.1 Threat of New Entrants
- 4.7.2 Bargaining Power of Suppliers
- 4.7.3 Bargaining Power of Buyers
- 4.7.4 Threat of Substitutes
- 4.7.5 Intensity of Competitive Rivalry
5 MARKET SIZE AND GROWTH FORECASTS (VALUE)
- 5.1 By Type
- 5.1.1 Solution
- 5.1.2 Service
- 5.2 By End-user Vertical
- 5.2.1 BFSI
- 5.2.2 Healthcare
- 5.2.3 Automotive and Mobility
- 5.2.4 Retail and E-commerce
- 5.2.5 Government and Public Sector
- 5.2.6 Education
- 5.2.7 Manufacturing
- 5.3 By Deployment Model
- 5.3.1 Public Cloud
- 5.3.2 Private Cloud
- 5.3.3 Hybrid / Multi-cloud
- 5.4 By Application
- 5.4.1 Customer Service and Contact-Centre AI
- 5.4.2 Predictive Maintenance and Asset Ops
- 5.4.3 Fraud and Risk Analytics
- 5.4.4 Marketing and Personalisation
- 5.4.5 Computer-Vision-as-a-Service
- 5.5 By Technology
- 5.5.1 Machine Learning
- 5.5.2 Natural Language Processing
- 5.5.3 Computer Vision
- 5.5.4 Generative AI
- 5.5.5 Reinforcement and Edge AI
- 5.6 By Geography
- 5.6.1 North America
- 5.6.1.1 United States
- 5.6.1.2 Canada
- 5.6.1.3 Mexico
- 5.6.2 South America
- 5.6.2.1 Brazil
- 5.6.2.2 Argentina
- 5.6.2.3 Chile
- 5.6.2.4 Rest of South America
- 5.6.3 Europe
- 5.6.3.1 Germany
- 5.6.3.2 United Kingdom
- 5.6.3.3 France
- 5.6.3.4 Italy
- 5.6.3.5 Spain
- 5.6.3.6 Netherlands
- 5.6.3.7 Russia
- 5.6.3.8 Rest of Europe
- 5.6.4 Asia Pacific
- 5.6.4.1 China
- 5.6.4.2 India
- 5.6.4.3 Japan
- 5.6.4.4 South Korea
- 5.6.4.5 ASEAN
- 5.6.4.6 Rest of Asia Pacific
- 5.6.5 Middle East and Africa
- 5.6.5.1 Middle East
- 5.6.5.1.1 GCC (Saudi Arabia, UAE, Qatar, etc.)
- 5.6.5.1.2 Turkey
- 5.6.5.1.3 Rest of Middle East
- 5.6.5.2 Africa
- 5.6.5.2.1 South Africa
- 5.6.5.2.2 Nigeria
- 5.6.5.2.3 Kenya
- 5.6.5.2.4 Rest of Africa
- 5.6.1 North America
6 COMPETITIVE LANDSCAPE
- 6.1 Market Concentration
- 6.2 Strategic Moves
- 6.3 Market Share Analysis
- 6.4 Company Profiles (includes Global level Overview, Market level overview, Core Segments, Financials as available, Strategic Information, Market Rank/Share for key companies, Products and Services, and Recent Developments)
- 6.4.1 Amazon Web Services
- 6.4.2 Microsoft Corp.
- 6.4.3 Google LLC
- 6.4.4 IBM Corp.
- 6.4.5 Salesforce Inc.
- 6.4.6 NVIDIA Corp.
- 6.4.7 Oracle Corp.
- 6.4.8 Alibaba Cloud
- 6.4.9 SAP SE
- 6.4.10 ServiceNow
- 6.4.11 Databricks
- 6.4.12 Snowflake Inc.
- 6.4.13 Hugging Face
- 6.4.14 OpenAI LP
- 6.4.15 Anthropic PBC
- 6.4.16 CoreWeave
- 6.4.17 AMD Inc.
- 6.4.18 Intel Corp.
- 6.4.19 Wipro Ltd.
- 6.4.20 Infosys Ltd.
- 6.4.21 SoundHound AI Inc.
- 6.4.22 Twilio Inc.
7 MARKET OPPORTUNITIES AND FUTURE OUTLOOK
- 7.1 White-space and Unmet-need Assessment
 机器学习即服务 (MaaS) 市场规模、份额和成长分析(按组件、组织规模、应用、最终用户和地区划分)—2026-2033 年行业预测
 机器学习即服务市场-全球产业规模、份额、趋势、机会和预测(按应用、组织规模、最终用户、地区和竞争格局划分,2020-2030 年预测)
 2025年全球云端AI市场报告2025年全球云端人工智慧(AI)解决方案市场报告2025年全球机器学习即服务(MLaaS)市场报告
 2025-2029年全球云端客服中心解决方案人工智慧市场
 2025-2029年全球人工智慧云端解决方案市场
 全球云端 AI 市场按组件、技术、託管类型、应用程式、最终用途产业、部署模型和公司规模分類的预测(2025-2030 年)
 全球机器学习即服务市场研究报告 - 产业分析、规模、份额、成长、趋势及 2025 年至 2033 年预测
 云端电信 AI 市场机会、成长动力、产业趋势分析及 2025 - 2034 年预测