


 |
市场调查报告书
商品编码
1851788
碳捕获与储存(CCS):市场份额分析、产业趋势、统计和成长预测(2025-2030 年)Carbon Capture And Storage - Market Share Analysis, Industry Trends & Statistics, Growth Forecasts (2025 - 2030) |
||||||
※ 本网页内容可能与最新版本有所差异。详细情况请与我们联繫。
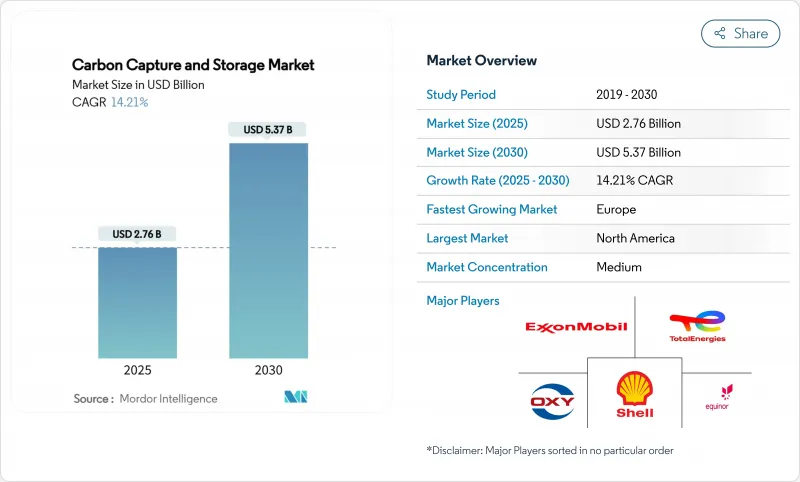
预计到 2025 年,碳捕获与储存(CCS) 市场规模为 27.6 亿美元,到 2030 年将达到 53.7 亿美元,预测期(2025-2030 年)复合年增长率为 14.21%。
监管压力不断加大、碳捕集技术日趋成熟,以及人们逐渐意识到重工业若不采取专门的减排措施就无法履行净零排放义务,这些因素共同推动了碳捕集与封存(CCS)技术的扩张。各国政府正在收紧排放法规、扩大碳定价机制并增加税收优惠,这些价格讯号将推动CCS技术从试点阶段走向商业化部署。扶持性政策与技术成本下降的双重作用也吸引了大型石油公司和工业集团等私人资本的涌入,他们将CCS视为应对未来碳排放责任的有效手段。然而,对于水泥、钢铁、化工和炼油等产业而言,CCS的替代方案寥寥无几,使其成为一项结构性需求,而非过渡性选择。
全球碳捕获与储存(CCS)市场趋势与洞察
对二氧化碳驱油计划的新需求
由于提高采收率(EOR)技术能够创造双重收入来源,因此重新受到关注:既能延长成熟储存的产量,又能将捕获的碳变现。在早期应用阶段,大型石油公司正将枯竭的油田与化肥、钢铁和石化排放结合,将碳捕集点转化为获利资产。这种方法缩短了投资回收期,确保了固定客群,并加速了已拥有庞大管网地区的基础建设。此外,它还能提供处理大量二氧化碳的实务经验,随着EOR需求的逐渐下降,为过渡到纯粹的储存计划搭建桥樑。不断增长的石油产量所带来的收入可见性,有助于投资者证明分离和捕集装置以及注入井所需的高额初始资本的合理性,从而平稳过渡到独立的碳封存服务。
碳定价与排放权交易机制的扩大
碳市场如今已从总量管制与交易扩展到包括边境调节和行业征税,这改变了出口到受监管地区的製造商的经济考量。欧盟的碳边境调节机制对进口的排放密集型商品实施影子价格,迫使外国生产商投资碳捕获与封存(CCS)技术,以避免市场份额流失的风险。加州已将总量管制与交易延长至2030年,并收紧了排放分配,使CCS更多地成为一种规避合规成本的工具,而非企业社会责任策略。自愿碳市场正在日趋成熟,已检验储存吨位的二级货币化途径仍在形成,儘管关于额外性的问题仍然存在。所有这些政策工具都提高了减排的最低价格,缩小了减排成本与市场奖励之间的经济差距。
碳捕集与封存(CCS)工厂的资本支出和营运成本都很高。
工业规模的碳捕集设施通常需要5亿至8亿美元的前期投资,在政策不确定性较高的情况下,股权定序十分困难。即使是像Carbon Clean公司的CycloneCC这样将碳捕集成本降低至每吨30美元的创新溶剂系统,也尚未在商业规模上展现出规模经济效益。能源罚款进一步加重了营业成本,使工厂基准效率降低15%至30%,迫使营运商购买额外电力或接受更低的产量。在开发中国家,儘管减排需求庞大,但由于优惠融资管道有限,排放捕集技术的普及速度放缓。因此,资本密集技术延长了投资回收期,并将早期采用者限制在能够承担风险的大型企业和国有企业。
细分市场分析
燃烧前捕集技术预计在2024年将占据碳捕集与储存(CCS)市场82.19%的份额,该技术与炼油厂和化工厂中已广泛应用的蒸汽甲烷重整器和生物质气化炉相契合。该领域拥有数十年的运行数据积累,且在待开发区项目中安装成本较低,具有一定的优势。然而,此製程会带来20-25%的能源损耗,溶剂再生仍需大量资金投入。富氧燃烧燃烧技术预计到2030年将以18.51%的复合年增长率增长,这主要得益于像布雷维克水泥厂这样的计划,这些项目无需进行复杂的废气分离即可捕集製程废气。在纯氧中燃烧燃料可产生近乎纯净的二氧化碳废气流,从而简化下游压缩。技术供应商正在推出适用于维修的模组化富氧燃烧装置,而空气分离技术的改进使其在与燃烧后捕集方案的竞争中更具优势。由于重工业在寻求大幅削减成本的同时尽可能减少效率损失,预计富氧燃烧的市场份额将迅速扩大,对长期以来一直是碳捕获和储存(CCS) 市场领导者的燃烧前技术构成挑战。
区域分析
北美在碳捕获与储存(CCS)市场占据领先地位,预计2024年将占51.24%的市场份额。北美为直接空气捕获(DAC)提供每吨85美元的45Q税额扣抵,为点源捕获提供每吨60美元的税收抵免。美国墨西哥湾沿岸集中了众多排放、输油管和咸水层,这为埃克森美孚提案1000亿美元的休士顿航道网络等枢纽项目提供了支持。加拿大为该地区提供补充,对DAC设施提供60%的投资税额扣抵,对其他捕获系统提供50%的投资税收抵免,这促进了合资企业的建立,例如斯特拉斯科纳资源公司与加拿大增长基金之间价值20亿美元的伙伴关係。墨西哥正将自身定位为跨国运输合作伙伴,并探索在枯竭的近海油田中采用共用储存解决方案。
预计在2025年至2030年间,欧洲将以26.64%的复合年增长率成为全球成长最快的地区,这主要得益于创新基金、欧盟排放交易体系(EU ETS)以及挪威开创性的「长船」(Longship)计划。该计画于2025年在奥罗拉(Aurora)启动了二氧化碳注入。德国的碳捕获与封存(CCS)法案草案将解除陆上储存禁令,并释放北德盆地的潜力;荷兰正在推进波尔托斯(Porthos)枢纽项目,英国则在推广海内特(HyNet)和蒂赛德(Teeside)丛集。跨境运输协议日趋成熟,基础设施共用将降低小型工业排放的单位成本。碳定价、边境关税和专案公共津贴相结合,将刺激私人投资,确保欧洲缩小与北美先驱的差距。
从长远来看,亚太地区有望成为碳捕获与封存(CCS)技术的最大推动力,这主要得益于中国2060年实现碳中和的承诺,以及2025年首个富氧水泥示范试验的开展,该试验证明了这项技术适用于该地区的加工工业。日本正与澳洲合作开发一条液化二氧化碳运输路线,将重工业区与波拿巴盆地的海上储存连接起来。印尼计划在2030年建成15个CCS计划,充分利用其丰富的深海含水层资源。然而,该地区目前面临监管分散和融资管道不畅等问题,这可能会将CCS技术的全面推广推迟到2030年后。
其他福利:
- Excel格式的市场预测(ME)表
- 3个月的分析师支持
目录
第一章 引言
- 研究假设和市场定义
- 调查范围
第二章调查方法
第三章执行摘要
第四章 市场情势
- 市场概览
- 市场驱动因素
- 对二氧化碳驱油计划的新需求
- 扩大碳定价体系与排放交易体系
- 加强国家净零排放立法
- 扩大低碳合成燃料计划规模
- 直接空气捕获 (DAC) 系统建造需要储存空间
- 市场限制
- 碳捕集与封存(CCS)工厂的资本支出和营运成本都很高。
- 更便宜的可再生能源日益受到欢迎
- 民众反对陆上二氧化碳管道
- 价值链分析
- 波特五力模型
- 供应商的议价能力
- 买方的议价能力
- 新进入者的威胁
- 替代品的威胁
- 竞争程度
第五章 市场规模与成长预测
- 透过技术
- 初步燃烧
- 燃烧后回收
- 富氧燃料捕集
- 按最终用户行业划分
- 石油和天然气
- 煤电和生质能发电厂
- 钢
- 水泥
- 化学品
- 按地区
- 亚太地区
- 中国
- 印度
- 日本
- 澳洲
- 韩国
- 亚太其他地区
- 北美洲
- 美国
- 加拿大
- 墨西哥
- 欧洲
- 德国
- 英国
- 法国
- 挪威
- 荷兰
- 俄罗斯
- 其他欧洲地区
- 南美洲
- 巴西
- 阿根廷
- 其他南美洲国家
- 中东和非洲
- 沙乌地阿拉伯
- 南非
- 其他中东和非洲地区
- 亚太地区
第六章 竞争情势
- 市场集中度
- 策略趋势
- 市占率(%)/排名分析
- 公司简介
- Air Liquide
- Aker Solutions
- Baker Hughes
- Carbon Clean
- CF Industries Holdings, Inc.
- Climeworks
- Dakota Gasification Company
- ENEOS Xplora Inc.
- Equinor ASA
- Exxon Mobil Corporation
- Fluor Corporation
- General Electric Company
- Halliburton
- Honeywell International LLC
- Linde plc
- MITSUBISHI HEAVY INDUSTRIES, LTD.
- Occidental Petroleum Corporation
- Shell plc
- Siemens Energy
- SLB Capturi
- Svante Technologies Inc
- TotalEnergies
第七章 市场机会与未来展望
The Carbon Capture And Storage Market size is estimated at USD 2.76 billion in 2025, and is expected to reach USD 5.37 billion by 2030, at a CAGR of 14.21% during the forecast period (2025-2030).
Rising regulatory pressure, maturing capture technologies, and the recognition that heavy industries cannot meet net-zero obligations without dedicated abatement solutions underpin this expansion. Governments are tightening emissions caps, expanding carbon-pricing schemes, and raising tax incentives, creating a price signal that has shifted CCS from pilot-scale experiments to commercial deployment. The convergence of supportive policy and technology cost decline also attracts private capital from oil majors and industrial conglomerates that see CCS as a hedge against future carbon liability. Competition from renewable power does temper the outlook, yet sectors such as cement, steel, chemicals, and refineries have few practical alternatives, making CCS a structural requirement rather than a transitional option.
Global Carbon Capture And Storage Market Trends and Insights
Emerging Demand for CO2-EOR Projects
Enhanced oil recovery is regaining prominence because it creates dual revenue streams-monetizing captured carbon while extending production from mature reservoirs. Oil majors are pairing fertiliser, steel, and petrochemical emitters with depleted fields, turning capture hubs into profit-generating assets during the early adoption stage. The approach lowers payback periods, secures anchor customers, and accelerates infrastructure build-out in regions that already possess extensive pipeline networks. It also provides practical experience in handling large CO2 volumes, establishing a bridge to pure storage projects as EOR demand tails off over time. Revenue visibility from incremental barrels helps investors justify the high upfront capital required for capture plants and injection wells, smoothing the transition toward stand-alone sequestration services.
Expansion of Carbon-Pricing and ETS Schemes
Carbon markets now extend beyond cap-and-trade to include border adjustments and sector-specific levies, changing the economic calculus for manufacturers that export into regulated regions. The EU's Carbon Border Adjustment Mechanism applies a shadow price to imported emissions-intensive goods, forcing foreign producers to invest in CCS or risk losing market share. California extended its cap-and-trade through 2030 and tightened allowance allocations, making CCS a compliance cost-avoidance tool rather than a corporate social responsibility add-on. Voluntary carbon markets are maturing, and though questions around additionality persist, they still create secondary monetization routes for verified storage tonnes. Each of these policy levers lifts the floor price for abatement, narrowing the economic gap between capture costs and market incentives.
High CAPEX and OPEX of CCS Plants
Industrial-scale facilities routinely require USD 500 million-800 million in upfront investment, making equity financing challenging where policy certainty is weak. Even innovative solvent systems such as Carbon Clean's CycloneCC, which lowers capture cost to USD 30 per tonne, have yet to demonstrate economies of scale at commercial rates . Operating cost is further burdened by energy penalties that trim baseline plant efficiency 15-30%, forcing operators either to buy additional electricity or accept lower output. Access to concessional finance remains limited in developing economies, delaying uptake despite substantial emissions reduction needs. Capital intensity therefore prolongs payback periods and narrows the pool of early adopters to large corporations or state-owned enterprises capable of absorbing risk.
Other drivers and restraints analyzed in the detailed report include:
- Stricter National Net-Zero Legislation
- Scale-Up of Low-Carbon Synthetic-Fuel Projects
- Growing Attractiveness of Cheaper Renewables
For complete list of drivers and restraints, kindly check the Table Of Contents.
Segment Analysis
Pre-combustion capture accounted for 82.19% of carbon capture and storage market share in 2024 because it dovetails with steam-methane reformers and biomass gasifiers already common in refineries and chemical complexes . The segment benefits from decades of operational data and lower incremental cost when installed during greenfield builds. However, the process imposes a 20-25% energy penalty, and solvent regeneration remains capital intensive. Oxy-fuel combustion is projected to grow 18.51% CAGR to 2030, propelled by projects such as the Brevik cement plant that capture process emissions without extensive flue-gas separation. By burning fuel in pure oxygen, the exhaust stream is nearly pure CO2, simplifying downstream compression. Technology providers are introducing modular oxy-fuel units suited for retrofit, and improved air-separation economics reinforce competitiveness against post-combustion alternatives. As heavy industries seek deep cuts with minimal efficiency loss, oxy-fuel's market share is expected to expand quickly, challenging pre-combustion's long-held lead in the carbon capture and storage market.
The Carbon Capture and Storage Market Report is Segmented by Technology (Pre-Combustion Capture, Post-Combustion Capture, and Oxy-Fuel Combustion Capture), End-User Industry (Oil and Gas, Coal and Biomass Power Plant, Iron and Steel, Cement, and Chemical), and Geography (Asia-Pacific, North America, Europe, South America, and Middle-East and Africa). The Market Forecasts are Provided in Terms of Value (USD).
Geography Analysis
North America led with 51.24% carbon capture and storage market share in 2024, supported by generous 45Q tax credits that provide USD 85 per tonne for direct air capture and USD 60 for point-source capture. The U.S. Gulf Coast concentrates emitters, pipeline corridors, and saline aquifers, enabling hub concepts like ExxonMobil's proposed USD 100 billion Houston Ship Channel network. Canada complements the region with an investment tax credit of 60% for DAC equipment and 50% for other capture systems, spurring joint ventures such as Strathcona Resources and Canada Growth Fund's USD 2 billion partnership. Mexico positions itself as a cross-border transport partner, exploring shared storage solutions in depleted offshore fields.
Europe is projected to post the fastest CAGR at 26.64% between 2025-2030, underpinned by the Innovation Fund, the EU ETS, and Norway's pioneering Longship project, which began CO2 injection at Northern Lights in 2025. Germany's draft CCS law removes the onshore storage ban and unlocks the North German Basin, while the Netherlands advances the Porthos hub and the UK pushes HyNet and Teesside clusters. Cross-border transport agreements are maturing, and shared infrastructure lowers unit costs for smaller industrial emitters. The combination of carbon pricing, border tariffs, and dedicated public grants accelerates private investment, ensuring that Europe closes the gap with early-moving North America.
Asia-Pacific represents the largest long-term upside, driven by China's 2060 neutrality pledge and the first oxy-fuel cement demonstration in 2025, which validated technology fit for regional process industries. Japan is co-developing shipping routes with Australia for liquefied CO2, linking heavy industrial zones with offshore storage in the Bonaparte Basin . Indonesia targets 15 CCS projects by 2030, leveraging abundant deep-saline aquifers, while South Korea's Green New Deal earmarks CCS expenditure across steel and petrochemicals. The region, however, grapples with fragmented regulations and access to affordable finance, factors that may delay full-scale take-off until post-2030.
- Air Liquide
- Aker Solutions
- Baker Hughes
- Carbon Clean
- CF Industries Holdings, Inc.
- Climeworks
- Dakota Gasification Company
- ENEOS Xplora Inc.
- Equinor ASA
- Exxon Mobil Corporation
- Fluor Corporation
- General Electric Company
- Halliburton
- Honeywell International LLC
- Linde plc
- MITSUBISHI HEAVY INDUSTRIES, LTD.
- Occidental Petroleum Corporation
- Shell plc
- Siemens Energy
- SLB Capturi
- Svante Technologies Inc
- TotalEnergies
Additional Benefits:
- The market estimate (ME) sheet in Excel format
- 3 months of analyst support
TABLE OF CONTENTS
1 Introduction
- 1.1 Study Assumptions and Market Definition
- 1.2 Scope of the Study
2 Research Methodology
3 Executive Summary
4 Market Landscape
- 4.1 Market Overview
- 4.2 Market Drivers
- 4.2.1 Emerging Demand for CO2-EOR Projects
- 4.2.2 Expansion of Carbon-Pricing and ETS Schemes
- 4.2.3 Stricter National Net-Zero Legislation
- 4.2.4 Scale-Up of Low-Carbon Synthetic-Fuel Projects
- 4.2.5 Direct-Air-Capture (DAC) Build-Outs Needing Storage
- 4.3 Market Restraints
- 4.3.1 High CAPEX And OPEX Of CCS Plants
- 4.3.2 Growing Attractiveness of Cheaper Renewables
- 4.3.3 Public Opposition to On-Shore CO2 Pipelines
- 4.4 Value Chain Analysis
- 4.5 Porter's Five Forces
- 4.5.1 Bargaining Power of Suppliers
- 4.5.2 Bargaining Power of Buyers
- 4.5.3 Threat of New Entrants
- 4.5.4 Threat of Substitutes
- 4.5.5 Degree of Competition
5 Market Size and Growth Forecasts (Value)
- 5.1 By Technology
- 5.1.1 Pre-combustion Capture
- 5.1.2 Post-combustion Capture
- 5.1.3 Oxy-fuel Combustion Capture
- 5.2 By End-user Industry
- 5.2.1 Oil and Gas
- 5.2.2 Coal and Biomass Power Plant
- 5.2.3 Iron and Steel
- 5.2.4 Cement
- 5.2.5 Chemical
- 5.3 By Geography
- 5.3.1 Asia-Pacific
- 5.3.1.1 China
- 5.3.1.2 India
- 5.3.1.3 Japan
- 5.3.1.4 Australia
- 5.3.1.5 South Korea
- 5.3.1.6 Rest of Asia-Pacific
- 5.3.2 North America
- 5.3.2.1 United States
- 5.3.2.2 Canada
- 5.3.2.3 Mexico
- 5.3.3 Europe
- 5.3.3.1 Germany
- 5.3.3.2 United Kingdom
- 5.3.3.3 France
- 5.3.3.4 Norway
- 5.3.3.5 Netherlands
- 5.3.3.6 Russia
- 5.3.3.7 Rest of Europe
- 5.3.4 South America
- 5.3.4.1 Brazil
- 5.3.4.2 Argentina
- 5.3.4.3 Rest of South America
- 5.3.5 Middle-East and Africa
- 5.3.5.1 Saudi Arabia
- 5.3.5.2 South Africa
- 5.3.5.3 Rest of Middle-East and Africa
- 5.3.1 Asia-Pacific
6 Competitive Landscape
- 6.1 Market Concentration
- 6.2 Strategic Moves
- 6.3 Market Share(%)/Ranking Analysis
- 6.4 Company Profiles (includes Global level Overview, Market level overview, Core Segments, Financials as available, Strategic Information, Market Rank/Share for key companies, Products and Services, and Recent Developments)
- 6.4.1 Air Liquide
- 6.4.2 Aker Solutions
- 6.4.3 Baker Hughes
- 6.4.4 Carbon Clean
- 6.4.5 CF Industries Holdings, Inc.
- 6.4.6 Climeworks
- 6.4.7 Dakota Gasification Company
- 6.4.8 ENEOS Xplora Inc.
- 6.4.9 Equinor ASA
- 6.4.10 Exxon Mobil Corporation
- 6.4.11 Fluor Corporation
- 6.4.12 General Electric Company
- 6.4.13 Halliburton
- 6.4.14 Honeywell International LLC
- 6.4.15 Linde plc
- 6.4.16 MITSUBISHI HEAVY INDUSTRIES, LTD.
- 6.4.17 Occidental Petroleum Corporation
- 6.4.18 Shell plc
- 6.4.19 Siemens Energy
- 6.4.20 SLB Capturi
- 6.4.21 Svante Technologies Inc
- 6.4.22 TotalEnergies
7 Market Opportunities and Future Outlook
- 7.1 White-space and unmet-need assessment
 2026年全球发电二氧化碳捕集与储存市场报告
 2026-2030年全球碳捕获与储存(CCS)市场2026年全球二氧化碳捕集与封存技术市场报告2026年全球二氧化碳捕集与储存市场报告2026年全球二氧化碳捕集与封存(CCS)市场报告
 2026-2034年全球发电领域二氧化碳捕集与储存(CCS)市场规模、份额、趋势及成长分析报告
 全球工业脱碳技术市场预测(至2034年):按类型、组件、资金来源、部署模式、应用、最终用户和地区划分
 日本二氧化碳捕集与储存(CCS)市场:规模、份额、趋势和预测:按服务、技术、最终用途行业和地区划分,2026-2034年捕碳封存(CCS)市场预测至2032年:按服务类型、储存类型、技术、应用、最终用户和地区分類的全球分析
 全球发电捕碳封存市场