


 |
市场调查报告书
商品编码
1851824
整合工作场所管理系统 (IWMS):市场份额分析、行业趋势、统计数据和成长预测 (2025-2030)Integrated Workplace Management System (IWMS) - Market Share Analysis, Industry Trends & Statistics, Growth Forecasts (2025 - 2030) |
||||||
※ 本网页内容可能与最新版本有所差异。详细情况请与我们联繫。
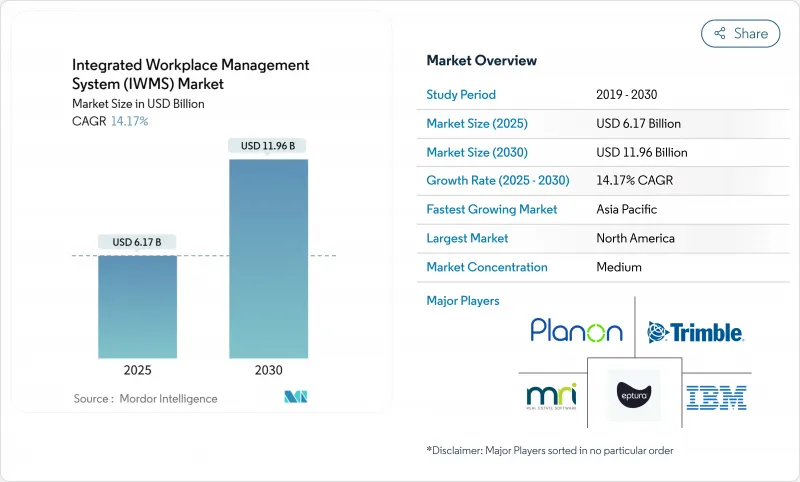
预计到 2025 年,整合工作场所管理系统市场规模将达到 61.7 亿美元,到 2030 年将达到 119.6 亿美元,复合年增长率为 14.17%。
这种加速发展反映出企业正在用单一平台取代分散的设施管理工具,该平台集中管理房地产、维护和永续性数据。由于远距办公和混合办公模式的普及、ESG监管力度的加强以及对即时营运可视性的追求,市场需求只会不断增长。云端技术的采用缩短了引进週期,订阅定价模式降低了中型企业的进入门槛。供应商正在利用人工智慧技术实现空间规划的自动化,而监管机构则在收紧能源报告规则,使合规性成为推动整合平台发展的动力。网路安全和资料主权仍然是重中之重,因此需要建立兼顾控制和扩充性的混合架构。
全球整合工作场所管理系统 (IWMS) 市场趋势与洞察
采用云端优先的整合工作管理系统
如今,企业需要云端原生平台来降低基础设施支出,并在数週而非数月内完成部署。 SAP 报告称,2025 年第一季云端营收达 49.93 亿欧元,其中云端 ERP 营收年增 34%,印证了买家对订阅交付模式的信心。与现有的人力资源和财务系统集成,可提高数据品质并加快决策速度。基于使用量的定价模式扩大了中型企业的使用范围,这些企业过去一直觉得功能齐全的套件难以负担。供应商也不断推出更新,在不造成客户停机的情况下提供新的分析功能。
透过空间优化节省成本
商业设施的营运成本有时甚至超过总营运成本的20%,因此,能够减少閒置占地面积的运作分析工具正迅速普及。思科透过感测器主导的布局重新设计,将PENN1设施的占地面积减少了25%,能源效率提高了36%。整合工作管理系统(IWMS)的仪錶板提供即时利用率视觉化,从而能够及时做出关于整合和转租的决策。在混合办公环境中,动态座位分配取代了静态的办公桌配比,即使出勤率波动,也能维持较低的座位可用率。
IWMS领域专家短缺
如果团队中缺乏既了解设施工作流程又了解企业软体整合的专家,计划就会停滞不前。同行评审的针对中小企业ERP实施的研究表明,熟练人才是成功的关键因素,这反映了整合工作管理系统(IWMS)面临的挑战。尤其是在设施管理仍以人工为主的新兴市场,人才短缺会推高咨询成本并延长实施时间。此外,由于监管或语言原因需要本地协助的采购方,本地支援的不足也会造成阻碍。
细分市场分析
到2024年,设施和空间管理市场规模将达到17亿美元,占整合工作场所管理系统市场规模的27.60%。企业将率先采用这些模组,透过减少空置率和能源浪费来实现实际的成本节约。由于国际财务报告准则第16号(IFRS 16)的合规期限临近,物业和租赁管理也将紧随其后。环境永续性管理虽然市场规模较小,但将引领成长,到2030年复合年增长率将达到15.90%。其强劲的成长势头表明,碳计量如今对董事会决策的影响与财务会计不相上下。
到2024年,专业服务收入将超过13.5亿美元,反映出企业内部专业人才的缺乏。供应商提供配置、资料迁移和培训服务,帮助客户实现预期的投资回报。託管服务吸引了那些倾向于将营运完全外包的中型企业,从而降低了薪资和人员配置风险。例如,麦克拉伦医疗保健公司(McLaren Health Care)在采用Brightly Origin平台后,其设施资金增加了25%,案例研究充分证明了由专业合作伙伴经营该平台所带来的益处。
到2024年,本地部署系统将占据整合工作场所管理系统市场份额的51.44%。受严格监管的行业正在建立分层架构,透过将敏感资料置于防火墙后并在此基础上整合云端分析,最大限度地降低资讯外洩的风险。大型企业也充分利用现有伺服器容量,而不是急于从沉没投资中寻求早期回报。
然而,云端订阅的成长速度最快,复合年增长率高达 17.40%。新加坡生产力解决方案公司等政府提供的补贴正推动中小企业转向云端模式,从而免去硬体采购的麻烦。供应商每月发布功能更新,让客户无需计划即可享受创新功能。将云端入口网站与本地资料湖结合的混合部署,既能让企业拥有精细的控制权,也能受益于人工智慧工作负载的弹性处理能力。
IWMS 市场报告按提供的服务(解决方案、服务)、部署类型(云端、本地、混合)、组织规模(大型企业、中小企业)、最终用户垂直行业(资讯科技和通讯、银行、金融服务和保险、医疗保健和生命科学、製造业、零售和电子商务、其他)以及地区对产业进行细分。
区域分析
预计到2024年,北美地区的营收将达到20.9亿美元,占全球营收的33.76%。先发优势、严格的美国证券交易委员会(SEC)资讯揭露规则以及成熟的供应商生态系统为该地区的支出提供了支撑。该地区的企业正在将人工智慧技术应用于历史建筑讯息,以预测运转率、预防设备故障并维持高营运指标。
欧洲的能源转型投资金额达到17.8亿美元,成长主要得益于气候变迁法规的不断完善,例如《企业永续发展报告指令》。设施管理团队正在将能源计量表和碳排放仪錶板整合到综合废弃物管理系统(IWMS)中,以便为监管机构和投资者产生永续性审核要求的报告。净零排放蓝图正在加速德国、荷兰和北欧地区的维修。
亚太地区贡献了14.9亿美元的收入,预计将以15.70%的复合年增长率成为成长最快的地区。快速的都市化要求高效利用空间,而建筑业的人才短缺则推动了自动化发展。日本开发人员正在其专案中部署低功耗广域网路(LPWA)感测器网络,而新加坡则在资助智慧设施课程以弥补技能差距。印度和印尼正在采用云端套件来完全绕过旧有系统,而中东的计划则将整合废弃物管理系统(IWMS)与区域冷却和太阳能发电设施连接起来,以应对极端气候。
其他福利:
- Excel格式的市场预测(ME)表
- 3个月的分析师支持
目录
第一章 引言
- 研究假设和市场定义
- 调查范围
第二章调查方法
第三章执行摘要
第四章 市场情势
- 市场概览
- 市场驱动因素
- 采用云端优先的整合工作管理系统
- 透过空间优化节省成本
- 回应 IFRS 16 和 ESG 义务
- 疫情后混合办公模式
- CPIP转向整合OT-IT-IoT数据
- 为职场中的碳信用交易做好准备
- 市场限制
- 综合废弃物管理系统领域专家短缺
- 高昂的转换成本
- 物联网遥测的资料主权限制
- 「影子IT」资料品质不一致
- 关键法规结构评估
- 价值链分析
- 技术展望
- 波特五力模型
- 供应商的议价能力
- 买方的议价能力
- 新进入者的威胁
- 替代品的威胁
- 竞争对手之间的竞争
- 关键相关人员影响评估
- 主要用例和案例研究
- 宏观经济因素对市场的影响
- 投资分析
第五章 市场区隔
- 报价
- 解决方案
- 物业及租赁管理
- 设施和空间管理
- 资产和维护管理
- 计划管理
- 环境永续管理
- 整合工作场所分析
- 其他解决方案
- 服务
- 专业服务
- 託管服务
- 解决方案
- 透过部署模式
- 云
- 本地部署
- 杂交种
- 按组织规模
- 大公司
- 小型企业
- 按最终用途行业划分
- 资讯科技与通讯
- 银行、金融服务和保险
- 医疗保健和生命科学
- 製造业
- 零售与电子商务
- 政府/公共部门
- 教育
- 其他行业
- 按地区
- 北美洲
- 美国
- 加拿大
- 墨西哥
- 南美洲
- 巴西
- 阿根廷
- 其他南美洲
- 欧洲
- 英国
- 德国
- 法国
- 义大利
- 西班牙
- 北欧国家
- 其他欧洲地区
- 中东和非洲
- 中东
- 沙乌地阿拉伯
- 阿拉伯聯合大公国
- 土耳其
- 其他中东地区
- 非洲
- 南非
- 埃及
- 奈及利亚
- 其他非洲地区
- 亚太地区
- 中国
- 印度
- 日本
- 韩国
- ASEAN
- 澳洲
- 纽西兰
- 亚太其他地区
- 北美洲
第六章 竞争情势
- 市场集中度
- 策略趋势
- 市占率分析
- 公司简介
- International Business Machines Corporation
- Planon Group BV
- MRI Software LLC
- Trimble Inc.
- Eptura Inc.
- Accruent LLC
- FM:Systems(Johnson Controls International plc)
- SAP SE
- Oracle Corporation
- ServiceNow, Inc.
- Nuvolo, Inc.
- Spacewell International NV
- Tango Analytics LLC
- iOFFICE, LP
- SpaceIQ, Inc.
- Archibus, Inc.
- Schneider Electric SE
- Causeway Technologies Limited
- AssetWorks, LLC
- OfficeSpace Software, Inc.
- Flairsoft Ltd.
第七章 市场机会与未来展望
The integrated workplace management system market was valued at USD 6.17 billion in 2025 and is forecast to reach USD 11.96 billion by 2030, advancing at a 14.17% CAGR.
The acceleration reflects enterprises replacing disconnected facility tools with single platforms that centralize real estate, maintenance, and sustainability data. Remote and hybrid work, heightened ESG scrutiny, and the push for real-time operational visibility keep demand elevated. Cloud availability shortens deployment cycles, and subscription pricing lowers entry barriers for mid-market buyers. Vendors add AI to automate space planning, while regulators tighten energy reporting rules, turning compliance into a driver for integrated platforms. Cybersecurity and data sovereignty remain priorities, prompting hybrid architectures that balance control with scalability.
Global Integrated Workplace Management System (IWMS) Market Trends and Insights
Cloud-First IWMS Adoption
Enterprises now mandate cloud-native platforms to cut infrastructure spending and deploy in weeks rather than months. SAP recorded EUR 4.993 billion cloud revenue in Q1 2025, with cloud ERP rising 34% year over year, underscoring buyer confidence in subscription delivery models. Integration with existing HR and finance systems improves data quality and speeds decision-making. Usage-based pricing broadens access for mid-sized firms that once found comprehensive suits unaffordable. Vendors also embed continuous updates that deliver new analytics features without customer downtime.
Cost-Out Through Space Optimization
Commercial property expenses can exceed 20% of operating costs, so occupancy analytics tools that reduce unused floorspace gain rapid traction. Cisco cut floor area by 25% at its PENN1 facility while improving energy efficiency by 36% through sensor-driven layout redesign. IWMS dashboards visualize real-time utilization, allowing timely consolidation or subletting decisions. In hybrid settings, dynamic seating assignments replace static desk ratios, keeping vacancies low even with variable attendance.
Shortage of IWMS Domain Expertise
Projects stall when teams lack professionals who understand both facility workflows and enterprise software integration. A peer-reviewed study on SME ERP rollouts cites skilled manpower as a critical success factor, mirroring IWMS challenges. Scarcity inflates consulting fees and elongates deployments, particularly in emerging economies where facility management remains manual. Limited local support also deters buyers that require on-site assistance for regulatory or language reasons.
Other drivers and restraints analyzed in the detailed report include:
- Compliance With IFRS 16 and ESG Mandates
- Post-Pandemic Hybrid Work Programs
- High Transformational Switching Costs
For complete list of drivers and restraints, kindly check the Table Of Contents.
Segment Analysis
Facilities and Space Management contributed USD 1.70 billion in 2024, equal to 27.60% of the integrated workplace management system market size. Firms adopt these modules first because they deliver visible savings by reducing vacancy and trimming energy waste. Real-estate and lease management follows closely as IFRS 16 compliance deadlines tighten. Environmental sustainability management, although smaller, leads growth at 15.90% CAGR to 2030. Its momentum underscores how carbon accounting now influences boardroom decisions as much as financial accounting.
Professional services revenue surpassed USD 1.35 billion in 2024, reflecting the scarcity of in-house expertise. Vendors provide configuration, data migration, and training, ensuring customers achieve intended return on investment. Managed services attract mid-market firms that prefer to outsource operations entirely, lowering payroll and retention risks. Case studies such as McLaren Health Care, which raised facilities funding by 25% after adopting Brightly Origin, illustrate the gains realized when expert partners run the platform.
On-premise installations commanded 51.44% of the integrated workplace management system market share in 2024. Highly regulated industries keep sensitive data within their firewalls and integrate cloud analytics on top, creating layered architectures that minimize breach exposure. Large enterprises also leverage existing server capacity instead of retiring sunk investments early.
Cloud subscriptions, however, register the quickest climb at 17.40% CAGR. Government grants such as Singapore's Productivity Solutions push SMEs toward cloud models that need no hardware outlay. Vendors issue feature updates monthly, letting clients consume innovations without upgrade projects. Hybrid deployment blends cloud portals with on-premise data lakes, giving organizations granular control while benefiting from elastic processing for AI workloads.
The IWMS Market Report Segments the Industry Into by Offering (Solutions, and Services), Deployment (Cloud, On-Premise, and Hybrid), Organization Size (Large Enterprise, and Small and Medium Enterprises), End-Use Industry (Information Technology and Telecommunications, Banking, Financial Services and Insurance, Healthcare and Life Sciences, Manufacturing, Retail and E-Commerce, and More), and Geography.
Geography Analysis
North America generated USD 2.09 billion in 2024, or 33.76% of global revenue. Early mover advantage, stringent SEC disclosure rules, and mature vendor ecosystems sustain spending. Enterprises there increasingly layer AI over historical building information to predict occupancy and pre-empt equipment failures, keeping operational metrics high.
Europe recorded USD 1.78 billion, with growth tied to expanded climate regulations such as the Corporate Sustainability Reporting Directive. Facilities teams integrate energy meters and carbon dashboards into IWMS to produce audit-ready reports for authorities and investors. Uptake is notable in Germany, the Netherlands, and the Nordics, where net-zero roadmaps accelerate retrofits.
Asia-Pacific contributed USD 1.49 billion yet will post the fastest 15.70% CAGR. Rapid urbanisation necessitates efficient space use, while talent shortages in building trades push automation. Japanese developers deploy LPWA sensor networks across portfolios, and Singapore sponsors smart facilities curricula to close skill gaps. India and Indonesia adopt cloud suites to bypass legacy systems altogether, and Middle East projects link IWMS with district cooling and photovoltaic assets to manage extreme climates.
- International Business Machines Corporation
- Planon Group B.V.
- MRI Software LLC
- Trimble Inc.
- Eptura Inc.
- Accruent LLC
- FM:Systems (Johnson Controls International plc)
- SAP SE
- Oracle Corporation
- ServiceNow, Inc.
- Nuvolo, Inc.
- Spacewell International NV
- Tango Analytics LLC
- iOFFICE, LP
- SpaceIQ, Inc.
- Archibus, Inc.
- Schneider Electric SE
- Causeway Technologies Limited
- AssetWorks, LLC
- OfficeSpace Software, Inc.
- Flairsoft Ltd.
Additional Benefits:
- The market estimate (ME) sheet in Excel format
- 3 months of analyst support
TABLE OF CONTENTS
1 INTRODUCTION
- 1.1 Study Assumptions and Market Definition
- 1.2 Scope of the Study
2 RESEARCH METHODOLOGY
3 EXECUTIVE SUMMARY
4 MARKET LANDSCAPE
- 4.1 Market Overview
- 4.2 Market Drivers
- 4.2.1 Cloud-first IWMS adoption
- 4.2.2 Cost-out through space optimization
- 4.2.3 Compliance with IFRS 16 and ESG mandates
- 4.2.4 Post-pandemic hybrid-work programs
- 4.2.5 CPIP shift to unify OT-IT-IoT data
- 4.2.6 Workplace carbon-credit trading readiness
- 4.3 Market Restraints
- 4.3.1 Shortage of IWMS domain expertise
- 4.3.2 High transformational switching costs
- 4.3.3 Data-sovereignty limits for IoT telemetry
- 4.3.4 "Shadow-IT" data-quality inconsistencies
- 4.4 Evaluation of Critical Regulatory Framework
- 4.5 Value Chain Analysis
- 4.6 Technological Outlook
- 4.7 Porter's Five Forces
- 4.7.1 Bargaining Power of Suppliers
- 4.7.2 Bargaining Power of Buyers
- 4.7.3 Threat of New Entrants
- 4.7.4 Threat of Substitutes
- 4.7.5 Competitive Rivalry
- 4.8 Impact Assessment of Key Stakeholders
- 4.9 Key Use Cases and Case Studies
- 4.10 Impact on Macroeconomic Factors of the Market
- 4.11 Investment Analysis
5 MARKET SEGMENTATION
- 5.1 By Offering
- 5.1.1 Solutions
- 5.1.1.1 Real Estate and Lease Management
- 5.1.1.2 Facilities and Space Management
- 5.1.1.3 Asset and Maintenance Management
- 5.1.1.4 Project Management
- 5.1.1.5 Environmental Sustainability Management
- 5.1.1.6 Integrated Workplace Analytics
- 5.1.1.7 Other Solutions
- 5.1.2 Services
- 5.1.2.1 Professional Services
- 5.1.2.2 Managed Services
- 5.1.1 Solutions
- 5.2 By Deployment Mode
- 5.2.1 Cloud
- 5.2.2 On-premise
- 5.2.3 Hybrid
- 5.3 By Organization Size
- 5.3.1 Large Enterprises
- 5.3.2 Small and Medium Enterprises
- 5.4 By End-use Industry
- 5.4.1 Information Technology and Telecommunications
- 5.4.2 Banking, Financial Services and Insurance
- 5.4.3 Healthcare and Life Sciences
- 5.4.4 Manufacturing
- 5.4.5 Retail and E-commerce
- 5.4.6 Government and Public Sector
- 5.4.7 Education
- 5.4.8 Other Industries
- 5.5 By Geography
- 5.5.1 North America
- 5.5.1.1 United States
- 5.5.1.2 Canada
- 5.5.1.3 Mexico
- 5.5.2 South America
- 5.5.2.1 Brazil
- 5.5.2.2 Argentina
- 5.5.2.3 Rest of South America
- 5.5.3 Europe
- 5.5.3.1 United Kingdom
- 5.5.3.2 Germany
- 5.5.3.3 France
- 5.5.3.4 Italy
- 5.5.3.5 Spain
- 5.5.3.6 Nordics
- 5.5.3.7 Rest of Europe
- 5.5.4 Middle East and Africa
- 5.5.4.1 Middle East
- 5.5.4.1.1 Saudi Arabia
- 5.5.4.1.2 United Arab Emirates
- 5.5.4.1.3 Turkey
- 5.5.4.1.4 Rest of Middle East
- 5.5.4.2 Africa
- 5.5.4.2.1 South Africa
- 5.5.4.2.2 Egypt
- 5.5.4.2.3 Nigeria
- 5.5.4.2.4 Rest of Africa
- 5.5.5 Asia-Pacific
- 5.5.5.1 China
- 5.5.5.2 India
- 5.5.5.3 Japan
- 5.5.5.4 South Korea
- 5.5.5.5 ASEAN
- 5.5.5.6 Australia
- 5.5.5.7 New Zealand
- 5.5.5.8 Rest of Asia-Pacific
- 5.5.1 North America
6 COMPETITIVE LANDSCAPE
- 6.1 Market Concentration
- 6.2 Strategic Moves
- 6.3 Market Share Analysis
- 6.4 Company Profiles (includes Global level Overview, Market level overview, Core Segments, Financials as available, Strategic Information, Market Rank/Share for key companies, Products and Services, and Recent Developments)
- 6.4.1 International Business Machines Corporation
- 6.4.2 Planon Group B.V.
- 6.4.3 MRI Software LLC
- 6.4.4 Trimble Inc.
- 6.4.5 Eptura Inc.
- 6.4.6 Accruent LLC
- 6.4.7 FM:Systems (Johnson Controls International plc)
- 6.4.8 SAP SE
- 6.4.9 Oracle Corporation
- 6.4.10 ServiceNow, Inc.
- 6.4.11 Nuvolo, Inc.
- 6.4.12 Spacewell International NV
- 6.4.13 Tango Analytics LLC
- 6.4.14 iOFFICE, LP
- 6.4.15 SpaceIQ, Inc.
- 6.4.16 Archibus, Inc.
- 6.4.17 Schneider Electric SE
- 6.4.18 Causeway Technologies Limited
- 6.4.19 AssetWorks, LLC
- 6.4.20 OfficeSpace Software, Inc.
- 6.4.21 Flairsoft Ltd.
7 MARKET OPPORTUNITIES AND FUTURE OUTLOOK
- 7.1 White-space and Unmet-need Assessment
 整合工作场所管理系统市场:按组件、属性类型、部署模式、组织规模、最终用户和行业划分-2026-2032年全球市场预测
 2026年全球职场人工智慧(AI)市场报告
 融合工作站市场分析及预测(至2035年):依类型、产品类型、服务、技术、组件、应用、部署类型、最终用户及功能划分
 全球整合工作场所管理系统(IWMS)市场规模、份额、趋势和成长分析报告(2026-2034年)
 整合工作场所管理系统市场规模、份额和成长分析(按产品类型、部署类型、企业规模、最终用途和地区划分)-2026-2033年产业预测
 2032 年神经包容性穿戴装置市场预测:按装置类型、整合模式、技术、应用、最终用户和地区进行的全球分析2032 年神经包容性职场市场预测:按产品、软体类型、神经多样性人群、就业生命週期阶段、组织规模、最终用户和地区进行的全球分析
 整合职场管理系统市场报告:2030 年趋势、预测与竞争分析