


 |
市场调查报告书
商品编码
1851857
太阳能汽车:市场份额分析、行业趋势、统计数据和成长预测(2025-2030 年)Solar Vehicle - Market Share Analysis, Industry Trends & Statistics, Growth Forecasts (2025 - 2030) |
||||||
※ 本网页内容可能与最新版本有所差异。详细情况请与我们联繫。
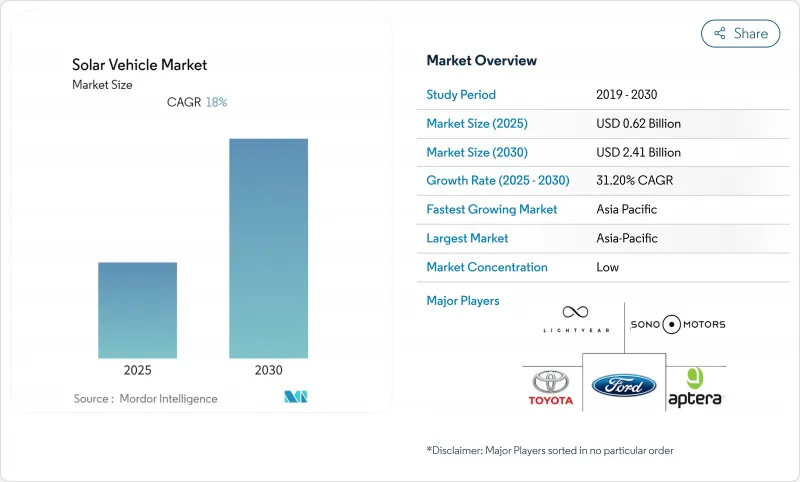
太阳能汽车市场预计在 2025 年创造 6.2 亿美元的产值,并在 2030 年达到 24.1 亿美元。
光电发电成本已大幅下降,目前在主要电动车市场已低于电网电价,使得车载太阳能係统在经济上可行,再加上新兴的固态电池,更是如此。欧盟的「Fit-For-55」计画和加州的「先进清洁卡车」法规等零排放车辆强制令,正使早期采用者受益,并为原始设备製造商(OEM)提供稳定的订单来源。随着传统汽车製造商加快推进太阳能车顶计划,而专业製造商则不断改进轻量化底盘以最大限度地增加光伏面板的安装面积,市场竞争日益激烈。此外,双向Vehicle-to-Grid模式的需求也在不断增长,这种模式可以在用电高峰期将汽车和卡车转变为行动电源。
全球太阳能汽车市场趋势与洞察
在主要电动车市场,太阳能平准化度电成本低于电网电力成本
在电动车普及的关键地区,太阳能发电的平准化成本正逐渐接近市电平价,从根本上改变了车载太阳能发电系统的经济效益。弗劳恩霍夫太阳能係统研究所 (Fraunhofer ISE) 2024 年的一项分析显示,加州、德国和中国东部的太阳能+储能係统目前的供电成本比传统电网电价低 20% 至 30%。这项成本优势为太阳能汽车车主带来了极具吸引力的价值提案,他们既可以实现能源独立,又能降低营运成本。随着全球公用事业规模的太阳能发电装置容量在 2025 年达到 1.8兆瓦,这一趋势将加速发展,规模经济效应将进一步降低成本。拥有大面积车顶的商用车辆可以产生足够的电力来抵消其大部分能源消耗,使车队营运商能够从中受益。这种经济优势在电费高、太阳辐射充足的地区最为显着,这些地区也因此成为太阳能汽车普及的热点。
政府零排放车队强制令推动商业性应用
主要汽车市场的法规结构正日益强制要求在商用车队中引入零排放车辆,从而催生了对太阳能增强电动车的可预见需求。欧盟的「Fit For 55」计画规定,到2025年,30%的新城市公车必须为零排放车辆,到2030年这一比例将提高到65%。加州的「先进清洁卡车」法规规定,到2030年,40%的卡车销售必须为零排放车辆。这些法规尤其有利于商用太阳能车,因为更长的续航里程和对充电基础设施更少的依赖性能够带来营运优势。车队营运商认识到,在最佳条件下,整合式太阳能可以将车辆的续航里程延长20-30%,从而减少充电频率并提高路线灵活性。监管的推动力为开发太阳能商用车的製造商提供了先发优势,因为飞机采购週期通常为五到七年,而儘早合规有利于签订长期合约。政府透过税额扣抵和加速零排放商用车折旧计画等奖励,降低了零排放商用车的总拥有成本,进一步推动了零排放商用车的普及。
光电整合车身面板的高昂初始投资成本
车载整合式太阳能发电系统的製造成本仍远高于传统汽车零件,这构成了限制其大众市场普及的价格障碍。专为汽车设计的专用太阳能电池需要客製化的製造工艺,无法像固定式太阳能发电设备那样实现规模经济,导致其每瓦成本比标准太阳能组件高出三到四倍。整合的复杂性不仅限于太阳能电池本身,还包括专用线束、电源管理电子设备以及为容纳太阳能组件而进行的结构改造,同时还要满足碰撞安全标准。 Opes Solar Mobility公司位于德国的新工厂计划于2024年投产,旨在实现车载太阳能组件的规模化生产。然而,与传统汽车零件相比,其生产成本仍然很高。对于大众市场汽车而言,成本溢价尤其具有挑战性,因为价格敏感的製造商难以承受额外的零件成本。不过,光伏电池材料成本的下降和产量的增加表明,随着市场的成熟和规模的扩大,成本障碍将会降低。
细分市场分析
到2024年,乘用车将占据太阳能汽车市场98.78%的份额,而商用车将呈现最快的成长轨迹,2025年至2030年的复合年增长率将达到55.39%。卡车、巴士和送货车辆的大面积车顶允许安装更大的太阳能发电装置,预计这将对能源消耗做出更显着的贡献。同时,可预测的行车路线模式也使车队营运商能够优化其太阳能充电策略。乘用车将受益于高端定位和能源自主品牌,尤其是在豪华车领域,消费者更重视环保差异化而非单纯的经济回报。
商用车的发展动能得益于车队营运商对优化总拥有成本和遵守零排放规定的重视。 Flixbus 在其城际巴士上部署太阳能电池板,显示私人营运商正在利用太阳能技术降低燃料成本并延长远距线路的续航里程。集中维护能力和专业驾驶员也为车队应用带来益处,他们可以透过路线规划和停车策略来优化太阳能充电。商用车领域的成长轨迹表明,车队应用将推动生产规模的扩大和成本的降低,最终惠及乘用车应用。
到2024年,混合动力汽车将占据太阳能汽车市场99.38%的份额,因为製造商将太阳能係统整合到现有的混合动力平台中,以最大限度地降低开发复杂性和监管风险。然而,随着固体电池技术能够更有效率地储存和利用太阳能,纯电动车的年复合成长率将达到60.83%(2025-2030年)。丰田计划在四年内推出的固态电池蓝图预计将纯电动车的续航里程提高一倍,同时降低20-40%的成本,从而为太阳能整合创造一个极具吸引力的平台。插电式混合动力车则占据了中间位置,既具备太阳能充电功能,又能为从传统动力传动系统过渡的消费者提供灵活性。
向纯电动车的转变反映了这样一个事实:储能效率的提高和电池成本的下降使得纯电动动力传动系统在太阳能应用中更具可行性。 Stellantis与CEA在下一代电池技术方面的伙伴关係,展现了製造商如何致力于开发能够优化太阳能利用的先进化学解决方案。不断扩展的充电基础设施也将促进这一转变,从而缓解里程焦虑,并使太阳能汽车能够作为电网充电的补充而非替代。随着电池能量密度的提高和成本的下降,动力传动系统得以简化,能源管理系统也得到最佳化,这使得纯电动车平台对太阳能整合越来越有吸引力。
区域分析
到2024年,亚太地区将占据太阳能汽车市场最大份额,达到56.79%。这主要得益于中国光伏组件90%的全球产量以及日本在高效能电池研发的强大实力。中国的「中国製造2025」计画和日本新能源产业技术综合开发机构(NEDO)的补贴等政府项目,提升了本地零件采购优势,降低了材料成本。比亚迪跨境日本市场的倡议,显示中国有意将其製造业规模经济效益拓展至高端出口市场。丰田和夏普正在联合开发串联电池,以保持国内竞争力。
北美是成长速度第二快的地区,这主要得益于加州的零排放政策以及《控制通货膨胀法案》对国产太阳能产品的生产税减免。皮卡和SUV在该地区占据主导地位,为光伏阵列提供了大量的车顶空间。 Rivian正在其位于伊利诺州的工厂试点一项社区太阳能项目,将多余的电力输送到充电桩,展现了工厂到车队循环利用的潜力。
在欧洲,各国奖励五花八门,并由欧盟统一的「Fit-For-55」目标提供支持。儘管欧盟层级的监管具有确定性,但增值税豁免和基础设施密度各不相同,导致需求模式差异显着。 Lightyear在获得2024年1000万欧元的投资后,转型供应嵌入式光伏套件,这表明欧洲对整车生产的资本密集型模式以及模组化供应链的作用持开放态度。 Opes Solar Mobility在德国的工厂在一定程度上缓解了欧盟对亚洲组件製造商的依赖,支持了整车製造商的本地化战略,从而降低了对地缘政治进口的依赖。
其他福利:
- Excel格式的市场预测(ME)表
- 3个月的分析师支持
目录
第一章 引言
- 研究假设和市场定义
- 调查范围
第二章调查方法
第三章执行摘要
第四章 市场情势
- 市场概览
- 市场驱动因素
- 在主要电动车市场,太阳能光电发电的平准化电成本低于电网供电成本。
- 政府对零排放车辆的强制规定(例如,欧盟Fit-For-55标准、加州ACT标准)
- 面向车队所有者的新型双向V2G收入模式(报告不足)
- 整合式光伏面板可提高电池到车轮的效率
- 高端OEM品牌凭藉「能源自主」徽章获得品牌优势
- 固态电池领域一项鲜为人知的突破,使得超轻量太阳能底盘成为可能。
- 市场限制
- 光电整合车身面板的高昂初始投资成本
- 缺乏统一的道路合法太阳能屋顶认证标准
- 光伏复合材料的回收基础设施有限。
- 间歇性功率输出使标准化充电整合变得复杂。
- 监管环境
- 技术展望
- 波特五力模型
- 新进入者的威胁
- 买方/消费者的议价能力
- 供应商的议价能力
- 替代品的威胁
- 竞争对手之间的竞争
第五章 市场规模与成长预测
- 车辆类型
- 搭乘用车
- 商用车辆
- 电动驱动系统类型
- 电池电动车(BEV)
- 混合动力电动车(HEV)
- 插电式混合动力汽车(PHEV)
- 电池化学
- 锂离子电池(NMC/LFP)
- 固体锂金属
- 铅酸
- 太阳能板技术
- 单晶硅
- 多晶
- 薄膜(CIGS/钙钛矿)
- 充电架构
- 仅车载太阳能
- 太阳能+插电式混合动力充电
- 地区
- 北美洲
- 美国
- 加拿大
- 北美其他地区
- 南美洲
- 巴西
- 阿根廷
- 其他南美洲国家
- 欧洲
- 德国
- 英国
- 法国
- 西班牙
- 义大利
- 俄罗斯
- 其他欧洲地区
- 亚太地区
- 中国
- 日本
- 印度
- 韩国
- 亚太其他地区
- 中东和非洲
- 沙乌地阿拉伯
- 阿拉伯聯合大公国
- 埃及
- 土耳其
- 南非
- 其他中东和非洲地区
- 北美洲
第六章 竞争情势
- 市场集中度
- 策略趋势
- 市占率分析
- 公司简介
- Lightyear Technologies BV
- Sono Motors GmbH
- Toyota Motor Corporation
- Ford Motor Company
- Cruise Car Inc.
- Stellantis NV(incl. FCA brands)
- Tesla Inc.
- Hanergy Mobile Energy
- Venturi Automobiles
- Aptera Motors Corp.
- Squad Mobility
- Sunreef Yachts Eco-Cars Division
- Mitsubishi Motors Corporation
- Nissan Motor Co.
- EdisonFuture(SPI Energy)
第七章 市场机会与未来展望
The solar vehicle market generated USD 0.62 billion in 2025 and is on track to reach USD 2.41 billion by 2030, advancing at a 31.20% CAGR and underscoring the rapid transition from experimental prototypes to early-stage commercial fleets.
Declining photovoltaic (PV) costs, now below prevailing grid electricity prices in major electric-vehicle regions, combine with emerging solid-state batteries to make vehicle-integrated solar systems economically viable. Early adopters gain from zero-emission fleet mandates such as the EU Fit-For-55 package and California's Advanced Clean Trucks regulation, underpinning reliable order pipelines for OEMs. Competitive intensity rises as legacy automakers accelerate solar-roof programs while specialists refine lightweight chassis that maximize surface area for PV skins. Demand also reflects rising interest in bidirectional vehicle-to-grid models that transform cars and trucks into mobile power assets during peak electricity demand.
Global Solar Vehicle Market Trends and Insights
Declining Solar-PV LCOE Below Grid Electricity in Major EV Markets
Solar photovoltaic levelized cost of electricity has achieved grid parity across key electric vehicle adoption regions, fundamentally altering the economic calculus for vehicle-integrated solar systems. Fraunhofer ISE's 2024 analysis demonstrates that solar-plus-battery storage configurations now deliver electricity at costs 20-30% below conventional grid rates in California, Germany, and eastern China. This cost advantage creates a compelling value proposition for solar vehicle owners who can achieve energy independence while reducing operational expenses. The trend accelerates as utility-scale solar manufacturing capacity reaches 1.8 terawatts globally by 2025, driving further cost reductions through economies of scale. Fleet operators benefit from this dynamic, as commercial vehicles with larger roof surfaces can generate sufficient electricity to offset significant portions of their energy consumption. The economic advantage becomes more pronounced in regions with high electricity tariffs and abundant solar irradiation, creating geographic hotspots for solar vehicle adoption.
Government Zero-Emission Fleet Mandates Drive Commercial Adoption
Regulatory frameworks across major automotive markets increasingly mandate zero-emission vehicle adoption in commercial fleets, creating predictable demand for solar-enhanced electric vehicles. The EU's Fit-For-55 package requires 30% of new urban buses to be zero-emission by 2025, rising to 65% by 2030. California's Advanced Clean Trucks regulation mandates that 40% of truck sales be zero-emission by 2030. These mandates particularly favor solar vehicles in commercial applications where extended range and reduced charging infrastructure dependence provide operational advantages. Fleet operators recognize that solar integration can extend vehicle range by 20-30% under optimal conditions, reducing charging frequency and improving route flexibility. The regulatory momentum creates a first-mover advantage for manufacturers developing solar commercial vehicles, as fleet procurement cycles typically span 5-7 years and early compliance positions companies favorably for long-term contracts. Government incentives further amplify adoption by reducing total cost of ownership through tax credits and accelerated depreciation schedules for zero-emission commercial vehicles.
High Capital Cost of PV-Embedded Body Panels
Manufacturing costs for vehicle-integrated photovoltaic systems remain substantially higher than those of conventional automotive components, creating price barriers that limit mass market adoption. Specialized solar cells designed for automotive applications require custom manufacturing processes that lack the economies of scale achieved in stationary solar installations, resulting in costs 3-4 times higher per watt than standard photovoltaic modules. The integration complexity extends beyond solar cells, including specialized wiring harnesses, power management electronics, and structural modifications that accommodate photovoltaic components while maintaining crash safety standards. Opes Solar Mobility's new factory in Germany, which began production in 2024, represents efforts to achieve manufacturing scale for vehicle-specific photovoltaic modules. However, production costs remain elevated compared to conventional automotive components. The cost premium becomes particularly challenging for mass market vehicles where price sensitivity limits manufacturers' ability to absorb additional component expenses. However, declining photovoltaic material costs and increasing manufacturing volumes suggest that cost barriers will diminish as the market matures and achieves greater scale.
Other drivers and restraints analyzed in the detailed report include:
- Battery-to-Wheel Efficiency Gains From Integrated PV Skins
- Premium-Segment OEM Branding Advantages From Energy-Autonomous Positioning
- Lack of Unified Homologation Standards for Road-Legal PV Roofs
For complete list of drivers and restraints, kindly check the Table Of Contents.
Segment Analysis
Passenger cars commanded 98.78% of the solar vehicle market share in 2024, while commercial vehicles demonstrate the fastest growth trajectory at 55.39% CAGR (2025-2030), reflecting the superior economics of solar integration in fleet applications. Large roof surfaces on trucks, buses, and delivery vehicles enable more extensive photovoltaic installations that generate meaningful energy contributions. At the same time, predictable route patterns allow fleet operators to optimize solar charging strategies. Passenger cars benefit from premium positioning and energy-autonomous branding, particularly in luxury segments where consumers value environmental differentiation over pure economic returns.
The commercial vehicle momentum builds on fleet operators' focus on total cost of ownership optimization and regulatory compliance with zero-emission mandates. Flixbus's deployment of solar panels on intercity coaches demonstrates how commercial operators leverage solar technology to reduce fuel costs and extend electric range on long-distance routes. Fleet applications also benefit from centralized maintenance capabilities and professional drivers who can optimize solar charging through route planning and parking strategies. The commercial segment's growth trajectory suggests that fleet adoption will drive manufacturing scale and cost reductions that eventually benefit passenger car applications.
Hybrid electric vehicles captured 99.38% of the solar vehicle market share in 2024 as manufacturers initially integrated solar systems into existing hybrid platforms to minimize development complexity and regulatory risk. However, battery electric vehicles accelerate at 60.83% CAGR (2025-2030) as solid-state battery technology enables more efficient solar energy storage and utilization. Toyota's roadmap for solid-state batteries, expected to launch within four years, promises to double electric range while reducing costs by 20-40%, creating compelling platforms for solar integration. Plug-in hybrid electric vehicles occupy a middle position, offering flexibility for consumers transitioning from conventional powertrains while incorporating solar charging capabilities.
The shift toward battery electric vehicles reflects improving energy storage efficiency and declining battery costs that make pure electric powertrains more viable for solar applications. Stellantis's partnership with CEA on next-generation battery cell technology demonstrates how manufacturers pursue advanced chemistry solutions that optimize solar energy utilization. The transition also benefits from expanding charging infrastructure that reduces range anxiety and enables solar vehicles to supplement rather than replace grid charging. As battery energy density improves and costs decline, pure electric platforms become increasingly attractive for solar integration due to their simplified powertrains and optimized energy management systems.
The Solar Vehicle Market Report is Segmented by Vehicle Type (Passenger Cars and Commercial Vehicles), Electric-Drivetrain Type (BEV, HEV, and More), Battery Chemistry (Lithium-Ion, Solid-State Lithium-Metal, and More), Solar-Panel Technology (Monocrystalline Silicon, Thin-Film, and More), Charging Architecture (On-Board Solar-Only, and More), and Geography. The Market Forecasts are Provided in Terms of Value (USD).
Geography Analysis
Asia-Pacific accounted for the largest regional slice of the solar vehicle market, reaching 56.79% of the solar vehicle market in 2024 on the back of China's 90% global PV module output and Japan's deep R&D bench in high-efficiency cells. Government programs such as China's "Made in China 2025" and Japan's NEDO grants fuel local component sourcing advantages that compress bill-of-materials costs. BYD's cross-border push into Japan illustrates China's intent to extend manufacturing scale benefits into premium export markets. Toyota and Sharp co-develop tandem cells that maintain domestic competitive parity.
North America traced the second-fastest growth path due to California's zero-emission mandates and the Inflation Reduction Act's production tax credits for domestically manufactured solar cells. Pickup trucks and SUVs dominate the region's vehicle mix, presenting expansive roof real estate for PV arrays. Rivian is piloting community solar programs that feed excess electricity into chargers at its Illinois plant, illustrating potential factory-to-fleet circularity.
Europe offers a mosaic of national incentives underpinned by the EU-wide Fit-For-55 targets. While regulatory certainty exists at the bloc level, divergent VAT breaks and infrastructure density create a patchwork demand profile. Lightyear's pivot to supplying embedded PV kits after securing EUR 10 million in 2024 demonstrates the capital intensity of full-vehicle production and Europe's openness to modular supply-chain roles. Germany's Opes Solar Mobility facility partially derisks EU exposure to Asian module suppliers and supports OEM localization strategies to reduce geopolitical import dependencies.
- Lightyear Technologies B.V.
- Sono Motors GmbH
- Toyota Motor Corporation
- Ford Motor Company
- Cruise Car Inc.
- Stellantis N.V. (incl. FCA brands)
- Tesla Inc.
- Hanergy Mobile Energy
- Venturi Automobiles
- Aptera Motors Corp.
- Squad Mobility
- Sunreef Yachts Eco-Cars Division
- Mitsubishi Motors Corporation
- Nissan Motor Co.
- EdisonFuture (SPI Energy)
Additional Benefits:
- The market estimate (ME) sheet in Excel format
- 3 months of analyst support
TABLE OF CONTENTS
1 Introduction
- 1.1 Study Assumptions and Market Definition
- 1.2 Scope of the Study
2 Research Methodology
3 Executive Summary
4 Market Landscape
- 4.1 Market Overview
- 4.2 Market Drivers
- 4.2.1 Declining solar-PV LCOE below grid electricity in major EV markets
- 4.2.2 Government zero-emission fleet mandates (EU Fit-For-55, California ACT, etc.)
- 4.2.3 Emerging bidirectional V2G revenue models for fleet owners (under-reported)
- 4.2.4 Battery-to-wheel efficiency gains from integrated PV skins
- 4.2.5 Premium-segment OEM branding advantages from "energy-autonomous" badges
- 4.2.6 Solid-state battery breakthroughs enabling ultra-light solar chassis (under-reported)
- 4.3 Market Restraints
- 4.3.1 High capital cost of PV-embedded body panels
- 4.3.2 Lack of unified homologation standards for road-legal PV roofs
- 4.3.3 Limited Recycling Infrastructure for Composite PV-Integrated Materials
- 4.3.4 Intermittent Power Output Complicating Standardized Charging Integration
- 4.4 Regulatory Landscape
- 4.5 Technological Outlook
- 4.6 Porter's Five Forces
- 4.6.1 Threat of New Entrants
- 4.6.2 Bargaining Power of Buyers/Consumers
- 4.6.3 Bargaining Power of Suppliers
- 4.6.4 Threat of Substitute Products
- 4.6.5 Intensity of Competitive Rivalry
5 Market Size and Growth Forecasts (Value (USD))
- 5.1 Vehicle Type
- 5.1.1 Passenger Cars
- 5.1.2 Commercial Vehicles
- 5.2 Electric-Drivetrain Type
- 5.2.1 Battery Electric Vehicle (BEV)
- 5.2.2 Hybrid Electric Vehicle (HEV)
- 5.2.3 Plug-in Hybrid Electric Vehicle (PHEV)
- 5.3 Battery Chemistry
- 5.3.1 Lithium-ion (NMC/LFP)
- 5.3.2 Solid-state Lithium-metal
- 5.3.3 Lead Acid
- 5.4 Solar-Panel Technology
- 5.4.1 Monocrystalline Silicon
- 5.4.2 Polycrystalline Silicon
- 5.4.3 Thin-film (CIGS/perovskite)
- 5.5 Charging Architecture
- 5.5.1 On-board Solar-only
- 5.5.2 Solar + Plug-in Hybrid Charging
- 5.6 Geography
- 5.6.1 North America
- 5.6.1.1 United States
- 5.6.1.2 Canada
- 5.6.1.3 Rest of North America
- 5.6.2 South America
- 5.6.2.1 Brazil
- 5.6.2.2 Argentina
- 5.6.2.3 Rest of South America
- 5.6.3 Europe
- 5.6.3.1 Germany
- 5.6.3.2 United Kingdom
- 5.6.3.3 France
- 5.6.3.4 Spain
- 5.6.3.5 Italy
- 5.6.3.6 Russia
- 5.6.3.7 Rest of Europe
- 5.6.4 Asia-Pacific
- 5.6.4.1 China
- 5.6.4.2 Japan
- 5.6.4.3 India
- 5.6.4.4 South Korea
- 5.6.4.5 Rest of Asia-Pacific
- 5.6.5 Middle East and Africa
- 5.6.5.1 Saudi Arabia
- 5.6.5.2 United Arab Emirates
- 5.6.5.3 Egypt
- 5.6.5.4 Turkey
- 5.6.5.5 South Africa
- 5.6.5.6 Rest of Middle East and Africa
- 5.6.1 North America
6 Competitive Landscape
- 6.1 Market Concentration
- 6.2 Strategic Moves
- 6.3 Market Share Analysis
- 6.4 Company Profiles (includes Global level Overview, Market level overview, Core Segments, Financials as available, Strategic Information, Market Rank/Share for key companies, Products and Services, and Recent Developments)
- 6.4.1 Lightyear Technologies B.V.
- 6.4.2 Sono Motors GmbH
- 6.4.3 Toyota Motor Corporation
- 6.4.4 Ford Motor Company
- 6.4.5 Cruise Car Inc.
- 6.4.6 Stellantis N.V. (incl. FCA brands)
- 6.4.7 Tesla Inc.
- 6.4.8 Hanergy Mobile Energy
- 6.4.9 Venturi Automobiles
- 6.4.10 Aptera Motors Corp.
- 6.4.11 Squad Mobility
- 6.4.12 Sunreef Yachts Eco-Cars Division
- 6.4.13 Mitsubishi Motors Corporation
- 6.4.14 Nissan Motor Co.
- 6.4.15 EdisonFuture (SPI Energy)
7 Market Opportunities and Future Outlook
- 7.1 White-space and Unmet-Need Assessment
 2026年全球太阳能汽车市场报告
 全球太阳能汽车市场规模、份额、趋势和成长分析报告(2026-2034年)
 卡车和火车地磅市场:按地磅类型、技术、安装类型、量程范围、材质、最终用途行业和销售管道划分 - 全球预测 2026-2032
 太阳能汽车市场规模、份额和成长分析(按车辆类型、电动车类型、电池类型、太阳能板类型、组件类型、充电类型和地区划分)—2026-2033年产业预测
 太阳能汽车市场:产业趋势及全球预测(至 2035 年)-依车辆类型、电池类型、电动车类型、太阳能板类型、公司类型和地区划分
 太阳能汽车市场-全球产业规模、份额、趋势、机会和预测,按太阳能板、电池类型、动力系统、地区和竞争格局划分,2020-2030年预测
 全球太阳能汽车市场全球太阳能汽车市场
 2025 年至 2033 年太阳能汽车市场报告(按推进类型、车辆类型、电池类型、太阳能板类型、充电类型和地区划分)太阳能电梯市场-全球产业规模、份额、趋势、机会和预测(按类型、载重量、应用、地区和竞争细分,2020-2030 年)