


 |
市场调查报告书
商品编码
1883292
太阳能汽车市场:产业趋势及全球预测(至 2035 年)-依车辆类型、电池类型、电动车类型、太阳能板类型、公司类型和地区划分Solar Vehicle Market, Till 2035: Distribution by Type of Vehicle, Type of Battery, Type of Electronic Vehicle, Type of Solar Panel, Type of Enterprise, and Geographical Regions: Industry Trends and Global Forecasts |
||||||
太阳能汽车市场概述
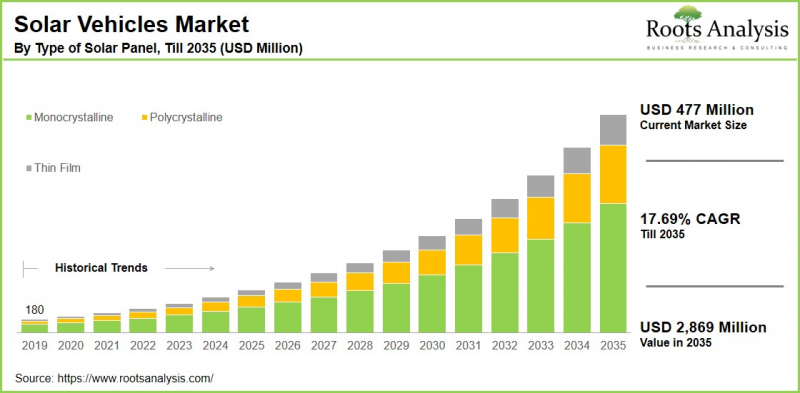
根据 Roots Analysis 的一项研究,全球太阳能汽车市场预计将从目前的 4.77 亿美元增长到 2035 年的 28.69 亿美元,预测期内(至 2035 年)的复合年增长率 (CAGR) 为 17.69%。
太阳能汽车市场机会可区隔为以下几个部分:
车辆类型
- 商用车辆
- 搭乘车
电池型
- 铅酸电池
- 锂离子电池
- 镍镉电池
- 其他
电动车类型
- 纯电动车
- 油电混合车
太阳能板类型
- 单晶硅
- 多晶硅
- 薄膜太阳能板
公司类型
- 大型公司
- 中小企业
地理区域
- 北美洲
- 美国
- 加拿大
- 墨西哥
- 其他北美洲国家国家/地区
- 欧洲
- 奥地利
- 比利时
- 丹麦
- 法国
- 德国
- 爱尔兰
- 义大利
- 荷兰
- 挪威
- 俄罗斯
- 西班牙
- 瑞典
- 瑞士
- 英国
- 其他欧洲国家
- 亚洲
- 中国
- 印度
- 日本
- 新加坡
- 韩国
- 其他亚洲国家
- 拉丁美洲
- 巴西
- 智利
- 哥伦比亚
- 委内瑞拉
- 其他拉丁美洲国家
- 中东和北非非洲
- 埃及
- 伊朗
- 伊拉克
- 以色列
- 科威特
- 沙乌地阿拉伯
- 阿拉伯联合大公国
- 其他中东和北非国家
- 世界其他地区
- 澳大利亚
- 纽西兰
- 其他国家
太阳能汽车市场:成长与趋势
一辆普通乘用车平均每年排放超过4.5吨二氧化碳。这项数据凸显了太阳能汽车的重要性,而太阳能汽车则利用太阳能为电动马达供电。太阳能汽车使用光伏电池(PV电池)将阳光转化为电能。这些电能可以直接用于驱动车辆,也可以储存在电池中。重要的是,太阳能汽车之所以受到青睐,是因为其轻质材料、高效能转换系统以及对环境影响极小的特性。此外,对环保汽油动力汽车替代品的需求日益增长,也推动了太阳能汽车市场的成长趋势。
旨在促进汽车产业永续发展的严格法规预计将在预测期内显着推动太阳能汽车市场的成长。关键技术创新包括最大功率点追踪 (MPPT) 电路的开发,该电路可优化太阳能电池板的能量输出。此外,其他製造方面的进步包括电池性能的提升和混合动力技术。重要的是,与温室气体排放相关的日益增长的环境问题正促使各国政府和监管机构在确保道路安全的同时,推广使用环保汽车。
太阳能汽车市场:主要区隔市场
依车辆类型划分的市占率
依车辆类型划分,全球太阳能车市场分为商用车和乘用车。据我们估计,乘用车区隔市场目前占大部分市场占有率。此外,预计该区隔市场在不久的将来将以更高的复合年增长率 (CAGR) 成长。这一增长与消费者环保意识的增强、太阳能技术的进步以及政府的利好政策密切相关。
以电池类型划分的市占率
依电池类型划分,全球太阳能车市场可分为铅酸电池、锂离子电池、镍镉电池和其他电池。据我们估计,锂离子电池目前占了大部分市场占有率。此外,预计该区隔市场在预测期内将以相对较高的复合年增长率成长。这一增长归功于锂离子电池优异的能量密度,使其能够在紧凑的体积内实现大容量储能,同时其长循环寿命也提供了长期的耐用性和成本效益。
以电动车类型划分的市占率
依电动车类型划分,全球太阳能车市场可分为纯电动车和混合动力电动车。据我们估计,混合动力太阳能车目前占了大部分市场占有率。此外,预计该区隔市场在预测期内将保持较高的复合年增长率 (CAGR)。这一增长主要得益于政府对太阳能汽车的激励措施以及严格的排放法规,这些因素使得太阳能汽车更具成本效益。
以太阳能板类型划分的市占率
依太阳能板类型划分,全球太阳能车市场可分为单晶硅、多晶硅及其他类型。据我们估计,单晶硅目前占了大部分市场占有率。这主要归功于太阳能汽车的高能源效率,使其能够在更小的空间内产生更多电力。
同时,多晶硅区隔市场预计在预测期内将以更快的速度成长。这主要得益于其价格优势和易于製造,多晶硅电池板的成本通常比单晶硅电池板低约 20%。这使得多晶硅电池闆对寻求经济实惠的太阳能解决方案的消费者和製造商都极具吸引力。
依公司规模划分的市占率
依公司规模划分,全球太阳能汽车市场分为大型企业及中小企业。据我们估计,大型企业目前占大部分市场占有率。这一成长归功于它们有能力投资太阳能汽车技术、利用丰富的资源、实现规模经济并推动业务扩张。
依地区划分的市占率
依地理地区划分,太阳能汽车市场分为北美、欧洲、亚洲、拉丁美洲、中东和北非以及世界其他地区。据我们估计,北美目前占大部分市场占有率。这得益于政府的大力支持、人们对太阳能汽车环境效益的认识不断提高以及太阳能交通技术的显着进步。
因此,预计亚洲在预测期内将实现最高的复合年增长率。推动这一增长的关键因素包括太阳能汽车充电基础设施的快速发展以及消费者对永续交通解决方案日益增长的需求。
太阳能汽车市场代表性公司
- Aptera
- BMW
- 戴姆勒
- 菲亚特克莱斯勒
- 菲亚特克莱斯勒
- Fisker
- 福特
- 现代汽车
- Lightyear
- 马恆达
- 日产
- Sono Motors
- 塔塔汽车
- 特斯拉
- 丰田
- 大众
太阳能汽车市场:范围
本报告在以下几个部分对太阳能汽车市场进行了详细分析:
- 市场规模与机会分析:对太阳能汽车市场的详细分析。 本报告重点关注以下关键市场区隔:[A] 车辆类型,[B] 电池类型,[C] 电动车类型,[D] 太阳能板类型,[E] 公司类型,以及 [F] 地理区域。
- 竞争格局:基于多个相关参数对太阳能汽车市场中的公司进行全面分析,包括 [A] 成立年份,[B] 公司规模,[C] 总部所在地,以及 [D] 所有权结构。
- 公司简介:详细介绍参与太阳能汽车市场的主要公司,包括 [A] 总部所在地,[B] 公司规模,[C] 公司使命宣言,[D] 地理位置,[E] 管理团队,[F] 联繫方式,[G] 财务信息,[H] 业务板块,[I] 产品组合,[J] 竞争优势分析,以及未来 [K]。
- 宏观趋势:评估太阳能汽车产业目前的宏观趋势。
- 专利分析:深入分析太阳能汽车领域已申请和已获授权的专利。相关参数包括[A]专利类型、[B]专利公开年份、[C]专利时间长度和[D]主要参与者。
- 近期发展:概述太阳能汽车市场近期发展情况,并基于相关参数进行分析,例如[A]举措年份、[B]举措类型、[C]地理分布和[D]最活跃的参与者。
- 波特五力分析:分析太阳能汽车市场中存在的五种竞争力量(新进入者的威胁、买方的议价能力、供应商的议价能力、替代品的威胁以及现有竞争对手之间的竞争)。
- SWOT分析:一个深入的SWOT框架,突显了该产业的优势、劣势、机会和威胁。它还提供了哈维鲍尔分析,突出了每个SWOT参数的相对影响。
- 价值链分析:对价值链进行全面分析,提供有关太阳能汽车市场各个阶段和利害关係人的资讯。
目录
第一部分:报告概述
第一章:引言
第二章:研究方法
第三章:市场动态
第四章:宏观经济指标
第二部分:质性分析
第五章:摘要整理
第六章:引言
第七章:监理环境
第三部分:市场概览
第八章:主要加入企业整体性资料库
第九章:竞争格局
第十章:空白市场分析
第十一章:竞争分析
第十二章:太阳能汽车市场的新创企业生态系
第四部分:公司简介
第十三章:公司简介
- 章节概述
- Aptera
- BMW
- 戴姆勒
- 菲亚特克莱斯勒
- 菲亚特在克莱斯勒
- 菲斯克
- 福特
- 现代汽车
- 光年
- 马恆达与马恆达
- 日产
- 索诺汽车
- 塔塔汽车
- 特斯拉
- 丰田
- 福斯汽车
第五部分:市场趋势
第 14 章:大趋势分析
第 15 章:未满足的需求分析
第 16 章:专利分析
第 17 章:最新进展
第六节:市场机会分析
第18章:全球太阳能汽车市场
第19章:依车辆类型划分的市场机会
第20章:以电池类型划分的市场机会
第21章:以电动车类型划分的市场机会
第22章:以太阳能板类型划分的市场机会
第23章:依公司类型划分的市场机会
第24章:北美太阳能车市场机会
第25章:欧洲太阳能汽车市场机会
第26章:亚洲太阳能车市场
第27章 中东和北非(MENA)太阳能汽车市场机会
第28章 拉丁美洲太阳能汽车市场机会
第29章 其他地区太阳能车市场机会
第30章 市场集中度分析:主要参与者的分布
第31章 邻近市场分析
第七部分:策略工具
第32章 关键制胜策略
第33章 波特五力分析
章节34. SWOT 分析
第 35 章 价值链分析
第 36 章 ROOTS 策略建议
第八部分:其他独家见解
第 37 章:来自一手研究的见解
第 38 章:报告结论
第九部分:附录
第 39 章:表格资料
第 40 章:公司与组织清单
第 41 章:客製化机会
第 42 章:ROOTS 订阅服务
第 43 章:作者资讯
Solar Vehicle Market Overview
As per Roots Analysis, the global solar vehicle market size is estimated to grow from USD 477 million in the current year USD 2,869 million by 2035, at a CAGR of 17.69% during the forecast period, till 2035.
The opportunity for solar vehicle market has been distributed across the following segments:
Type of Vehicle
- Commercial Vehicles
- Passenger Vehicles
Type of Battery
- Lead Acid
- Lithium Ion
- Nickel Cadmium
- Others
Type of Electronic Vehicle
- Battery Electric Vehicle
- Hybrid Electric Vehicle
Type of Solar Panel
- Monocrystalline
- Polycrystalline
- Thin Film
Type of Enterprise
- Large
- Small and Medium Enterprise
Geographical Regions
- North America
- US
- Canada
- Mexico
- Other North American countries
- Europe
- Austria
- Belgium
- Denmark
- France
- Germany
- Ireland
- Italy
- Netherlands
- Norway
- Russia
- Spain
- Sweden
- Switzerland
- UK
- Other European countries
- Asia
- China
- India
- Japan
- Singapore
- South Korea
- Other Asian countries
- Latin America
- Brazil
- Chile
- Colombia
- Venezuela
- Other Latin American countries
- Middle East and North Africa
- Egypt
- Iran
- Iraq
- Israel
- Kuwait
- Saudi Arabia
- UAE
- Other MENA countries
- Rest of the World
- Australia
- New Zealand
- Other countries
Solar Vehicle Market: Growth and Trends
On average, a standard passenger vehicle produces over 4.5 metric tons of carbon dioxide annually. This statistic highlights the importance of solar vehicles, which utilize sunlight to drive electric motors. Solar cars operate using photovoltaic (PV) cells that transform sunlight into electricity, either for immediate use in powering the vehicle or for storage in batteries. It is important to note that solar vehicles are preferred for their advancements in lightweight materials, effective energy conversion systems, and their capacity to function with minimal environmental impact. Moreover, the growth trend in the solar vehicle market is driven by increasing demand for eco-friendly alternatives to gasoline-powered cars.
The solar vehicle market is anticipated to grow substantially over the forecast period, due to strict regulations aimed at promoting sustainability within the automotive sector. A significant innovation is the development of maximum power point tracking (MPPT) circuits, which have optimized energy production from solar panels. Additionally, other advancements in manufacturing encompass enhanced battery performance and hybrid-electric technology. Importantly, rising environmental concerns related to greenhouse gas emissions have prompted authorities and regulatory organizations in various countries to promote the use of eco-friendly vehicles while ensuring road safety.
Solar Vehicle Market: Key Segments
Market Share by Type of Vehicle
Based on type of vehicle, the global solar vehicle market is segmented into commercial vehicles and passenger vehicles. According to our estimates, currently, the passenger vehicles segment captures the majority of the market share. Additionally, this segment is expected to expand at a notably higher CAGR in the near future. This growth can be linked to increasing consumer awareness regarding environmental concerns, advancements in solar technology, and favorable government initiatives.
Market Share by Type of Battery
Based on type of battery, the global solar vehicle market is segmented into lead acid, lithium ion, nickel cadmium and others. According to our estimates, currently, the lithium-ion segment captures the majority of the market share. Additionally, this segment is projected to experience a relatively higher CAGR during the forecast period. This growth can be linked to their superior energy density, enabling more energy storage in a compact size, along with their extended cycle life, ensuring long-term durability and cost-effectiveness.
Market Share by Type of Electronic Vehicle
Based on type of electronic vehicle, the global solar vehicle market is segmented into battery electric vehicle and hybrid electric vehicle. According to our estimates, currently, the hybrid solar vehicle segment captures the majority of the market share. Additionally, this segment is expected to experience a comparatively higher compound annual growth rate during the forecast period. This growth is driven by government incentives for solar vehicles and strict emission regulations that improve their cost-effectiveness.
Market Share by Type of Solar Panel
Based on type of solar panel, the global solar vehicle market is segmented into monocrystalline, polycrystalline and others. According to our estimates, currently, the monocrystalline segment captures the majority of the market share. This is due to the high energy efficiency in solar cars, enabling more electricity generation in smaller spaces.
Conversely, the polycrystalline segment is expected to experience a faster growth rate during the forecast period. This can be attributed to their affordability and ease of manufacturing, as polycrystalline panels are generally about 20% cheaper, making them an appealing choice for both consumers and manufacturers looking for cost-effective solar options.
Market Share by Type of Enterprise
Based on type of enterprise, the global solar vehicle market is segmented into large and small and medium enterprise. According to our estimates, currently, the large enterprise segment captures the majority of the market share. This growth can be attributed to their ability to invest in solar vehicle technologies, take advantage of considerable resources, achieve economies of scale, and promote business expansion.
Market Share by Geographical Regions
Based on geographical regions, the solar vehicle market is segmented into North America, Europe, Asia, Latin America, Middle East and North Africa, and the rest of the world. According to our estimates, currently North America captures the majority share of the market, owing to strong governmental backing, growing awareness of the environmental advantages of solar vehicles, and notable advancements in solar technology for transportation.
Consequently, Asia is projected to experience the highest compound annual growth rate (CAGR) during the forecast period. Key factors driving this growth include the rapid development of solar vehicle charging infrastructure and an increasing consumer demand for sustainable transportation solutions.
Example Players in Solar Vehicle Market
- Aptera
- BMW
- Daimler
- Fiat Chrysler
- Fiat Chrysler
- Fisker
- Ford
- Hyundai Motor
- Lightyear
- Mahindra & Mahindra
- Nissan
- Sono Motors
- Tata Motors
- Tesla
- Toyota
- Volkswagen
Solar Vehicle Market: Research Coverage
The report on the solar vehicle market features insights on various sections, including:
- Market Sizing and Opportunity Analysis: An in-depth analysis of the solar vehicle market, focusing on key market segments, including [A] type of vehicle, [B] type of battery, [C] type of electronic vehicle, [D] type of solar panel, [E] type of enterprise, and [F] geographical regions.
- Competitive Landscape: A comprehensive analysis of the companies engaged in the solar vehicle market, based on several relevant parameters, such as [A] year of establishment, [B] company size, [C] location of headquarters and [D] ownership structure.
- Company Profiles: Elaborate profiles of prominent players engaged in the solar vehicle market, providing details on [A] location of headquarters, [B] company size, [C] company mission, [D] company footprint, [E] management team, [F] contact details, [G] financial information, [H] operating business segments, [I] portfolio, [J] moat analysis, [K] recent developments, and an informed future outlook.
- Megatrends: An evaluation of ongoing megatrends in the solar vehicle industry.
- Patent Analysis: An insightful analysis of patents filed / granted in the solar vehicle domain, based on relevant parameters, including [A] type of patent, [B] patent publication year, [C] patent age and [D] leading players.
- Recent Developments: An overview of the recent developments made in the solar vehicle market, along with analysis based on relevant parameters, including [A] year of initiative, [B] type of initiative, [C] geographical distribution and [D] most active players.
- Porter's Five Forces Analysis: An analysis of five competitive forces prevailing in the solar vehicle market, including threats of new entrants, bargaining power of buyers, bargaining power of suppliers, threats of substitute products and rivalry among existing competitors.
- SWOT Analysis: An insightful SWOT framework, highlighting the strengths, weaknesses, opportunities and threats in the domain. Additionally, it provides Harvey ball analysis, highlighting the relative impact of each SWOT parameter.
- Value Chain Analysis: A comprehensive analysis of the value chain, providing information on the different phases and stakeholders involved in the solar vehicle market.
Key Questions Answered in this Report
- How many companies are currently engaged in solar vehicle market?
- Which are the leading companies in this market?
- What factors are likely to influence the evolution of this market?
- What is the current and future market size?
- What is the CAGR of this market?
- How is the current and future market opportunity likely to be distributed across key market segments?
Reasons to Buy this Report
- The report provides a comprehensive market analysis, offering detailed revenue projections of the overall market and its specific sub-segments. This information is valuable to both established market leaders and emerging entrants.
- Stakeholders can leverage the report to gain a deeper understanding of the competitive dynamics within the market. By analyzing the competitive landscape, businesses can make informed decisions to optimize their market positioning and develop effective go-to-market strategies.
- The report offers stakeholders a comprehensive overview of the market, including key drivers, barriers, opportunities, and challenges. This information empowers stakeholders to stay abreast of market trends and make data-driven decisions to capitalize on growth prospects.
Additional Benefits
- Complimentary Excel Data Packs for all Analytical Modules in the Report
- 15% Free Content Customization
- Detailed Report Walkthrough Session with Research Team
- Free Updated report if the report is 6-12 months old or older
TABLE OF CONTENTS
SECTION I: REPORT OVERVIEW
1. PREFACE
- 1.1. Introduction
- 1.2. Market Share Insights
- 1.3. Key Market Insights
- 1.4. Report Coverage
- 1.5. Key Questions Answered
- 1.6. Chapter Outlines
2. RESEARCH METHODOLOGY
- 2.1. Chapter Overview
- 2.2. Research Assumptions
- 2.3. Database Building
- 2.3.1. Data Collection
- 2.3.2. Data Validation
- 2.3.3. Data Analysis
- 2.4. Project Methodology
- 2.4.1. Secondary Research
- 2.4.1.1. Annual Reports
- 2.4.1.2. Academic Research Papers
- 2.4.1.3. Company Websites
- 2.4.1.4. Investor Presentations
- 2.4.1.5. Regulatory Filings
- 2.4.1.6. White Papers
- 2.4.1.7. Industry Publications
- 2.4.1.8. Conferences and Seminars
- 2.4.1.9. Government Portals
- 2.4.1.10. Media and Press Releases
- 2.4.1.11. Newsletters
- 2.4.1.12. Industry Databases
- 2.4.1.13. Roots Proprietary Databases
- 2.4.1.14. Paid Databases and Sources
- 2.4.1.15. Social Media Portals
- 2.4.1.16. Other Secondary Sources
- 2.4.2. Primary Research
- 2.4.2.1. Introduction
- 2.4.2.2. Types
- 2.4.2.2.1. Qualitative
- 2.4.2.2.2. Quantitative
- 2.4.2.3. Advantages
- 2.4.2.4. Techniques
- 2.4.2.4.1. Interviews
- 2.4.2.4.2. Surveys
- 2.4.2.4.3. Focus Groups
- 2.4.2.4.4. Observational Research
- 2.4.2.4.5. Social Media Interactions
- 2.4.2.5. Stakeholders
- 2.4.2.5.1. Company Executives (CXOs)
- 2.4.2.5.2. Board of Directors
- 2.4.2.5.3. Company Presidents and Vice Presidents
- 2.4.2.5.4. Key Opinion Leaders
- 2.4.2.5.5. Research and Development Heads
- 2.4.2.5.6. Technical Experts
- 2.4.2.5.7. Subject Matter Experts
- 2.4.2.5.8. Scientists
- 2.4.2.5.9. Doctors and Other Healthcare Providers
- 2.4.2.6. Ethics and Integrity
- 2.4.2.6.1. Research Ethics
- 2.4.2.6.2. Data Integrity
- 2.4.3. Analytical Tools and Databases
- 2.4.1. Secondary Research
3. MARKET DYNAMICS
- 3.1. Forecast Methodology
- 3.1.1. Top-Down Approach
- 3.1.2. Bottom-Up Approach
- 3.1.3. Hybrid Approach
- 3.2. Market Assessment Framework
- 3.2.1. Total Addressable Market (TAM)
- 3.2.2. Serviceable Addressable Market (SAM)
- 3.2.3. Serviceable Obtainable Market (SOM)
- 3.2.4. Currently Acquired Market (CAM)
- 3.3. Forecasting Tools and Techniques
- 3.3.1. Qualitative Forecasting
- 3.3.2. Correlation
- 3.3.3. Regression
- 3.3.4. Time Series Analysis
- 3.3.5. Extrapolation
- 3.3.6. Convergence
- 3.3.7. Forecast Error Analysis
- 3.3.8. Data Visualization
- 3.3.9. Scenario Planning
- 3.3.10. Sensitivity Analysis
- 3.4. Key Considerations
- 3.4.1. Demographics
- 3.4.2. Market Access
- 3.4.3. Reimbursement Scenarios
- 3.4.4. Industry Consolidation
- 3.5. Robust Quality Control
- 3.6. Key Market Segmentations
- 3.7. Limitations
4. MACRO-ECONOMIC INDICATORS
- 4.1. Chapter Overview
- 4.2. Market Dynamics
- 4.2.1. Time Period
- 4.2.1.1. Historical Trends
- 4.2.1.2. Current and Forecasted Estimates
- 4.2.2. Currency Coverage
- 4.2.2.1. Overview of Major Currencies Affecting the Market
- 4.2.2.2. Impact of Currency Fluctuations on the Industry
- 4.2.3. Foreign Exchange Impact
- 4.2.3.1. Evaluation of Foreign Exchange Rates and Their Impact on Market
- 4.2.3.2. Strategies for Mitigating Foreign Exchange Risk
- 4.2.4. Recession
- 4.2.4.1. Historical Analysis of Past Recessions and Lessons Learnt
- 4.2.4.2. Assessment of Current Economic Conditions and Potential Impact on the Market
- 4.2.5. Inflation
- 4.2.5.1. Measurement and Analysis of Inflationary Pressures in the Economy
- 4.2.5.2. Potential Impact of Inflation on the Market Evolution
- 4.2.6. Interest Rates
- 4.2.6.1. Overview of Interest Rates and Their Impact on the Market
- 4.2.6.2. Strategies for Managing Interest Rate Risk
- 4.2.7. Commodity Flow Analysis
- 4.2.7.1. Type of Commodity
- 4.2.7.2. Origins and Destinations
- 4.2.7.3. Values and Weights
- 4.2.7.4. Modes of Transportation
- 4.2.8. Global Trade Dynamics
- 4.2.8.1. Import Scenario
- 4.2.8.2. Export Scenario
- 4.2.9. War Impact Analysis
- 4.2.9.1. Russian-Ukraine War
- 4.2.9.2. Israel-Hamas War
- 4.2.10. COVID Impact / Related Factors
- 4.2.10.1. Global Economic Impact
- 4.2.10.2. Industry-specific Impact
- 4.2.10.3. Government Response and Stimulus Measures
- 4.2.10.4. Future Outlook and Adaptation Strategies
- 4.2.11. Other Indicators
- 4.2.11.1. Fiscal Policy
- 4.2.11.2. Consumer Spending
- 4.2.11.3. Gross Domestic Product (GDP)
- 4.2.11.4. Employment
- 4.2.11.5. Taxes
- 4.2.11.6. R&D Innovation
- 4.2.11.7. Stock Market Performance
- 4.2.11.8. Supply Chain
- 4.2.11.9. Cross-Border Dynamics
- 4.2.1. Time Period
SECTION II: QUALITATIVE INSIGHTS
5. EXECUTIVE SUMMARY
6. INTRODUCTION
- 6.1. Chapter Overview
- 6.2. Overview of Solar Vehicle Market
- 6.2.1. Type of Vehicle
- 6.2.2. Type of Battery
- 6.2.3. Type of Electronic Vehicle
- 6.2.4. Type of Solar Panel
- 6.2.5. Type of Enterprise
- 6.3. Future Perspective
7. REGULATORY SCENARIO
SECTION III: MARKET OVERVIEW
8. COMPREHENSIVE DATABASE OF LEADING PLAYERS
9. COMPETITIVE LANDSCAPE
- 9.1. Chapter Overview
- 9.2. Solar Vehicle: Overall Market Landscape
- 9.2.1. Analysis by Year of Establishment
- 9.2.2. Analysis by Company Size
- 9.2.3. Analysis by Location of Headquarters
- 9.2.4. Analysis by Ownership Structure
10. WHITE SPACE ANALYSIS
11. COMPANY COMPETITIVENESS ANALYSIS
12. STARTUP ECOSYSTEM IN THE SOLAR VEHICLE MARKET
- 12.1. Solar Vehicle Market: Market Landscape of Startups
- 12.1.1. Analysis by Year of Establishment
- 12.1.2. Analysis by Company Size
- 12.1.3. Analysis by Company Size and Year of Establishment
- 12.1.4. Analysis by Location of Headquarters
- 12.1.5. Analysis by Company Size and Location of Headquarters
- 12.1.6. Analysis by Ownership Structure
- 12.2. Key Findings
SECTION IV: COMPANY PROFILES
13. COMPANY PROFILES
- 13.1. Chapter Overview
- 13.2. Aptera*
- 13.2.1. Company Overview
- 13.2.2. Company Mission
- 13.2.3. Company Footprint
- 13.2.4. Management Team
- 13.2.5. Contact Details
- 13.2.6. Financial Performance
- 13.2.7. Operating Business Segments
- 13.2.8. Service / Product Portfolio (project specific)
- 13.2.9. MOAT Analysis
- 13.2.10. Recent Developments and Future Outlook
- 13.3. BMW
- 13.4. Daimler
- 13.5. Fiat Chrysler
- 13.6. Fiat Chrysler
- 13.7. Fisker
- 13.8. Ford
- 13.9. Hyundai Motor
- 13.10. Lightyear
- 13.11. Mahindra & Mahindra
- 13.12. Nissan
- 13.13. Sono Motors
- 13.14. Tata Motors
- 13.15. Tesla
- 13.16. Toyota
- 13.17. Volkswagen
SECTION V: MARKET TRENDS
14. MEGA TRENDS ANALYSIS
15. UNMET NEED ANALYSIS
16. PATENT ANALYSIS
17. RECENT DEVELOPMENTS
- 17.1. Chapter Overview
- 17.2. Recent Funding
- 17.3. Recent Partnerships
- 17.4. Other Recent Initiatives
SECTION VI: MARKET OPPORTUNITY ANALYSIS
18. GLOBAL SOLAR VEHICLE MARKET
- 18.1. Chapter Overview
- 18.2. Key Assumptions and Methodology
- 18.3. Trends Disruption Impacting Market
- 18.4. Demand Side Trends
- 18.5. Supply Side Trends
- 18.6. Global Solar Vehicle Market, Historical Trends (Since 2019) and Forecasted Estimates (Till 2035)
- 18.7. Multivariate Scenario Analysis
- 18.7.1. Conservative Scenario
- 18.7.2. Optimistic Scenario
- 18.8. Investment Feasibility Index
- 18.9. Key Market Segmentations
19. MARKET OPPORTUNITIES BASED ON TYPE OF VEHICLE
- 19.1. Chapter Overview
- 19.2. Key Assumptions and Methodology
- 19.3. Revenue Shift Analysis
- 19.4. Market Movement Analysis
- 19.5. Penetration-Growth (P-G) Matrix
- 19.6. Solar Vehicle Market for Commercial Vehicles: Historical Trends (Since 2019) and Forecasted Estimates (Till 2035)
- 19.7. Solar Vehicle Market for Passenger Vehicles: Historical Trends (Since 2019) and Forecasted Estimates (Till 2035)
- 19.8. Data Triangulation and Validation
- 19.8.1. Secondary Sources
- 19.8.2. Primary Sources
- 19.8.3. Statistical Modeling
20. MARKET OPPORTUNITIES BASED ON TYPE OF BATTERY
- 20.1. Chapter Overview
- 20.2. Key Assumptions and Methodology
- 20.3. Revenue Shift Analysis
- 20.4. Market Movement Analysis
- 20.5. Penetration-Growth (P-G) Matrix
- 20.6. Solar Vehicle Market for Lead Acid: Historical Trends (Since 2019) and Forecasted Estimates (Till 2035)
- 20.7. Solar Vehicle Market for Lithium Ion: Historical Trends (Since 2019) and Forecasted Estimates (Till 2035)
- 20.8. Solar Vehicle Market for Nickel Cadmium: Historical Trends (Since 2019) and Forecasted Estimates (Till 2035)
- 20.9. Solar Vehicle Market for Others: Historical Trends (Since 2019) and Forecasted Estimates (Till 2035)
- 20.10. Data Triangulation and Validation
- 20.10.1. Secondary Sources
- 20.10.2. Primary Sources
- 20.10.3. Statistical Modeling
21. MARKET OPPORTUNITIES BASED ON TYPE OF ELECTRONIC VEHICLE
- 21.1. Chapter Overview
- 21.2. Key Assumptions and Methodology
- 21.3. Revenue Shift Analysis
- 21.4. Market Movement Analysis
- 21.5. Penetration-Growth (P-G) Matrix
- 21.6. Solar Vehicle Market for Battery Electric Vehicle: Historical Trends (Since 2019) and Forecasted Estimates (Till 2035)
- 21.7. Solar Vehicle Market for Hybrid Electric Vehicle: Historical Trends (Since 2019) and Forecasted Estimates (Till 2035)
- 21.8. Data Triangulation and Validation
- 21.8.1. Secondary Sources
- 21.8.2. Primary Sources
- 21.8.3. Statistical Modeling
22. MARKET OPPORTUNITIES BASED ON TYPE OF SOLAR PANEL
- 22.1. Chapter Overview
- 22.2. Key Assumptions and Methodology
- 22.3. Revenue Shift Analysis
- 22.4. Market Movement Analysis
- 22.5. Penetration-Growth (P-G) Matrix
- 22.6. Solar Vehicle Market for Monocrystalline: Historical Trends (Since 2019) and Forecasted Estimates (Till 2035)
- 22.7. Solar Vehicle Market for Polycrystalline: Historical Trends (Since 2019) and Forecasted Estimates (Till 2035)
- 22.8. Solar Vehicle Market for Thin Film: Historical Trends (Since 2019) and Forecasted Estimates (Till 2035)
- 22.9. Data Triangulation and Validation
- 22.9.1. Secondary Sources
- 22.9.2. Primary Sources
- 22.9.3. Statistical Modeling
23. MARKET OPPORTUNITIES BASED ON TYPE OF ENTERPRISE
- 23.1. Chapter Overview
- 23.2. Key Assumptions and Methodology
- 23.3. Revenue Shift Analysis
- 23.4. Market Movement Analysis
- 23.5. Penetration-Growth (P-G) Matrix
- 23.6. Solar Vehicle Market for Large: Historical Trends (Since 2019) and Forecasted Estimates (Till 2035)
- 23.7. Solar Vehicle Market for Small and Medium Enterprise: Historical Trends (Since 2019) and Forecasted Estimates (Till 2035)
- 23.8. Data Triangulation and Validation
- 23.8.1. Secondary Sources
- 23.8.2. Primary Sources
- 23.8.3. Statistical Modeling
24. MARKET OPPORTUNITIES FOR SOLAR VEHICLE IN NORTH AMERICA
- 24.1. Chapter Overview
- 24.2. Key Assumptions and Methodology
- 24.3. Revenue Shift Analysis
- 24.4. Market Movement Analysis
- 24.5. Penetration-Growth (P-G) Matrix
- 24.6. Solar Vehicle Market in North America: Historical Trends (Since 2019) and Forecasted Estimates (Till 2035)
- 24.6.1. Solar Vehicle Market in the US: Historical Trends (Since 2019) and Forecasted Estimates (Till 2035)
- 24.6.2. Solar Vehicle Market in Canada: Historical Trends (Since 2019) and Forecasted Estimates (Till 2035)
- 24.6.3. Solar Vehicle Market in Mexico: Historical Trends (Since 2019) and Forecasted Estimates (Till 2035)
- 24.6.4. Solar Vehicle Market in Other North American Countries: Historical Trends (Since 2019) and Forecasted Estimates (Till 2035)
- 24.7. Data Triangulation and Validation
25. MARKET OPPORTUNITIES FOR SOLAR VEHICLE IN EUROPE
- 25.1. Chapter Overview
- 25.2. Key Assumptions and Methodology
- 25.3. Revenue Shift Analysis
- 25.4. Market Movement Analysis
- 25.5. Penetration-Growth (P-G) Matrix
- 25.6. Solar Vehicle Market in Europe: Historical Trends (Since 2019) and Forecasted Estimates (Till 2035)
- 25.6.1. Solar Vehicle Market in Austria: Historical Trends (Since 2019) and Forecasted Estimates (Till 2035)
- 25.6.2. Solar Vehicle Market in Belgium: Historical Trends (Since 2019) and Forecasted Estimates (Till 2035)
- 25.6.3. Solar Vehicle Market in Denmark: Historical Trends (Since 2019) and Forecasted Estimates (Till 2035)
- 25.6.4. Solar Vehicle Market in France: Historical Trends (Since 2019) and Forecasted Estimates (Till 2035)
- 25.6.5. Solar Vehicle Market in Germany: Historical Trends (Since 2019) and Forecasted Estimates (Till 2035)
- 25.6.6. Solar Vehicle Market in Ireland: Historical Trends (Since 2019) and Forecasted Estimates (Till 2035)
- 25.6.7. Solar Vehicle Market in Italy: Historical Trends (Since 2019) and Forecasted Estimates (Till 2035)
- 25.6.8. Solar Vehicle Market in Netherlands: Historical Trends (Since 2019) and Forecasted Estimates (Till 2035)
- 25.6.9. Solar Vehicle Market in Norway: Historical Trends (Since 2019) and Forecasted Estimates (Till 2035)
- 25.6.10. Solar Vehicle Market in Russia: Historical Trends (Since 2019) and Forecasted Estimates (Till 2035)
- 25.6.11. Solar Vehicle Market in Spain: Historical Trends (Since 2019) and Forecasted Estimates (Till 2035)
- 25.6.12. Solar Vehicle Market in Sweden: Historical Trends (Since 2019) and Forecasted Estimates (Till 2035)
- 25.6.13. Solar Vehicle Market in Switzerland: Historical Trends (Since 2019) and Forecasted Estimates (Till 2035)
- 25.6.14. Solar Vehicle Market in the UK: Historical Trends (Since 2019) and Forecasted Estimates (Till 2035)
- 25.6.15. Solar Vehicle Market in Other European Countries: Historical Trends (Since 2019) and Forecasted Estimates (Till 2035)
- 25.7. Data Triangulation and Validation
26. MARKET OPPORTUNITIES FOR SOLAR VEHICLE IN ASIA
- 26.1. Chapter Overview
- 26.2. Key Assumptions and Methodology
- 26.3. Revenue Shift Analysis
- 26.4. Market Movement Analysis
- 26.5. Penetration-Growth (P-G) Matrix
- 26.6. Solar Vehicle Market in Asia: Historical Trends (Since 2019) and Forecasted Estimates (Till 2035)
- 26.6.1. Solar Vehicle Market in China: Historical Trends (Since 2019) and Forecasted Estimates (Till 2035)
- 26.6.2. Solar Vehicle Market in India: Historical Trends (Since 2019) and Forecasted Estimates (Till 2035)
- 26.6.3. Solar Vehicle Market in Japan: Historical Trends (Since 2019) and Forecasted Estimates (Till 2035)
- 26.6.4. Solar Vehicle Market in Singapore: Historical Trends (Since 2019) and Forecasted Estimates (Till 2035)
- 26.6.5. Solar Vehicle Market in South Korea: Historical Trends (Since 2019) and Forecasted Estimates (Till 2035)
- 26.6.6. Solar Vehicle Market in Other Asian Countries: Historical Trends (Since 2019) and Forecasted Estimates (Till 2035)
- 26.7. Data Triangulation and Validation
27. MARKET OPPORTUNITIES FOR SOLAR VEHICLE IN MIDDLE EAST AND NORTH AFRICA (MENA)
- 27.1. Chapter Overview
- 27.2. Key Assumptions and Methodology
- 27.3. Revenue Shift Analysis
- 27.4. Market Movement Analysis
- 27.5. Penetration-Growth (P-G) Matrix
- 27.6. Solar Vehicle Market in Middle East and North Africa (MENA): Historical Trends (Since 2019) and Forecasted Estimates (Till 2035)
- 27.6.1. Solar Vehicle Market in Egypt: Historical Trends (Since 2019) and Forecasted Estimates (Till 205)
- 27.6.2. Solar Vehicle Market in Iran: Historical Trends (Since 2019) and Forecasted Estimates (Till 2035)
- 27.6.3. Solar Vehicle Market in Iraq: Historical Trends (Since 2019) and Forecasted Estimates (Till 2035)
- 27.6.4. Solar Vehicle Market in Israel: Historical Trends (Since 2019) and Forecasted Estimates (Till 2035)
- 27.6.5. Solar Vehicle Market in Kuwait: Historical Trends (Since 2019) and Forecasted Estimates (Till 2035)
- 27.6.6. Solar Vehicle Market in Saudi Arabia: Historical Trends (Since 2019) and Forecasted Estimates (Till 2035)
- 27.6.7. Solar Vehicle Market in United Arab Emirates (UAE): Historical Trends (Since 2019) and Forecasted Estimates (Till 2035)
- 27.6.8. Solar Vehicle Market in Other MENA Countries: Historical Trends (Since 2019) and Forecasted Estimates (Till 2035)
- 27.7. Data Triangulation and Validation
28. MARKET OPPORTUNITIES FOR SOLAR VEHICLE IN LATIN AMERICA
- 28.1. Chapter Overview
- 28.2. Key Assumptions and Methodology
- 28.3. Revenue Shift Analysis
- 28.4. Market Movement Analysis
- 28.5. Penetration-Growth (P-G) Matrix
- 28.6. Solar Vehicle Market in Latin America: Historical Trends (Since 2019) and Forecasted Estimates (Till 2035)
- 28.6.1. Solar Vehicle Market in Argentina: Historical Trends (Since 2019) and Forecasted Estimates (Till 2035)
- 28.6.2. Solar Vehicle Market in Brazil: Historical Trends (Since 2019) and Forecasted Estimates (Till 2035)
- 28.6.3. Solar Vehicle Market in Chile: Historical Trends (Since 2019) and Forecasted Estimates (Till 2035)
- 28.6.4. Solar Vehicle Market in Colombia Historical Trends (Since 2019) and Forecasted Estimates (Till 2035)
- 28.6.5. Solar Vehicle Market in Venezuela: Historical Trends (Since 2019) and Forecasted Estimates (Till 2035)
- 28.6.6. Solar Vehicle Market in Other Latin American Countries: Historical Trends (Since 2019) and Forecasted Estimates (Till 2035)
- 28.7. Data Triangulation and Validation
29. MARKET OPPORTUNITIES FOR SOLAR VEHICLE IN REST OF THE WORLD
- 29.1. Chapter Overview
- 29.2. Key Assumptions and Methodology
- 29.3. Revenue Shift Analysis
- 29.4. Market Movement Analysis
- 29.5. Penetration-Growth (P-G) Matrix
- 29.6. Solar Vehicle Market in Rest of the World: Historical Trends (Since 2019) and Forecasted Estimates (Till 2035)
- 29.6.1. Solar Vehicle Market in Australia: Historical Trends (Since 2019) and Forecasted Estimates (Till 2035)
- 29.6.2. Solar Vehicle Market in New Zealand: Historical Trends (Since 2019) and Forecasted Estimates (Till 2035)
- 29.6.3. Solar Vehicle Market in Other Countries
- 29.7. Data Triangulation and Validation
30. MARKET CONCENTRATION ANALYSIS: DISTRIBUTION BY LEADING PLAYERS
- 30.1. Leading Player 1
- 30.2. Leading Player 2
- 30.3. Leading Player 3
- 30.4. Leading Player 4
- 30.5. Leading Player 5
- 30.6. Leading Player 6
- 30.7. Leading Player 7
- 30.8. Leading Player 8
31. ADJACENT MARKET ANALYSIS
SECTION VII: STRATEGIC TOOLS
32. KEY WINNING STRATEGIES
33. PORTER'S FIVE FORCES ANALYSIS
34. SWOT ANALYSIS
35. VALUE CHAIN ANALYSIS
36. ROOTS STRATEGIC RECOMMENDATIONS
- 36.1. Chapter Overview
- 36.2. Key Business-related Strategies
- 36.2.1. Research & Development
- 36.2.2. Product Manufacturing
- 36.2.3. Commercialization / Go-to-Market
- 36.2.4. Sales and Marketing
- 36.3. Key Operations-related Strategies
- 36.3.1. Risk Management
- 36.3.2. Workforce
- 36.3.3. Finance
- 36.3.4. Others
SECTION VIII: OTHER EXCLUSIVE INSIGHTS
37. INSIGHTS FROM PRIMARY RESEARCH
38. REPORT CONCLUSION
SECTION IX: APPENDIX
39. TABULATED DATA
40. LIST OF COMPANIES AND ORGANIZATIONS
41. CUSTOMIZATION OPPORTUNITIES
42. ROOTS SUBSCRIPTION SERVICES
43. AUTHOR DETAILS
 2026年全球太阳能汽车市场报告
 全球太阳能汽车市场规模、份额、趋势和成长分析报告(2026-2034年)
 卡车和火车地磅市场:按地磅类型、技术、安装类型、量程范围、材质、最终用途行业和销售管道划分 - 全球预测 2026-2032
 太阳能汽车市场规模、份额和成长分析(按车辆类型、电动车类型、电池类型、太阳能板类型、组件类型、充电类型和地区划分)—2026-2033年产业预测
 太阳能汽车市场-全球产业规模、份额、趋势、机会和预测,按太阳能板、电池类型、动力系统、地区和竞争格局划分,2020-2030年预测
 全球太阳能汽车市场全球太阳能汽车市场
 2025 年至 2033 年太阳能汽车市场报告(按推进类型、车辆类型、电池类型、太阳能板类型、充电类型和地区划分)太阳能电梯市场-全球产业规模、份额、趋势、机会和预测(按类型、载重量、应用、地区和竞争细分,2020-2030 年)
 太阳能汽车:市场份额分析、行业趋势、统计数据和成长预测(2025-2030 年)