


 |
市场调查报告书
商品编码
1851866
热泵:全球市场份额分析、行业趋势、统计数据和成长预测(2025-2030 年)Global Heat Pumps - Market Share Analysis, Industry Trends & Statistics, Growth Forecasts (2025 - 2030) |
||||||
※ 本网页内容可能与最新版本有所差异。详细情况请与我们联繫。
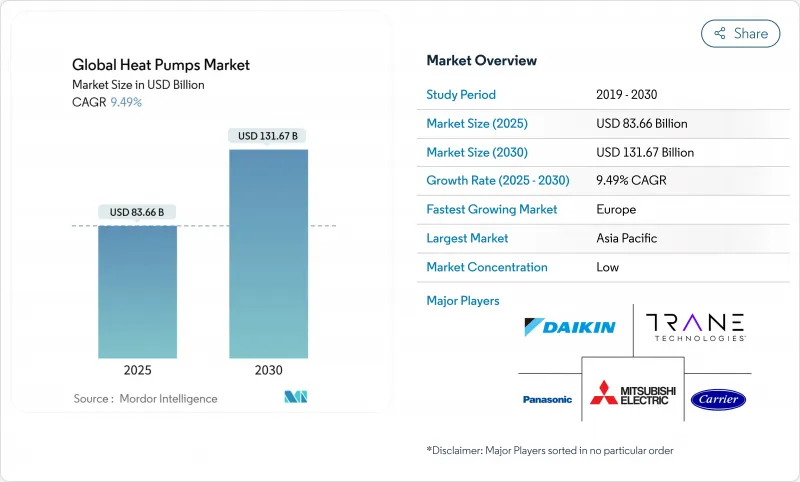
预计到 2025 年,热泵市场规模将达到 836.6 亿美元,到 2030 年将达到 1,316.7 亿美元。
这反映了 9.49% 的复合年增长率,主要得益于政策驱动的电气化目标和寒冷气候技术的突破。
欧洲和北美地区的脱碳政策、联邦和州政府的大力扶持以及日益庞大的公共产业计划,使得热泵市场成为石化燃料供暖和热水解决方案的重要替代方案。中国一体化的製造地有效降低了成本,而变频压缩机技术的进步缩小了零下温度下的性能差距,为在寒冷气候地区快速普及奠定了基础。美国和波兰的供应链本地化倡议降低了关税和运费风险,「供热即服务」融资模式的兴起解决了高昂的初始安装成本问题,此前这一成本曾阻碍了热泵在现有建筑中的应用。
全球热泵市场趋势与洞察
政府脱碳奖励和强制规定
积极的政策框架透过将建筑规范和补贴水准与可再生能源供热性能直接挂钩,人为地製造了对热泵的强劲需求。例如,美国的《通货膨胀抑制法案》提供了联邦税额扣抵和州政府补贴,每户家庭最高可获得14,000美元;德国则强制规定,从2024年起,所有新建供暖系统必须使用65%的可再生能源供热;加拿大的「油转热泵经济适用性计画」为低收入家庭提供高达15,000加元(约合11,100美元)的补贴;英国的「锅炉升级计画」也提供高达7,500英镑(约9,400美元)的补贴。这些措施人为地设定了需求下限,保护製造商免受宏观经济放缓的影响,并加速了市场渗透。
电气化主导的暖通空调更新周期
大型城市的温室气体排放法规将通常15-20年的暖通空调系统更换週期缩短为快速维修,并以高效能热泵取代故障锅炉。纽约市第97号地方法律催生了诸如Hudson街345号维修项目之类的计划,该项目结合了热泵和余热回收技术,以实现到2030年排放70%的目标。麻州公用事业公司在弗雷明汉推出了美国首个地热网络,于2024年连结了135户用户,展现了社区电气化的潜力。
现有建筑物的安装和维修成本很高
设备总价因地区而异。在德国,维修一栋典型的连栋住宅需要花费超过3万欧元(约3.24万美元),是法国补贴后的两倍,主要是因为德国人事费用高且授权流程更为严格。纽约一栋多户住宅大楼的案例研究显示,光是配电盘的维修就占了计划总成本的40%,凸显了补贴无法涵盖的基础建设难题。
细分市场分析
2024年,热泵占了73.5%的市场。然而,随着公用事业公司试点建设联网迴路(例如耗资1400万美元的弗雷明汉计划,该项目在2024年连接了135个用户),预计地源热泵/地热能市场将以12.6%的复合年增长率成长。直接膨胀式钻孔和共用地埋管路技术的进步已将能源效率比(COP)稳定性提高到4.0以上,从而增强了其在人口密集的城市填充区中的吸引力。
空气源热泵製造商持续改进低温演算法,降低了-20°F(-29°C)时的性能衰减,从而释放了北方市场的成长。同时,公用事业公司和大型开发商将地热系统视为应对电网尖峰负载的有效手段,因为其输出功率与外部温度波动无关。这些动态表明,热泵市场将逐步实现重新平衡,儘管在整个预测期内,空气源热泵仍将占据主导地位。
2024年,功率不超过10千瓦的家用热泵系统将占总出货量的46.3%,反映出在消费者补贴的支持下,此类系统在独栋住宅中得到广泛应用。然而,30千瓦以上的功率等级将占据主导地位,年复合成长率将达到12.4%,这主要得益于区域供热和工业计划的成长。丹麦埃斯比约70兆瓦海水发电厂和汉堡60兆瓦污水倡议凸显了集中式大型设施的发展动能。
由于设备标准化和授权简化,小容量部署预计将持续成长。大容量部署的强劲势头凸显了其更广泛的应用领域,包括仓储、食品加工以及旨在实现碳中和供热的市政管网。
热泵市场按热源类型(空气源、水源、地源)、额定容量(10kW以下、10-20kW及其他)、系统设计(分离式、一体式、混合式热泵)、最终用户(住宅、商业及其他)、应用(空间供暖和製冷、热水及其他)以及地区进行细分。市场预测以美元计价。
区域分析
2024年,亚太地区仍将维持在热泵市场的主导地位,市占率高达38.3%。这主要得益于中国国内13%的销售成长和占全球产能40%的份额,同时工厂自动化也促使单价下降了12%。日本1%的谨慎成长以及韩国在压缩机技术领域的领先地位,稳定了该地区的热泵出货量。
欧洲正在復苏,预计在经历了2024年初德国供暖法争议导致消费者信心受挫、销量下降50%的低迷之后,年复合成长率将达到11.1%。法国承诺每年生产100万台家用电器,丹麦也公布了包括埃斯比约海水发电厂在内的多个大型区域性计划,以履行其到2030年石化燃料目标的承诺。英国儘管获得了高达7.5兆英镑的慷慨补贴,但仍未能完成其安装目标,这凸显了基础设施和技能障碍而非纯粹的经济因素所起的作用。
北美地区在经历了最初的疲软开局后,已在政策支持的推动下进入增长週期:在美国,《通膨降低法案》的激励措施已促使销售额在2024年11月前同比增长15%;而在加拿大,已处理超过13000份拨款申请,主要集中在大西洋省份。三菱电机压缩机工厂和大金-科普兰合资企业等供应链重组项目旨在透过关键零件的本地化生产来抵消2.5亿至2.75亿美元关税的影响。
其他福利:
- Excel格式的市场预测(ME)表
- 3个月的分析师支持
目录
第一章 引言
- 研究假设和市场定义
- 调查范围
第二章调查方法
第三章执行摘要
第四章 市场情势
- 市场概览
- 市场驱动因素
- 政府脱碳奖励和强制规定
- 电气化导致的暖通空调更换週期延长
- 变频压缩机的成本迅速下降
- 併网热泵可实现需量反应收益
- 寒冷地区热泵技术取得突破
- 以供热为服务的经营模式能够促进资金筹措
- 市场限制
- 现有建筑物的安装和维修成本很高
- 熟练安装人员短缺
- 老旧住宅存量的配电盘和电网容量受限。
- 在某些国家,与混合氢锅炉竞争的风险
- 价值/供应链分析
- 监管环境
- 技术展望
- 宏观经济因素的影响
- 波特五力模型
- 供应商的议价能力
- 买方的议价能力
- 新进入者的威胁
- 替代品的威胁
- 竞争程度
第五章 市场规模与成长预测
- 按热源类型
- 空气源
- Air-to-Air
- Air-to-Water
- 水源
- 地表水
- 开放回路
- 地源/地热源
- 垂直闭合迴路
- 闭合迴路水平型
- 直接膨胀
- 空气源
- 按额定容量
- 小于10千瓦
- 10-20 kW
- 20-30 kW
- 30千瓦或以上
- 透过系统设计
- 分离式系统
- 单体块
- 混合热泵
- 最终用户
- 住房
- 商业
- 产业
- 公共利益
- 透过使用
- 空间供暖和冷气
- 热水供应
- 区域供热
- 製程和工业加热
- 按地区
- 北美洲
- 美国
- 加拿大
- 墨西哥
- 南美洲
- 巴西
- 阿根廷
- 其他南美洲国家
- 欧洲
- 德国
- 英国
- 法国
- 义大利
- 俄罗斯
- 其他欧洲地区
- 亚太地区
- 中国
- 日本
- 韩国
- 印度
- ASEAN
- 亚太其他地区
- 中东和非洲
- 中东
- 沙乌地阿拉伯
- 阿拉伯聯合大公国
- 土耳其
- 其他中东地区
- 非洲
- 南非
- 奈及利亚
- 其他非洲地区
- 北美洲
第六章 竞争情势
- 市场集中度
- 策略趋势
- 市占率分析
- 公司简介
- Daikin Industries, Ltd.
- Mitsubishi Electric Corporation
- Panasonic Holdings Corporation
- Trane Technologies plc
- Carrier Global Corporation
- NIBE Industrier AB
- Glen Dimplex Group
- Viessmann Climate Solutions SE
- Stiebel Eltron GmbH & Co. KG
- Midea Group Co., Ltd.
- Guangdong Gree Electric Appliances Inc. of Zhuhai
- Haier Smart Home Co., Ltd.
- Bosch Thermotechnology GmbH(Robert Bosch GmbH)
- LG Electronics Inc.
- Lennox International Inc.
- Ariston Holding NV(Ariston Group)
- Samsung Electronics Co., Ltd.
- Rheem Manufacturing Company
- Johnson Controls International plc
- Viomi Technology Co., Ltd.
- AO Smith Corporation
- Ecoforest Geotermia SL
- WaterFurnace International, Inc.(NIBE Group)
- Danfoss A/S
- Vaillant GmbH
第七章 市场机会与未来趋势
- 閒置频段与未满足需求评估
The heat pump market size stood at USD 83.66 billion in 2025 and is forecast to advance to USD 131.67 billion by 2030, reflecting a 9.49% CAGR driven largely by policy-backed electrification targets and cold-climate technology breakthroughs.
Decarbonization mandates in Europe and North America, large federal and provincial incentive packages, and ever-larger utility-scale projects positioned the heat pump market as the leading replacement pathway for fossil-fuel-based space and water heating solutions. China's integrated manufacturing base held costs down while inverter-driven compressor advances narrowed performance gaps in sub-zero environments, setting the stage for rapid uptake in colder regions. Supply-chain localization efforts in the United States and Poland mitigated tariff and freight risks while growing "Heat-as-a-Service" finance models addressed steep upfront installation costs that had slowed adoption in existing buildings.
Global Heat Pumps Market Trends and Insights
Government decarbonization incentives and mandates
Aggressive policy frameworks created binding demand for heat pumps by tying building codes and subsidy levels directly to renewable heat outcomes. The US Inflation Reduction Act offered combined federal tax credits and state rebates as high as USD 14,000 per household, while Germany enforced its 65% renewable-heat requirement for all new heating systems starting in 2024. Canada's Oil to Heat Pump Affordability Program provided up to CAD 15,000 (USD 11,100) to lower-income homes, and the UK's Boiler Upgrade Scheme paid grants of up to GBP 7,500 (USD 9,400). These measures set artificial demand floors that shielded manufacturers from macroeconomic slowdowns and accelerated market penetration.
Electrification-driven HVAC replacement cycles
Local greenhouse gas caps in large cities condensed typical 15-20 year HVAC replacement intervals into fast-tracked retrofits that replace failing boilers with high-efficiency heat pumps. New York City's Local Law 97 triggered projects such as the retrofit of 345 Hudson Street, combining heat pumps and waste-heat recovery to hit a 70% emissions-cut target by 2030. Massachusetts Utilities launched the first US geothermal network in Framingham, connecting 135 customers in 2024 and demonstrating district-level electrification potential.
High installation and retrofitting costs in existing buildings
Total installed pricing diverged sharply by geography. Typical German row-house retrofits exceeded EUR 30,000 (USD 32,400), double France's post-subsidy cost because of higher labor expenses and stricter permitting rules. A New York multifamily case study showed that electrical panel upgrades alone amounted to 40% of the project cost, highlighting infrastructure hurdles that incentives cannot fully offset.
Other drivers and restraints analyzed in the detailed report include:
- Rapid cost declines in inverter-driven compressors
- Cold-climate heat pump technology breakthroughs
- Skilled installer shortage
For complete list of drivers and restraints, kindly check the Table Of Contents.
Segment Analysis
Air-source units held 73.5% heat pump market share in 2024 because of lower installation costs and product familiarity. However, the ground/geothermal category is forecast to post a 12.6% CAGR, the fastest within the spectrum, as utilities pilot networked loops such as the USD 14 million Framingham project that connected 135 customers in 2024. Advances in direct-expansion boreholes and shared ground loops improved COP stability above 4.0, increasing appeal in dense urban infill.
Air-source manufacturers continued to refine low-ambient algorithms, cutting performance drop-off at -20°F and unlocking northern growth. Meanwhile, utilities and large developers viewed geothermal systems as a hedge against grid-peak constraints because output is decoupled from outdoor temperature swings. These dynamics suggest gradual rebalancing, yet the heat pump market will still see air-source units dominate unit volumes through the forecast horizon.
Residential-scale systems up to 10 kW contributed 46.3% of 2024 shipments, reflecting the breadth of single-family adoption supported by consumer rebates. The above-30 kW class, however, is projected to outpace all others at a 12.4% CAGR as district heating and industrial process projects proliferate. Denmark's 70 MW Esbjerg seawater plant and Hamburg's 60 MW wastewater initiative highlight the momentum toward centralized mega-scale assets.
Small-capacity uptake will remain elevated because of standardized equipment and simplified permitting. Large-capacity momentum underscores the widening application perimeter that includes warehouses, food processing, and municipal networks aiming for carbon-neutral heat.
Heat Pump Market is Segmented by Source Type (Air-Source, Water-Source, and Ground/Geothermal Source), Rated Capacity (Up To 10 KW, 10-20 KW, and More), System Design (Split System, Monobloc, and Hybrid Heat Pump), End-User (Residential, Commercial, and More), Application (Space Heating and Cooling, Water Heating, and More), and Geography. The Market Forecasts are Provided in Terms of Value (USD).
Geography Analysis
Asia-Pacific retained a commanding 38.3% portion of the heat pump market in 2024, underpinned by China's 13% domestic sales growth and its 40% share of global production capacity, which yielded 12% unit-cost declines from factory automation gains. Japan's cautious 1% volume uptick and South Korea's compressor technology leadership stabilized regional shipments, while India remained nascent because tropical ambient conditions limited efficiency advantages for traditional designs.
Europe is on a rebound path, with an 11.1% CAGR projected after a 50% sales dip in early 2024 when Germany's heating-law debate dampened consumer confidence. France committed to producing 1 million units per year domestically, and Denmark showcased flagship district-scale projects, including the Esbjerg seawater plant, as part of its fossil-free-by-2030 pledge. The United Kingdom trailed installation targets despite rich GBP 7,500 grants, underscoring the role of infrastructure and skills barriers over pure economics.
North America entered a policy-assisted growth cycle after initial softness: US year-over-year sales climbed 15% by November 2024 following the Inflation Reduction Act incentives, while Canada processed more than 13,000 subsidy applications concentrated in Atlantic provinces. Supply-chain reshoring efforts, including Mitsubishi Electric's compressor factory and the Daikin-Copeland joint venture, aim to offset projected USD 250-275 million tariff exposure by localizing critical components.
- Daikin Industries, Ltd.
- Mitsubishi Electric Corporation
- Panasonic Holdings Corporation
- Trane Technologies plc
- Carrier Global Corporation
- NIBE Industrier AB
- Glen Dimplex Group
- Viessmann Climate Solutions SE
- Stiebel Eltron GmbH & Co. KG
- Midea Group Co., Ltd.
- Guangdong Gree Electric Appliances Inc. of Zhuhai
- Haier Smart Home Co., Ltd.
- Bosch Thermotechnology GmbH (Robert Bosch GmbH)
- LG Electronics Inc.
- Lennox International Inc.
- Ariston Holding N.V. (Ariston Group)
- Samsung Electronics Co., Ltd.
- Rheem Manufacturing Company
- Johnson Controls International plc
- Viomi Technology Co., Ltd.
- A. O. Smith Corporation
- Ecoforest Geotermia S.L.
- WaterFurnace International, Inc. (NIBE Group)
- Danfoss A/S
- Vaillant GmbH
Additional Benefits:
- The market estimate (ME) sheet in Excel format
- 3 months of analyst support
TABLE OF CONTENTS
1 INTRODUCTION
- 1.1 Study Assumptions and Market Definition
- 1.2 Scope of the Study
2 RESEARCH METHODOLOGY
3 EXECUTIVE SUMMARY
4 MARKET LANDSCAPE
- 4.1 Market Overview
- 4.2 Market Drivers
- 4.2.1 Government decarbonization incentives and mandates
- 4.2.2 Electrification-driven HVAC replacement cycles
- 4.2.3 Rapid cost declines in inverter-driven compressors
- 4.2.4 Grid-interactive heat pumps enabling demand-response revenue
- 4.2.5 Cold-climate heat pump technology breakthroughs
- 4.2.6 Heat-as-a-Service business models unlocking financing
- 4.3 Market Restraints
- 4.3.1 High installation and retrofitting costs in existing buildings
- 4.3.2 Skilled installer shortage
- 4.3.3 Electrical-panel and grid-capacity constraints in older housing stock
- 4.3.4 Competitive risk from hybrid hydrogen boilers in specific countries
- 4.4 Value / Supply-Chain Analysis
- 4.5 Regulatory Landscape
- 4.6 Technological Outlook
- 4.7 Impact of Macroeconomic Factors
- 4.8 Porter's Five Forces
- 4.8.1 Bargaining Power of Suppliers
- 4.8.2 Bargaining Power of Buyers
- 4.8.3 Threat of New Entrants
- 4.8.4 Threat of Substitute Products
- 4.8.5 Degree of Competition
5 MARKET SIZE AND GROWTH FORECASTS (VALUES)
- 5.1 By Source Type
- 5.1.1 Air-Source
- 5.1.1.1 Air-to-Air
- 5.1.1.2 Air-to-Water
- 5.1.2 Water-Source
- 5.1.2.1 Surface Water
- 5.1.2.2 Open Loop
- 5.1.3 Ground / Geothermal Source
- 5.1.3.1 Closed Loop Vertical
- 5.1.3.2 Closed Loop Horizontal
- 5.1.3.3 Direct Expansion
- 5.1.1 Air-Source
- 5.2 By Rated Capacity
- 5.2.1 Up to 10 kW
- 5.2.2 10-20 kW
- 5.2.3 20-30 kW
- 5.2.4 Above 30 kW
- 5.3 By System Design
- 5.3.1 Split System
- 5.3.2 Monobloc
- 5.3.3 Hybrid Heat Pump
- 5.4 By End-User
- 5.4.1 Residential
- 5.4.2 Commercial
- 5.4.3 Industrial
- 5.4.4 Institutional
- 5.5 By Application
- 5.5.1 Space Heating and Cooling
- 5.5.2 Water Heating
- 5.5.3 District Heating
- 5.5.4 Process and Industrial Heating
- 5.6 By Geography
- 5.6.1 North America
- 5.6.1.1 United States
- 5.6.1.2 Canada
- 5.6.1.3 Mexico
- 5.6.2 South America
- 5.6.2.1 Brazil
- 5.6.2.2 Argentina
- 5.6.2.3 Rest of South America
- 5.6.3 Europe
- 5.6.3.1 Germany
- 5.6.3.2 United Kingdom
- 5.6.3.3 France
- 5.6.3.4 Italy
- 5.6.3.5 Russia
- 5.6.3.6 Rest of Europe
- 5.6.4 Asia-Pacific
- 5.6.4.1 China
- 5.6.4.2 Japan
- 5.6.4.3 South Korea
- 5.6.4.4 India
- 5.6.4.5 ASEAN
- 5.6.4.6 Rest of Asia-Pacific
- 5.6.5 Middle East and Africa
- 5.6.5.1 Middle East
- 5.6.5.1.1 Saudi Arabia
- 5.6.5.1.2 United Arab Emirates
- 5.6.5.1.3 Turkey
- 5.6.5.1.4 Rest of Middle East
- 5.6.5.2 Africa
- 5.6.5.2.1 South Africa
- 5.6.5.2.2 Nigeria
- 5.6.5.2.3 Rest of Africa
- 5.6.1 North America
6 COMPETITIVE LANDSCAPE
- 6.1 Market Concentration
- 6.2 Strategic Moves
- 6.3 Market Share Analysis
- 6.4 Company Profiles (includes Global level Overview, Market level overview, Core Segments, Financials as available, Strategic Information, Market Rank/Share for key companies, Products and Services, and Recent Developments)
- 6.4.1 Daikin Industries, Ltd.
- 6.4.2 Mitsubishi Electric Corporation
- 6.4.3 Panasonic Holdings Corporation
- 6.4.4 Trane Technologies plc
- 6.4.5 Carrier Global Corporation
- 6.4.6 NIBE Industrier AB
- 6.4.7 Glen Dimplex Group
- 6.4.8 Viessmann Climate Solutions SE
- 6.4.9 Stiebel Eltron GmbH & Co. KG
- 6.4.10 Midea Group Co., Ltd.
- 6.4.11 Guangdong Gree Electric Appliances Inc. of Zhuhai
- 6.4.12 Haier Smart Home Co., Ltd.
- 6.4.13 Bosch Thermotechnology GmbH (Robert Bosch GmbH)
- 6.4.14 LG Electronics Inc.
- 6.4.15 Lennox International Inc.
- 6.4.16 Ariston Holding N.V. (Ariston Group)
- 6.4.17 Samsung Electronics Co., Ltd.
- 6.4.18 Rheem Manufacturing Company
- 6.4.19 Johnson Controls International plc
- 6.4.20 Viomi Technology Co., Ltd.
- 6.4.21 A. O. Smith Corporation
- 6.4.22 Ecoforest Geotermia S.L.
- 6.4.23 WaterFurnace International, Inc. (NIBE Group)
- 6.4.24 Danfoss A/S
- 6.4.25 Vaillant GmbH
7 MARKET OPPORTUNITIES AND FUTURE TRENDS
- 7.1 White-space and Unmet-need Assessment
 工业热泵市场机会、成长驱动因素、产业趋势分析及预测(2025-2034年)
 大型天然冷媒热泵市场:依冷媒类型、热源、压缩机类型、容量范围、配置、应用和分销通路划分-全球预测,2025-2032年
 泳池热泵市场-全球产业规模、份额、趋势、机会和预测(按类型、按容量、按最终用户、按地区和竞争,2020-2030 年)空气源热泵市场-全球产业规模、份额、趋势、机会及预测(依製程、最终用途、销售通路、地区及竞争状况,2020-2030 年)
 2025年全球热泵市场报告2025年大型天然冷媒热泵全球市场报告水产养殖热泵机组市场按产品类型、技术类型、容量、分销管道、应用和最终用户划分-2025-2030 年全球预测热泵市场按类型、技术、容量、安装类型、应用、最终用户和分销管道划分-2025-2030 年全球预测
 全球水源热泵市场全球泳池热泵市场