


 |
市场调查报告书
商品编码
1852017
体育分析:市场份额分析、行业趋势、统计数据和成长预测(2025-2030 年)Sports Analytics - Market Share Analysis, Industry Trends & Statistics, Growth Forecasts (2025 - 2030) |
||||||
※ 本网页内容可能与最新版本有所差异。详细情况请与我们联繫。
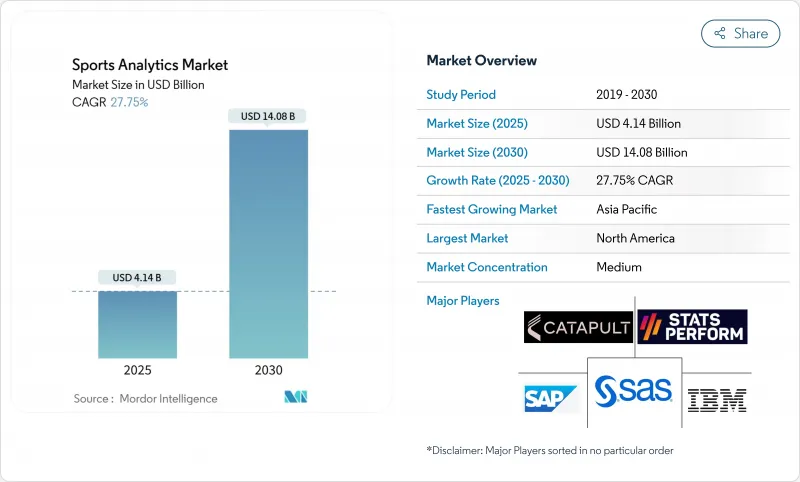
据估计,体育分析市场规模将在 2025 年达到 41.4 亿美元,在 2030 年达到 140.8 亿美元,2025 年至 2030 年的复合年增长率为 27.75%。
体育博彩的扩张需要三大支撑因素:更经济的感测器、弹性云容量以及不断完善的体育博彩法律体制。如今,特许经营商将基于数据的决策视为日常风险管理的一部分,因此分析预算已成为销售预测中的累计项目,而非实验性计划。随着俱乐部倾向于选择拥有成熟隐私控制机制的合作伙伴以降低未来合规风险,供应商整合正在加速。更长的合约期限提高了对经常性收入的可见性,表明分析已成为更广泛的体育技术体系中不可或缺的一部分。
全球运动分析市场趋势与洞察
物联网感测器可实现即时追踪
全场射频追踪技术在国家美式足球联盟(NFL)的场馆中,能够捕捉每位球员每次进攻回合超过200个位置数据点,使教练团能够将即时压力指标转化为伤病预防策略。同样的数据流还能为球迷提供扩增实境互动体验,并创造新的赞助机会,而无需额外的硬体投入。随着标籤价格的下降,美国各地的大学计画都在部署同样的基础设施,将体育分析市场从精英扩展到更广泛的范围。准入门槛的降低表明,遥测技术很快就会成为整个体育体系的基本需求。广播合作伙伴正在购买相同直播串流的授权,用于迭加图形,这证明单一资料集可以支援多种收入来源。
用于转让评估的集中式资料仓储
欧洲足球俱乐部正将球探数据、运动科学数据、门票销售数据和商业数据整合到一个统一的资料库中,以规范球员评估模型。奥卢足球俱乐部于2024年实施的TransferLab系统,使规模较小的俱乐部能够将自身球员与全球18万家同行进行比较,从而增强自身在转会谈判中的地位。学术网路科学研究表明,在转会网络中占据中心位置的俱乐部,其营运绩效往往优于其工资支出。因此,数据获取正在缩小历史遗留的实力差距,并扩大竞争范围。严谨的估值逻辑正在取代直觉,投资人也将资料仓储计划视为股权结构资产,而非可自由支配的IT升级专案。
GDPR/CCPA 对生物辨识资料的限制
欧洲和加州的隐私法规强调知情同意、最小化处理和目的限制,这促使供应商重新设计工作流程,围绕边缘处理技术,在将原始生物特征数据传输到云端之前,将其转换为匿名风险评分。那些首次通过审核的俱乐部现在会在争取赞助时强调其合规性,使法律要求成为品牌差异化优势。然而,额外的工程时间会减缓技术的普及,并在短期内减缓体育分析市场的成长。那些迅速采用「隐私设计」的供应商将获得价格优势,随着规避风险的俱乐部转向成熟的供应商,这将加速产业整合。
细分市场分析
预计到2030年,板球细分市场规模将以25%的复合年增长率增长,这主要得益于能够将竞标上限与球员表现差异相匹配的竞标,以及能够优化投球手轮换的精细化球路追踪技术。相较之下,到2024年,足球仍将占据体育分析市场规模的最大份额。板球协会的数据应用已将用户群扩展到主要特许经营球队之外,使供应商能够将获客成本分摊到庞大的客户群中。儘管足球仍然是定价标桿,但板球的成长表明,多运动供应商将优先考虑跨领域蓝图,以抓住新兴细分市场的成长潜力。
到2024年,软体授权将占体育分析市场份额的65%。然而,随着俱乐部聘请整合服务商将传统赛事系统与即时资料湖融合,专业服务预计将以24%的复合年增长率成长。基于结果的定价模式(根据胜场数、门票销售量和赞助成长情况调整费用)将风险转移给供应商,并激励他们进行更深入的咨询工作。经常性管理服务收入可以缓解领先许可费的周期性波动,从而为高效协调资料科学人员的供应商创造利润空间。这种转变表明,在预测期内,体育分析产业的产品与服务之间的界线将变得模糊。
体育分析市场按运动项目(足球、板球、篮球等)、组件(软体、服务)、部署方式(本地部署、云端部署)、最终用户(运动队/俱乐部、联赛/联合会、运动员、体育博彩运营商等)和地区进行细分。市场预测以美元计价。
区域分析
到2024年,北美将占总收入的33.21%,这将推动对低延迟数据的持续需求,而成熟的特许经营估值模型和各州逐步放宽的博彩监管政策也为此提供了支持。所有美国国家美式足球联盟(NFL)场馆都安装了覆盖整个体育场的接收器阵列,由此催生了校准、维护和生命週期更换等配套服务市场。诸如「数位运动员倡议」等以数据主导的伤病预防项目,展现了官民合作关係如何加速科技的普及应用。
亚太地区预计将以26%的成长速度成为成长最快的地区,这主要得益于板球运动的商业性实力和行动优先的消费模式。电讯正将零流量的体育赛事直播捆绑到资料方案中,有效地补贴了用于数据分析回程传输的频宽。印度、日本和澳洲政府正在资助运动员健康津贴,用于购买穿戴式装置以备战奥运会,从而提高消费者和专业运动员对运动表现指标的认知。 OTT平台正利用媒体端的分析技术,透过高度个人化的观众数据来增加观看时间并降低用户流失率,从而推动区域体育分析市场的扩张。
欧洲依然是创新的熔炉。足球五大联赛的架构正在率先采用联合数据架构,在更接近数据源的位置处理敏感数据,这是为了应对GDPR(通用数据保护规范),该条例已在全球范围内推广了增强隐私的分析技术。源自英格兰、西班牙和德国的转会费估值模型正透过参考资料仓储基准的租借费条款,传播到新兴的南美联赛。同时,拉丁美洲和中东及非洲地区的发展轨迹呈现出双轨制:旗舰品牌部署企业级技术栈以最大化转播权收益,而规模较小的公司则采用模组化订阅模式,以确保收入的确定性。
其他福利:
- Excel格式的市场预测(ME)表
- 3个月的分析师支持
目录
第一章 引言
- 研究假设和市场定义
- 调查范围
第二章调查方法
第三章执行摘要
第四章 市场情势
- 市场概览
- 市场驱动因素
- 利用物联网感测器进行即时追踪,推动了北美职业联赛的需求。
- 欧洲足球俱乐部强制要求建立集中式资料仓储,用于转会评估。
- 美国合法化后的体育博彩数据伙伴关係
- 印度和澳洲板球联赛中特许经营主导的分析方法应用
- 市场限制
- 南美洲和非洲二线俱乐部的技术预算有限
- GDPR/CCPA对生物辨识资料收集的限制
- 技术展望
- 监理展望
- 波特五力分析
- 供应商的议价能力
- 消费者议价能力
- 新进入者的威胁
- 竞争对手之间的竞争
- 替代品的威胁
第五章 市场规模与成长预测
- 体育运动
- 足球
- 蟋蟀
- 篮球
- 曲棍球
- 美国美式足球
- 棒球
- 橄榄球
- 其他运动
- 按组件
- 软体
- 服务
- 透过部署
- 本地部署
- 云
- 最终用户
- 运动队伍/俱乐部
- 联盟和联合会
- 个人运动员
- 体育博彩营运商
- 其他的
- 按地区
- 北美洲
- 美国
- 加拿大
- 墨西哥
- 南美洲
- 巴西
- 阿根廷
- 其他南美洲国家
- 欧洲
- 德国
- 英国
- 法国
- 义大利
- 西班牙
- 其他欧洲地区
- 亚太地区
- 中国
- 日本
- 韩国
- 印度
- 亚太其他地区
- 中东和非洲
- 阿拉伯聯合大公国
- 沙乌地阿拉伯
- 南非
- 其他中东和非洲地区
- 北美洲
第六章 竞争情势
- 策略趋势
- Vendor Positioning Analysis
- 公司简介
- IBM Corporation
- SAP SE
- SAS Institute Inc.
- Oracle Corporation
- Microsoft Corporation
- Stats Perform(Opta)
- Catapult Group International Ltd
- Sportradar AG
- Genius Sports Group
- Zebra Technologies Corp.
- Kinexon GmbH
- Second Spectrum Inc.
- Hudl(Agile Sports)
- Wyscout Srl
- Zelus Analytics
- ChyronHego Corp.
- Hawk-Eye Innovations Ltd
- Tableau Software LLC
- Sportlogiq
- Strivr Labs Inc.
- Zone7 AI Ltd
- Synergy Sports Technology
- Kitman Labs
- Orreco Ltd
第七章 市场机会与未来展望
The Sports Analytics market size is estimated at USD 4.14 billion in 2025, and is on course to reach USD 14.08 billion by 2030, delivering a 27.75% CAGR between 2025 and 2030.
Expansion rests on three reinforcing forces: cheaper sensors, elastic cloud capacity, and widening legal sports-betting frameworks. Franchise owners now view evidence-based decision making as routine risk management, so analytics budgets appear as line items in operating forecasts rather than as experimental projects. Vendor consolidation is gathering pace because clubs prefer partners with mature privacy controls that reduce future compliance exposure. Lengthening contract terms are lifting recurring revenue visibility, indicating that analytics has become an indispensable layer in the broader sports technology stack.
Global Sports Analytics Market Trends and Insights
Real-time Tracking Enabled by IoT Sensors
Full-field radio-frequency tracking now captures more than 200 positional data points per player on every down in National Football League venues, allowing coaching staff to translate real-time load indicators into injury-mitigation strategies . The same feeds power augmented-reality activations for fans, creating new sponsorship inventory without extra hardware outlay. As tag prices fall, collegiate programs across the United States are rolling out identical infrastructure, expanding the Sports Analytics market beyond elite tiers. Falling barriers suggest that telemetry will soon be a baseline requirement across the organised sports pyramid. Broadcast partners license identical raw streams for overlay graphics, proving that a single dataset can underpin multiple revenue chains.
Centralised Data Warehousing for Transfer Valuation
European football clubs consolidate scouting, sports science, ticketing, and commercial data in unified repositories to standardise player valuation models. AC Oulu's 2024 deployment of TransferLab lets a small-market side benchmark talent against 180,000 global peers, strengthening its position in transfer negotiations. Academic network-science work shows that clubs holding central positions in the transfer network consistently outperform wage-bill . The result is a broadening of competitive participation, as data access narrows historical power gaps. Rigorous valuation logic is replacing intuition, and investors view warehouse projects as cap-table assets rather than discretionary IT upgrades.
GDPR/CCPA Constraints on Biometric Data
European and Californian privacy regulations insist on consent, minimisation, and purpose limitation, driving suppliers to redesign workflows around edge processing that converts raw biometrics into anonymised risk scores before cloud transit. Clubs that achieve an audit pass on first attempt now reference compliance in sponsorship pitches, turning a legal requirement into a brand differentiator. However, extra engineering time slows deployment, trimming aggregate Sports Analytics market growth in the near term. Vendors that embedded privacy-by-design early have a pricing advantage that accelerates industry consolidation, as risk-averse clubs converge on proven providers.
Other drivers and restraints analyzed in the detailed report include:
- Sports-Betting Data Partnerships
- Franchise-Driven Analytics in Cricket
- Limited Tech Budgets of Tier-2 Clubs
For complete list of drivers and restraints, kindly check the Table Of Contents.
Segment Analysis
Cricket's segment market size is projected to log a 25% CAGR to 2030, powered by auction simulators that align bid ceilings with performance variance and by granular ball-tracking that optimises bowler rotation. In contrast, football retained the largest share of the Sports Analytics market size in 2024 because every top-tier club already embeds analytics teams in transfer, medical, and commercial units. Data adoption by associate cricket boards now widens penetration beyond marquee franchises, letting providers amortise acquisition costs over a long-tail customer base. Football still sets pricing benchmarks, yet cricket's growth suggests that multi-sport vendors will prioritise cross-disciplinary roadmaps to capture upside in emerging segments.
Software licenses contributed 65% of the Sports Analytics market share in 2024, reflecting entrenched platform fees. Professional services, however, are forecast to grow at a 24% CAGR as clubs ask for integration work that melds legacy tournament systems with real-time data lakes. Outcome-based pricing models that scale fees to wins, ticket yield, or sponsorship lift transfer risk to vendors, motivating them to deepen consulting practices. As recurring managed-service revenue smooths the cyclical nature of up-front licenses, margin accrues to providers that coordinate data-science staffing efficiently. The shift suggests that the Sports Analytics industry will blur product and service lines over the forecast period.
Sports Analytics Market is Segmented by Sport (Football, Cricket, Basketball, and More), Component (Software, Services), Deployment (On-Premise, Cloud), End User (Sports Teams/Clubs, Leagues and Federations, Individual Athletes, Sports Betting Operators, Others), Geography. The Market Forecasts are Provided in Terms of Value (USD).
Geography Analysis
North America controlled 33.21% revenue in 2024, underpinned by mature franchise valuation models and state-by-state betting liberalisation that fuels continuous demand for low-latency data. Stadium-wide receiver arrays in every National Football League venue have created ancillary service markets for calibration, maintenance, and lifecycle replacement. Data-driven injury-mitigation programs such as the Digital Athlete initiative illustrate how public-private partnerships accelerate adoption.
Asia-Pacific posts the fastest forecast growth at 26%, buoyed by cricket's commercial heft and mobile-first consumption patterns. Telecom operators bundle zero-rated live sport into data plans, effectively subsidising bandwidth for analytics backhaul. Governments in India, Japan, and Australia fund athlete-wellness grants that underwrite wearable purchases for Olympic preparation, lifting awareness of performance metrics across consumer and professional tiers. OTT platforms use hyper-personalised viewer data to increase watch-time and reduce churn, making media-side analytics a driver of regional Sports Analytics market expansion.
Europe remains an innovation crucible. Clubs in the top five football leagues pioneer federated data architectures that process sensitive material closer to source, a response to GDPR that has broadened privacy-enhanced analytics techniques worldwide. Transfer valuation models created in England, Spain, and Germany spread to emerging South American leagues via loan-fee clauses that reference warehouse benchmarks. Meanwhile, Latin America and the Middle East & Africa follow a dual-track trajectory: flagship brands install enterprise-grade stacks to maximise broadcast rights, while smaller organisations adopt modular subscriptions priced for revenue certainty.
- IBM Corporation
- SAP SE
- SAS Institute Inc.
- Oracle Corporation
- Microsoft Corporation
- Stats Perform (Opta)
- Catapult Group International Ltd
- Sportradar AG
- Genius Sports Group
- Zebra Technologies Corp.
- Kinexon GmbH
- Second Spectrum Inc.
- Hudl (Agile Sports)
- Wyscout Srl
- Zelus Analytics
- ChyronHego Corp.
- Hawk-Eye Innovations Ltd
- Tableau Software LLC
- Sportlogiq
- Strivr Labs Inc.
- Zone7 AI Ltd
- Synergy Sports Technology
- Kitman Labs
- Orreco Ltd
Additional Benefits:
- The market estimate (ME) sheet in Excel format
- 3 months of analyst support
TABLE OF CONTENTS
1 INTRODUCTION
- 1.1 Study Assumptions and Market Definition
- 1.2 Scope of the Study
2 RESEARCH METHODOLOGY
3 EXECUTIVE SUMMARY
4 MARKET LANDSCAPE
- 4.1 Market Overview
- 4.2 Market Drivers
- 4.2.1 Real-time Tracking Enabled by IoT Sensors Driving Demand in North-American Professional Leagues
- 4.2.2 Centralised Data Warehousing Mandates from European Football Clubs for Transfer Valuation
- 4.2.3 Sports-Betting Data Partnerships Post-Legalisation in the United States
- 4.2.4 Franchise-Driven Analytics Adoption in Indian and Australian Cricket Leagues
- 4.3 Market Restraints
- 4.3.1 Limited Tech Budgets of Tier-2 Clubs in South America and Africa
- 4.3.2 GDPR/CCPA Constraints on Biometric Data Collection
- 4.4 Technology Outlook
- 4.5 Regulatory Outlook
- 4.6 Porter's Five Forces Analysis
- 4.6.1 Bargaining Power of Suppliers
- 4.6.2 Bargaining Power of Consumers
- 4.6.3 Threat of New Entrants
- 4.6.4 Intensity of Competitive Rivalry
- 4.6.5 Threat of Substitutes
5 MARKET SIZE AND GROWTH FORECASTS (VALUE)
- 5.1 By Sport
- 5.1.1 Football (Soccer)
- 5.1.2 Cricket
- 5.1.3 Basketball
- 5.1.4 Hockey
- 5.1.5 American Football
- 5.1.6 Baseball
- 5.1.7 Rugby
- 5.1.8 Other Sports
- 5.2 By Component
- 5.2.1 Software
- 5.2.2 Services
- 5.3 By Deployment
- 5.3.1 On-Premise
- 5.3.2 Cloud
- 5.4 By End User
- 5.4.1 Sports Teams/Clubs
- 5.4.2 Leagues and Federations
- 5.4.3 Individual Athletes
- 5.4.4 Sports Betting Operators
- 5.4.5 Others
- 5.5 By Geography
- 5.5.1 North America
- 5.5.1.1 United States
- 5.5.1.2 Canada
- 5.5.1.3 Mexico
- 5.5.2 South America
- 5.5.2.1 Brazil
- 5.5.2.2 Argentina
- 5.5.2.3 Rest of South America
- 5.5.3 Europe
- 5.5.3.1 Germany
- 5.5.3.2 United Kingdom
- 5.5.3.3 France
- 5.5.3.4 Italy
- 5.5.3.5 Spain
- 5.5.3.6 Rest of Europe
- 5.5.4 Asia-Pacific
- 5.5.4.1 China
- 5.5.4.2 Japan
- 5.5.4.3 South Korea
- 5.5.4.4 India
- 5.5.4.5 Rest of Asia-Pacific
- 5.5.5 Middle East and Africa
- 5.5.5.1 United Arab Emirates
- 5.5.5.2 Saudi Arabia
- 5.5.5.3 South Africa
- 5.5.5.4 Rest of Middle East and Africa
- 5.5.1 North America
6 COMPETITIVE LANDSCAPE
- 6.1 Strategic Moves
- 6.2 Vendor Positioning Analysis
- 6.3 Company Profiles (includes Global level Overview, Market level overview, Core Segments, Financials as available, Strategic Information, Products and Services, and Recent Developments)
- 6.3.1 IBM Corporation
- 6.3.2 SAP SE
- 6.3.3 SAS Institute Inc.
- 6.3.4 Oracle Corporation
- 6.3.5 Microsoft Corporation
- 6.3.6 Stats Perform (Opta)
- 6.3.7 Catapult Group International Ltd
- 6.3.8 Sportradar AG
- 6.3.9 Genius Sports Group
- 6.3.10 Zebra Technologies Corp.
- 6.3.11 Kinexon GmbH
- 6.3.12 Second Spectrum Inc.
- 6.3.13 Hudl (Agile Sports)
- 6.3.14 Wyscout Srl
- 6.3.15 Zelus Analytics
- 6.3.16 ChyronHego Corp.
- 6.3.17 Hawk-Eye Innovations Ltd
- 6.3.18 Tableau Software LLC
- 6.3.19 Sportlogiq
- 6.3.20 Strivr Labs Inc.
- 6.3.21 Zone7 AI Ltd
- 6.3.22 Synergy Sports Technology
- 6.3.23 Kitman Labs
- 6.3.24 Orreco Ltd
7 MARKET OPPORTUNITIES AND FUTURE OUTLOOK
- 7.1 White-Space and Unmet-Need Assessment
 2026年全球体育分析市场报告
 2026-2030年全球运动分析市场
 体育分析市场分析及预测(至2035年):按类型、产品、技术、组件、应用、设备、流程、最终用户、解决方案和部署类型划分
 全球体育分析市场规模、份额、趋势和成长分析报告(2026-2034)
 体育分析市场报告:按组件、分析类型、运动项目和地区划分(2026-2034 年)
 体育分析工具市场:按交付方式、运动项目、应用和最终用户划分,全球预测(2026-2032)
 体育分析市场-全球产业规模、份额、趋势、机会和预测(按类型、解决方案、解决方案类型、最终用户、地区和竞争格局划分,2021-2031年预测)运动分析市场规模、占有率、成长及全球产业分析:依类型、应用和地区划分的洞察与预测(2026-2034)日本体育分析市场规模、份额、趋势及预测(按组件、分析类型、运动项目及地区划分,2026-2034年)
 体育分析市场规模、份额和成长分析(按组件、模式、类型、应用、最终用户和地区划分)—产业预测,2026-2033年