


 |
市场调查报告书
商品编码
1852057
空气清净机:市场份额分析、行业趋势、统计数据和成长预测(2025-2030 年)Air Purifier - Market Share Analysis, Industry Trends & Statistics, Growth Forecasts (2025 - 2030) |
||||||
※ 本网页内容可能与最新版本有所差异。详细情况请与我们联繫。
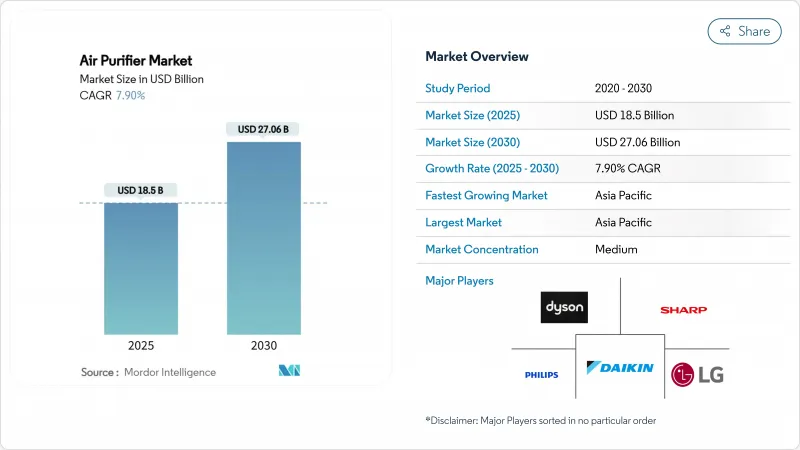
预计到 2025 年,空气清净机市场规模将达到 185 亿美元,到 2030 年将达到 270.6 亿美元,预测期(2025-2030 年)复合年增长率为 7.90%。
随着消费者将呼吸健康、节能建筑和产品品质置于优先地位,需求正从注重健康的消费转向家庭、办公室、医院和半导体无尘室等关键基础设施的支出。超洁净半导体工厂的技术溢出效应、日益严重的城市污染预警以及疫情后人们环保意识的提高,都推动了空气清净机市场的稳定成长。亚太地区的成长依然强劲,这主要得益于印度的公共补贴、中国城市消费者的积极响应以及日本和韩国严格的空气品质法规。智慧家庭的普及也在北美和欧洲同步推进,连网型设备在不牺牲大众市场销售的前提下,为市场带来了新的净利率。
全球空气清净机市场趋势与洞察
东亚都市区新冠疫情后健康中心设备的采用情况
一项家庭调查显示,中国主要城市62%的家庭认为空气清净机是必需品而非可有可无的物品。对颗粒物控制的需求以及对病原体日益增长的担忧,推动了结合高效能空气微粒过滤器(HEPA)和紫外线C波段(UV-C)或光催化氧化的多层解决方案的发展。对韩国2025年的分析表明,环境PM2.5浓度峰值与空气清净机週销售量激增之间存在直接关联,凸显了室内防护需求的上升趋势。随着该地区智慧家庭普及率接近75%,连网设备因其即时空气品质回馈和自主运作功能而备受青睐。
北美地区收紧PM2.5商业房地产标准(LEED v4.1)
美国拟议将PM2.5年均浓度标准从9-10µg/m3提高到9-10µg/m3,这将迫使建筑物业主安装主动净化设备,以配合MERV等级的HVAC过滤器。一项针对37个都市区办公大楼的实地研究表明,仅靠中央通风系统无法达到新基准值,因此促使这些办公大楼安装可携式或管道式净化设备,用于记录颗粒物浓度并进行认证。这些合规法规反映了企业对长期环境的迫切需求,远远超出週期性的消费趋势。
加州和日本的离子产生器臭氧排放法规
加州已禁止使用臭氧排放量超过0.050 ppm的空气清净器,这实际上淘汰了基于离子发生器的产品。日本也实施了包含多种污染物的室内空气品质标准,带来了类似的挑战。製造商必须围绕紫外线C波段或光催化阶段重新设计其平台,这将增加研发成本并延长产品上市週期。
细分市场分析
儘管HEPA过滤器在2024年仍占据空气清净机市场69%的份额,但新兴的UV-C和光催化产品预计到2030年将以每年9.5%的速度成长。多级混合型空气清净机结合了粒状物捕获和杀菌光,为注重健康的消费者提供差异化产品。在国际紫外线协会会议上发布的创新技术展示了UV-C LED,该技术在不牺牲病毒灭活效果的前提下降低了能耗。光催化系统利用二氧化钛涂层氧化惰性有机化合物,但监管机构正在密切监测其潜在的副产物。随着这些混合型系统的规模化发展,先进过滤解决方案的空气清净机市场规模预计将随着新一代健康标准的提高而成长。高端市场正在兴起,医用级性能成为标配,这将拉低基础HEPA产品线的单件利润率,但会增加高端产品的总收入。
由于即插即用的便利性和直觉的运作回馈,便携式空气清净机到2024年将占据空气清净机市场81%的份额。能源模型显示,房间级空气清净机达到美国疾病管制与预防中心(CDC)洁净空气标准时,能耗低于整组暖通空调系统改造。然而,商业整修越来越倾向于采用管道式解决方案,这种方案可以巧妙地融入现有通风管道,并减少占地面积杂物。到2030年,集中式空气净化系统的复合年增长率将达到8.6%,这主要得益于日益严格的商业建筑规范。在新建筑中,集中式空气清净机的市场规模可能与可携式空气清净机趋于一致,但在老旧住宅存量中,可携式清净机的需求仍将保持强劲。
空气清净机市场报告按过滤技术(HEPA、活性碳、离子/静电集尘器、UV-C 和光催化氧化、混合和多级系统)、类型(独立式和管道式)、最终用户(住宅、商业、工业)、连接方式(非智能和智能/物联网)以及地区(北美、欧洲、亚太、南美、中东和非洲)进行细分。
区域分析
亚太地区将在2024年占全球营收的44%,并在2030年之前维持9.1%的强劲复合年增长率。随着全国PM2.5宣传活动和消费者健康应用将空气品质问题置于首要位置,中国一线城市的空气清净机普及率将超过60%。印度的国家清洁空气计画将为公立学校提供HEPA高效空气过滤器,从而提振公共部门的可靠销售,而冬季雾霾也将促进住宅销售。日本和韩国目前优先考虑病毒惰性和智慧家居集成,这促使消费者转向混合型UV-C平台。
北美仍然是一个规模庞大且技术娴熟的市场。加州的臭氧法规限制了帽式离子产生器的销售,但也推动了光催化氧化和先进HEPA等更安全技术的发展。美国的平均售价位居世界最高,反映出其大力推广应用程式主导模式,以及为获得LEED v4.1认证而对企业健康设施的投入。加拿大也呈现类似的趋势,但暖气季的能源成本促使人们更加关注节能设计。
在欧洲,消费者的偏好各不相同。北欧消费者优先考虑能源效率等级和静音运行,而地中海地区的消费者则更关注过敏原和野火烟雾。欧盟的「近零能耗建筑指令」促使人们更加依赖高效能空气清净器,以弥补较低的空气交换率和更严格的建筑围护结构要求。东欧的成长落后于西欧,但随着都市区雾霾引发大众意识提升提升,东欧的成长将会復苏。在中东和非洲,海湾合作委员会国家的大型酒店计划将推动高端产品的需求,而不断增长的可支配收入和经济高效的过滤器供应链将促进空气清净机的更广泛应用。
其他福利:
- Excel格式的市场预测(ME)表
- 3个月的分析师支持
目录
第一章 引言
- 研究假设和市场定义
- 调查范围
第二章调查方法
第三章执行摘要
第四章 市场情势
- 市场概览
- 市场驱动因素
- 在东亚大都会地区分发新冠疫情后以健康为重点的设备
- 北美地区收紧PM2.5商业房地产标准(LEED v4.1)
- 美国和韩国正在提高半导体洁净室的生产能力。
- 欧盟和美国对智慧家庭整合和连网水质净化的需求日益增长
- 海湾合作委员会地区以环境、社会和治理(ESG)主导的酒店业发展
- 印度国家清洁空气计画(NCAP)为公立学校提供HEPA空气清净机补贴
- 市场限制
- 加州和日本的离子产生器臭氧排放法规
- 东协大众市场对滤芯更换成本高度敏感
- 消费者对CADR声明的怀疑:缺乏统一的测试通讯协定
- 大型办公室对暖通空调管道过滤器和独立式过滤器的需求下降
- 供应链分析
- 监理展望
- 技术展望
- 波特五力分析
- 供应商的议价能力
- 买方的议价能力
- 新进入者的威胁
- 替代品的威胁
- 竞争对手之间的竞争
第五章 市场规模与成长预测
- 透过过滤技术
- HEPA
- 活性碳
- 离子/静电分离器
- 紫外光和光催化氧化
- 混合/多层次系统
- 按类型
- 独立式/可携式
- 管道式/中央空调
- 连结性别
- 非智慧型(手动/类比)
- 智慧/物联网功能(应用程式和语音控制)
- 最终用户
- 住宅
- 商业(旅馆及休閒、医疗设施及诊所、教育机构、公司办公室及零售)
- 工业(製造/仓储、食品/饮料加工、製药/无尘室、资料中心/伺服器机房)
- 按地区
- 北美洲
- 美国
- 加拿大
- 墨西哥
- 欧洲
- 英国
- 德国
- 法国
- 西班牙
- 北欧国家
- 俄罗斯
- 其他欧洲地区
- 亚太地区
- 中国
- 印度
- 日本
- 韩国
- 东南亚国协
- 澳洲
- 亚太其他地区
- 南美洲
- 巴西
- 阿根廷
- 哥伦比亚
- 其他南美洲
- 中东和非洲
- 阿拉伯聯合大公国
- 沙乌地阿拉伯
- 南非
- 埃及
- 其他中东和非洲地区
- 北美洲
第六章 竞争情势
- 市场集中度
- 策略性倡议(併购、伙伴关係、购电协议)
- 市场占有率分析(主要企业的市场排名/份额)
- 公司简介
- Daikin Industries Ltd
- Sharp Corporation
- Dyson Ltd
- Koninklijke Philips NV
- LG Electronics Inc.
- Panasonic Corporation
- Whirlpool Corporation
- Resideo Technologies Inc.
- Samsung Electronics Co. Ltd
- Xiaomi Corp.
- Honeywell International Inc.
- IQAir AG
- Coway Co. Ltd
- Winix Inc.
- Blueair AB
- AllerAir Industries Inc.
- Airdog(IAQ Tech)
- Austin Air Systems Ltd
- Kent RO Systems Ltd
- TruSens(ACCO Brands)
- Medify Air LLC
第七章 市场机会与未来展望
The Air Purifier Market size is estimated at USD 18.5 billion in 2025, and is expected to reach USD 27.06 billion by 2030, at a CAGR of 7.90% during the forecast period (2025-2030).
Demand has shifted from wellness-oriented purchases to critical infrastructure spending in homes, offices, hospitals, and semiconductor cleanrooms as users prioritize respiratory health, energy-efficient buildings, and production quality. Technology spillovers from ultra-clean semiconductor fabs, rising urban pollution alerts, and intensifying post-pandemic awareness keep the air purifier market on a steady expansion path. Regional growth remains most pronounced in Asia-Pacific thanks to public subsidies in India, urban consumer sentiment in China, and stringent air-quality mandates in Japan and South Korea. Parallel momentum comes from smart-home adoption in North America and Europe, where connected devices unlock new margins without sacrificing volume at the mass-market tier.
Global Air Purifier Market Trends and Insights
Post-COVID health-centric device adoption in East Asian metros
Household surveys indicate that 62% of families in large Chinese cities now view air purifiers as essential goods rather than discretionary items. Convergence of particulate-control needs with heightened pathogen concerns drives multi-stage solutions that blend HEPA with UV-C or photocatalytic oxidation. South Korean analyses for 2025 show a direct correlation between ambient PM2.5 peaks and weekly purifier sales spikes, underscoring the behavioral pivot toward indoor protection. As smart-home penetration in the region nears 75%, connected units gain preference for real-time air-quality feedback and automated operation.
Stricter PM2.5 commercial real-estate standards in North America (LEED v4.1)
The proposed revision of the US annual PM2.5 standard to 9-10 µg/m3 pressures building owners to install active purification that supplements MERV-rated HVAC filters. Field studies of 37 urban offices show that centralized ventilation alone falls short of emerging thresholds, prompting uptake of portable or in-duct purifiers that log particulate levels for certification audits. These compliance imperatives sustain institutional demand well beyond cyclical consumer trends.
Ozone-emission restrictions on ionizers in California & Japan
California forbids air cleaner that releases more than 0.050 ppm ozone, effectively sidelining ionizer-centric products. Japan enforces multi-pollutant indoor guidelines that create similar hurdles. Manufacturers must redesign platforms around UV-C or photocatalytic stages, lifting R&D expenditure and elongating launch cycles.
Other drivers and restraints analyzed in the detailed report include:
- Semiconductor clean-room capacity build-out in the United States & South Korea
- Smart-home integration pull for connected purifiers in Europe & United States
- High filter-replacement cost sensitivity in ASEAN mass market
For complete list of drivers and restraints, kindly check the Table Of Contents.
Segment Analysis
HEPA maintained a 69% air purifier market share in 2024, yet emerging UV-C and photocatalytic products are expected to expand at 9.5% annually through 2030. Multi-stage hybrids pair particulate capture with germicidal light, creating differentiated offerings for health-conscious buyers. Innovations unveiled at the International Ultraviolet Association conference reveal UV-C LEDs that cut power draw without sacrificing virus inactivation. Photocatalytic systems leverage titanium dioxide coatings to oxidize volatile organics, though regulators keep watch on potential by-products. As these hybrid systems scale, the air purifier market size for advanced filtration solutions is projected to climb with next-generation health standards. A premium tier emerges where medical-grade performance becomes the norm, pushing down per-unit margins in basic HEPA lines but raising the total revenue pool at the high end.
Thanks to plug-and-play convenience and visible operation feedback, portable devices accounted for 81% of the air purifier market in 2024. Energy models show room-level purifiers meet CDC clean-air targets with less power than full HVAC overhauls. Commercial renovations, however, increasingly favor in-duct solutions that tuck neatly into existing ventilation paths and reduce floor-space clutter. Centralized systems are advancing at an 8.6% CAGR to 2030, reinforced by stricter commercial building codes. The air purifier market size for centralized installations will likely approach parity with portable volume in new builds, though replacement cycles keep portable demand resilient in mature housing stock.
The Air Purifier Market Report is Segmented by Filtration Technology (HEPA, Activated Carbon, Ionic/Electrostatic Precipitators, UV-C and Photocatalytic Oxidation, and Hybrid and Multi-Stage Systems), Type (Stand-Alone and In-Duct), End User (Residential, Commercial, and Industrial), Connectivity (Non-Smart and Smart/IoT-Enabled ), and Geography (North America, Europe, Asia-Pacific, South America, and Middle East and Africa).
Geography Analysis
Asia-Pacific commanded 44% of global revenue in 2024 and is moving at a robust 9.1% CAGR to 2030. China's top-tier cities log penetration rates above 60% as national PM2.5 campaigns and consumer health apps keep air quality top of mind. India funds HEPA units for public schools through its National Clean Air Programme, injecting reliable public-sector volume while residential sales climb during winter haze episodes. Japan and South Korea now prioritize virus deactivation and smart-home integration, steering buyers toward hybrid UV-C platforms.
North America remains a large, tech-savvy arena. California's ozone limits cap ionizer sales but spurs safer technologies such as photocatalytic oxidation and advanced HEPA. The United States is home to the world's highest average selling prices, reflecting a strong uptake of app-driven models and corporate wellness investments in offices aiming for LEED v4.1. Canada follows similar patterns, but heating-season energy costs sharpen the focus on power-efficient designs.
Europe shows granular preferences. Nordic consumers value energy labels and silent modes, whereas Mediterranean buyers focus on allergens and wildfire smoke. EU directives on Nearly Zero Energy Buildings keep air-change rates low, increasing reliance on high-efficiency purifiers to offset tighter building envelopes. Growth in Eastern Europe trails Western Europe but picks up as urban smog triggers public awareness campaigns. In the Middle East and Africa, GCC hospitality megaprojects create pockets of premium demand, while broader uptake hinges on disposable income gains and cost-effective filter supply chains.
- Daikin Industries Ltd
- Sharp Corporation
- Dyson Ltd
- Koninklijke Philips N.V.
- LG Electronics Inc.
- Panasonic Corporation
- Whirlpool Corporation
- Resideo Technologies Inc.
- Samsung Electronics Co. Ltd
- Xiaomi Corp.
- Honeywell International Inc.
- IQAir AG
- Coway Co. Ltd
- Winix Inc.
- Blueair AB
- AllerAir Industries Inc.
- Airdog (IAQ Tech)
- Austin Air Systems Ltd
- Kent RO Systems Ltd
- TruSens (ACCO Brands)
- Medify Air LLC
Additional Benefits:
- The market estimate (ME) sheet in Excel format
- 3 months of analyst support
TABLE OF CONTENTS
1 Introduction
- 1.1 Study Assumptions & Market Definition
- 1.2 Scope of the Study
2 Research Methodology
3 Executive Summary
4 Market Landscape
- 4.1 Market Overview
- 4.2 Market Drivers
- 4.2.1 Post-COVID Health-Centric Device Adoption in East Asian Metros
- 4.2.2 Stricter PM2.5 Commercial Real-Estate Standards in North America (LEED v4.1)
- 4.2.3 Semiconductor Clean-room Capacity Build-out in the US & South Korea
- 4.2.4 Smart-Home Integration Pull for Connected Purifiers in EU & US
- 4.2.5 ESG-Driven Hospitality Upgrades across GCC Countries
- 4.2.6 Indian NCAP Subsidies for HEPA Purifiers in Public Schools
- 4.3 Market Restraints
- 4.3.1 Ozone-Emission Restrictions on Ionizers in California & Japan
- 4.3.2 High Filter Replacement Cost Sensitivity in ASEAN Mass Market
- 4.3.3 Consumer Skepticism on CADR Claims-Lack of Unified Test Protocol
- 4.3.4 HVAC In-duct Filtration Diluting Stand-alone Unit Demand in Large Offices
- 4.4 Supply-Chain Analysis
- 4.5 Regulatory Outlook
- 4.6 Technological Outlook
- 4.7 Porter's Five Forces Analysis
- 4.7.1 Bargaining Power of Suppliers
- 4.7.2 Bargaining Power of Buyers
- 4.7.3 Threat of New Entrants
- 4.7.4 Threat of Substitutes
- 4.7.5 Intensity of Competitive Rivalry
5 Market Size & Growth Forecasts
- 5.1 By Filtration Technology
- 5.1.1 HEPA
- 5.1.2 Activated Carbon
- 5.1.3 Ionic/Electrostatic Precipitators
- 5.1.4 UV-Cand Photocatalytic Oxidation
- 5.1.5 Hybrid and Multi-stage Systems
- 5.2 By Type
- 5.2.1 Stand-alone/Portable
- 5.2.2 In-duct/Central HVAC
- 5.3 By Connectivity
- 5.3.1 Non-Smart (Manual/Analog)
- 5.3.2 Smart/IoT-Enabled (App and Voice Controlled)
- 5.4 By End User
- 5.4.1 Residential
- 5.4.2 Commercial (Hospitality and Leisure, Healthcare Facilities and Clinics, Educational Institutions and Corporate Offices and Retail)
- 5.4.3 Industrial (Manufacturing and Warehousing, Food and Beverage Processing, Pharmaceuticals and Clean-rooms and Data Centers and Server Rooms)
- 5.5 By Geography
- 5.5.1 North America
- 5.5.1.1 United States
- 5.5.1.2 Canada
- 5.5.1.3 Mexico
- 5.5.2 Europe
- 5.5.2.1 United Kingdom
- 5.5.2.2 Germany
- 5.5.2.3 France
- 5.5.2.4 Spain
- 5.5.2.5 Nordic Countries
- 5.5.2.6 Russia
- 5.5.2.7 Rest of Europe
- 5.5.3 Asia-Pacific
- 5.5.3.1 China
- 5.5.3.2 India
- 5.5.3.3 Japan
- 5.5.3.4 South Korea
- 5.5.3.5 ASEAN Countries
- 5.5.3.6 Australia
- 5.5.3.7 Rest of Asia-Pacific
- 5.5.4 South America
- 5.5.4.1 Brazil
- 5.5.4.2 Argentina
- 5.5.4.3 Colombia
- 5.5.4.4 Rest of South America
- 5.5.5 Middle East and Africa
- 5.5.5.1 United Arab Emirates
- 5.5.5.2 Saudi Arabia
- 5.5.5.3 South Africa
- 5.5.5.4 Egypt
- 5.5.5.5 Rest of Middle East and Africa
- 5.5.1 North America
6 Competitive Landscape
- 6.1 Market Concentration
- 6.2 Strategic Moves (M&A, Partnerships, PPAs)
- 6.3 Market Share Analysis (Market Rank/Share for key companies)
- 6.4 Company Profiles (includes Global level Overview, Market level overview, Core Segments, Financials as available, Strategic Information, Products & Services, and Recent Developments)
- 6.4.1 Daikin Industries Ltd
- 6.4.2 Sharp Corporation
- 6.4.3 Dyson Ltd
- 6.4.4 Koninklijke Philips N.V.
- 6.4.5 LG Electronics Inc.
- 6.4.6 Panasonic Corporation
- 6.4.7 Whirlpool Corporation
- 6.4.8 Resideo Technologies Inc.
- 6.4.9 Samsung Electronics Co. Ltd
- 6.4.10 Xiaomi Corp.
- 6.4.11 Honeywell International Inc.
- 6.4.12 IQAir AG
- 6.4.13 Coway Co. Ltd
- 6.4.14 Winix Inc.
- 6.4.15 Blueair AB
- 6.4.16 AllerAir Industries Inc.
- 6.4.17 Airdog (IAQ Tech)
- 6.4.18 Austin Air Systems Ltd
- 6.4.19 Kent RO Systems Ltd
- 6.4.20 TruSens (ACCO Brands)
- 6.4.21 Medify Air LLC
7 Market Opportunities & Future Outlook
- 7.1 White-space & Unmet-Need Assessment
 电子空气清净机和空气清洁设备市场:依产品类型、技术、最终用户和通路划分-2026-2032年全球市场预测空气消毒净化设备市场:依技术类型、产品类型、功能类型、最终用途和销售管道划分-2026-2032年全球预测天花板式排烟系统市场:按过滤器类型、气流、分配管道、应用和最终用户产业划分,全球预测,2026-2032年
 光催化空气清净机市场分析及预测(至2035年):依类型、产品类型、技术、组件、应用、材质、设备、最终用户及功能划分
 2026年全球空气清净机市场报告
 全球甲醛去除空气清净机市场分析及预测(至2031年)
 空气清净机市场规模、份额和趋势分析报告:按技术、应用、覆盖范围、销售管道、类型、地区和细分市场预测(2026-2033 年)
 2026-2030年全球空气清净机市场
 灭菌箱市场 - 2026-2031年预测
 空气清净机市场 - 全球产业规模、份额、趋势、机会及预测(依滤芯类型、应用、销售管道、地区及竞争格局划分,2021-2031年)