


 |
市场调查报告书
商品编码
1852166
奈米材料:市场份额分析、行业趋势、统计数据和成长预测(2025-2030 年)Nanomaterials - Market Share Analysis, Industry Trends & Statistics, Growth Forecasts (2025 - 2030) |
||||||
※ 本网页内容可能与最新版本有所差异。详细情况请与我们联繫。
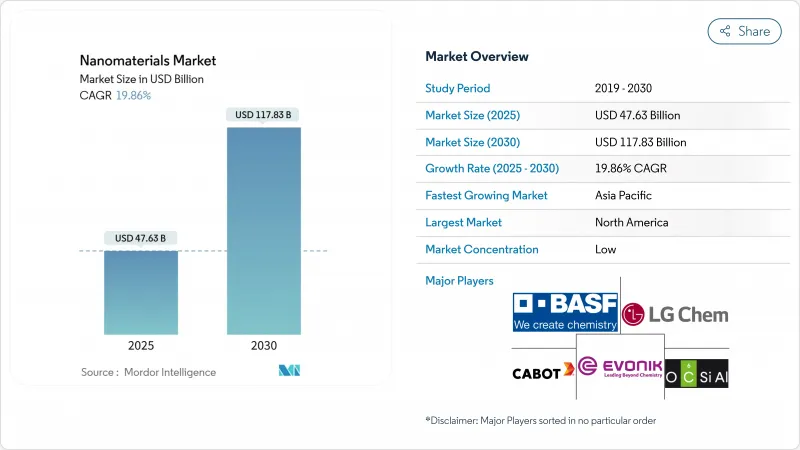
奈米材料市场规模预计在 2025 年达到 476.3 亿美元,预计到 2030 年将达到 1,178.3 亿美元,预测期(2025-2030 年)复合年增长率为 19.86%。
这一迅猛增长反映了半导体抛光、mRNA疗法、柔性显示器和高效水处理等领域商业性应用的激增。向3奈米以下製程节点的持续转型、创纪录的疫苗研发预算以及在缺水地区建造海水淡化设施,都为奈米材料市场注入了新的动力。奈米碳管和石墨烯衍生物的规模化生产以及成本降低方面的学习曲线正在不断收窄,而公共部门的奈米技术专案则为平台创新提供了源源不断的推动。儘管如此,市场仍需应对贵金属原料价格的波动,并控制小型参与企业为维持竞争优势而购买原子层沉积生产线所需的高昂资本成本。
全球奈米材料市场趋势与洞察
亚洲新建晶圆厂推动半导体级奈米浆料的发展
亚洲半导体製造设施的崛起,正推动着对高纯度奈米浆料前所未有的需求,而奈米浆料是化学机械抛光 (CMP) 製程的关键材料。这些材料能够实现3奈米及以下先进节点半导体製造的超高精度抛光。一座领先的工厂每年可消耗超过300吨奈米浆料,随着晶片结构日益复杂,需求仍在持续成长。此外,台积电在亚利桑那州投资400亿美元的晶圆厂也正在亚洲以外创造新的需求。
由于mRNA生产能力的提高,对脂质奈米颗粒的需求增加。
在mRNA疫苗和治疗应用蓬勃发展的推动下,脂质奈米颗粒(LNP)生产市场正经历爆炸性成长。北美目前占据LNP市场领先地位,但欧洲正透过大力投资产能,稳步缩小与北美的差距。 LNP的应用范围已从传统的疫苗扩展到基因治疗和癌症治疗领域。近期的一些创新旨在利用人工智慧技术来优化LNP配方,从而提高疗效并最大限度地减少副作用。
技术成本不断上涨
奈米碳管和半导体级金属氧化物的批次产率仍然对反应器运作时间和能耗非常敏感。即使年产能达到数千吨,其生产成本也比传统散装填料高出五到十倍,这限制了它们在价格弹性较大的应用领域(例如一般塑胶)中的应用。
细分市场分析
预计到2024年,奈米颗粒将占据奈米材料市场69%的份额,这反映了它们在催化、抗菌涂层和导电浆料等领域的成熟应用。该细分市场受益于喷雾干燥和火焰热解製程的日益成熟,过去十年间,这些製程已使每公斤成本降低了一半。同时,随着生产方式从克级化学气相沉积(CVD)转向连续浮动催化剂反应器的转变,奈米管细分市场正以21.15%的复合年增长率快速成长。
奈米管的兴起得益于多项专利,例如将拉伸强度提高三倍的扭曲碳奈米管纱线,以及将储氢容量提升至7 wt%以上的铁掺杂结构。奈米黏土和奈米线分别受到阻燃聚合物共混物和高频射频元件需求的推动,实现了两位数以上的成长。
非聚合物有机材料,主要包括炭黑和石墨,预计到2024年将占据55%的收入份额,其应用领域涵盖轮胎化合物、电磁干扰屏蔽外壳和导电母粒。奈米多孔炭黑的表面积现已超过1500 m² g⁻¹,拓展了其在储能吸附领域的应用。
然而,聚合物基奈米材料的复合年增长率最高,达19.99%。喷雾冷冻干燥技术的进步催生了脂质-聚合物杂化物,这些杂化物能够自组装成可生物降解的载体,使药物递送研究人员能够实现可调控的释放动力学和低免疫抗原性。在涂布领域,奈米硅氧烷接枝赋予涂层自修復性能,在室温下即可在数分钟内恢復磨损后的光泽。
区域分析
到2024年,北美将占据奈米材料市场38.5%的份额,联邦政府的研发支出将超过380亿美元,2025年的研发需求预计将达到22亿美元。该地区的发展动力源于半导体产业的復苏和在mRNA疗法领域的领先地位,从而形成了一个愿意为超高纯度产品买单的高端客户群。
亚太地区正以22.26%的复合年增长率快速扩张,预计到2030年,其营收将超过北美。中国的「十四五」规划将奈米技术列为核心支柱,推动公共资金每年以两位数的速度成长,以加速建造2奈米以下的首座奈米晶圆厂。韩国和日本在OLED和电池供应链中保持领先地位,而印度则将奈米材料应用于面向农村居民的低成本水质净化计划中。
欧洲秉持永续性和严格监管的理念,建立了清晰的形象。 「地平线欧洲」计画为基于更安全设计的目标奈米材料津贴资助,并鼓励出口企业在研发早期阶段就对产品的生命週期影响进行认证。中东地区正在扩大海水淡化产能,并采用奈米多孔膜技术,目标是在沙乌地阿拉伯实现温室气体排放量比热法减少94%。巴西是世界第二大生物基作物生产国,正透过作物专用奈米肥料提高养分利用效率,引领南美洲生物基作物奈米肥料的应用。
其他福利:
- Excel格式的市场预测(ME)表
- 3个月的分析师支持
目录
第一章 引言
- 研究假设和市场定义
- 调查范围
第二章调查方法
第三章执行摘要
第四章 市场情势
- 市场概览
- 市场驱动因素
- 亚洲新建晶圆厂推动半导体级奈米浆料的生产
- 北美和欧洲对脂质奈米颗粒和mRNA疫苗生产能力的需求
- 柔性OLED生产线中的金银奈米墨水
- 奈米材料市场应用日益增长
- 海湾合作委员会海水淡化工程建设推动奈米多孔膜技术发展
- 市场限制
- 技术成本不断上涨
- 原物料价格波动
- 昂贵的原子层沉积反应器限制了中小企业的规模化生产。
- 价值链分析
- 波特五力模型
- 供应商的议价能力
- 买方的议价能力
- 新进入者的威胁
- 替代品的威胁
- 竞争对手之间的竞争
第五章 市场规模与成长预测
- 依产品类型
- 奈米颗粒
- 奈米金属
- 金子
- 银
- 铂
- 钛
- 铝
- 非金属氧化物
- 氧化铝
- 氧化铁
- 二氧化钛
- 二氧化硅
- 氧化锌
- 复合氧化物
- 磷酸钙
- 稀土元素氧化物
- 钛酸锂
- 硅氢化物
- 奈米纤维
- 奈米管
- 奈米黏土
- 奈米线
- 奈米颗粒
- 依结构类型
- 非聚合物有机奈米材料
- 炭黑
- 奈米碳管
- 适体
- 低分子OLED
- 活性碳
- 奈米碳管复合材料
- 聚合物奈米材料
- 被覆剂和黏合剂
- 转染试剂
- 诊断剂
- 药物输送车辆
- 织物处理
- 光学镀膜
- 奈米多孔过滤膜
- 介电膜
- OLED薄膜
- 非聚合物有机奈米材料
- 按材料类别
- 碳基
- 金属底座
- 金属氧化物和陶瓷基
- 基于聚合物和脂质的
- 终端用户产业
- 建造
- 电子学
- 活力
- 卫生保健
- 个人护理
- 橡皮
- 其他终端用户产业
- 按地区
- 亚太地区
- 中国
- 印度
- 日本
- 韩国
- ASEAN
- 亚太其他地区
- 北美洲
- 美国
- 加拿大
- 墨西哥
- 欧洲
- 德国
- 英国
- 义大利
- 法国
- 其他欧洲地区
- 南美洲
- 巴西
- 阿根廷
- 其他南美洲国家
- 中东和非洲
- 沙乌地阿拉伯
- 南非
- 其他中东和非洲地区
- 亚太地区
第六章 竞争情势
- 市场集中度
- 策略趋势
- 市占率分析
- 公司简介
- ACS Material
- American Elements
- Arkema
- Ascensus
- BASF SE
- Cabot Corporation
- Chasm Advanced Materials, Inc.
- Evonik Industries AG
- Jiangsu Cnano Technology Co., Ltd
- LG Chem
- Merck KGaA
- Nano-C
- Nanocyl SA
- NAWAH
- OCSiAl
- QuantumSphere, Inc.
- Raymor Industries Inc.
- Resonac Holdings Corporation
- Solesence
- US Research Nanomaterials, Inc.
- Zyvex Technologies
第七章 市场机会与未来展望
The Nanomaterials Market size is estimated at USD 47.63 billion in 2025, and is expected to reach USD 117.83 billion by 2030, at a CAGR of 19.86% during the forecast period (2025-2030).
The sharp upswing mirrors a surge of commercial adoption across semiconductor polishing, mRNA-based therapeutics, flexible displays, and high-efficiency water treatment. Continuous node migration below 3 nm, record vaccine research and development budgets, and desalination build-outs in water-stressed regions are giving the nanomaterials market fresh momentum. Production scale-ups in carbon nanotubes and graphene derivatives are intensifying cost-down learning curves, while public-sector nanotechnology programs underpin a steady pipeline of platform innovations. Even so, the market must absorb volatility in precious-metal feedstocks and contain the high capital charges of atomic-layer-deposition lines that smaller entrants need to compete.
Global Nanomaterials Market Trends and Insights
Semiconductor-grade Nano-slurries Fuelled by New Asian Fabs
The rise of semiconductor fabrication facilities in Asia is driving unprecedented demand for high-purity nano-slurries essential for chemical-mechanical planarization (CMP) processes. These materials enable ultra-precise polishing for advanced node semiconductor manufacturing at 3nm and below. A single leading-edge fab can consume over 300 tons of nano-slurries annually, with demand increasing as chip architectures grow more complex. Additionally, TSMC's USD 40 billion Arizona fab complex is creating new demand centers beyond Asia.
Lipid Nanoparticles Demand from mRNA Capacity Build-outs
Fueled by the surge in mRNA vaccine and therapeutic applications, the lipid nanoparticle (LNP) manufacturing market is witnessing explosive growth. While North America holds the lead in the LNP market, European production capacity is seeing significant investments, steadily closing the gap. Beyond their traditional use in vaccines, LNPs are now making inroads into gene therapies and cancer treatments. Recent innovations are harnessing AI to fine-tune LNP formulations, aiming to boost efficacy and minimize side effects.
Higher Costs of Technology
Batch yields for carbon nanotubes and semiconductor-grade metal oxides remain sensitive to reactor uptime and energy intensity. Even at multi-kiloton annual capacity, unit production costs are five to ten times higher than conventional bulk fillers, constraining uptake in price-elastic applications such as commodity plastics.
Other drivers and restraints analyzed in the detailed report include:
- Gold and Silver Nano-inks in Flexible OLED Lines
- Increasing Usage of Nanomaterials in Water Treatment
- Raw Material Price Fluctuation
For complete list of drivers and restraints, kindly check the Table Of Contents.
Segment Analysis
Nanoparticles held 69% of nanomaterials market share in 2024, reflecting their well-established role in catalysts, antimicrobial coatings, and conductive pastes. The segment benefits from mature spray-dry and flame-pyrolysis routes that cut cost per kilogram in half over the past decade. Meanwhile, the nanotubes sub-segment is advancing at a 21.15% CAGR as output shifts from gram-scale CVD to continuous floating-catalyst reactors.
Wider nanotube deployment is supported by patent clusters covering twisted CNT yarns that triple tensile strength and Fe-doped structures that lift hydrogen-storage capacity beyond 7 wt%. Nanoclays and nanowires record mid-teen growth, with demand tied to flame-retardant polymer blends and high-frequency RF devices, respectively.
Non-polymer organic grades, largely carbon black and graphitic forms, posted 55% revenue share in 2024 by supplying tire compounds, EMI-shielding housings, and conductive masterbatches. Nano-porous carbon blacks now deliver surface areas above 1,500 m2 g-1, expanding adsorption applications in energy storage.
Polymeric nanomaterials, however, track the fastest 19.99% CAGR. Advances in spray-freeze-drying techniques yield lipid-polymer hybrids that self-assemble into biodegradable carriers, giving drug-delivery researchers tunable release kinetics and low immunogenicity. In coatings, nano-siloxane grafting imparts self-healing performance that restores gloss after abrasion within minutes at room temperature.
The Nanomaterials Market Report Segments the Industry by Product Type (Nanoparticles, Nanofibers, Nanotubes, and More), Structure Type (Non-Polymer Organic Nanomaterials and Polymeric Nanomaterials), Material Category (Carbon-Based, Metal-Based, and More), End-User Industry (Construction, Electronics, Energy, and More), and Geography (Asia-Pacific, North America, Europe, South America, and Middle East and Africa).
Geography Analysis
North America held 38.5% nanomaterials market share in 2024, anchored by federal research and development outlays exceeding USD 38 billion and a record USD 2.2 billion request for 2025. The region's semiconductor resurgence and leadership in mRNA therapeutics create a premium customer base willing to pay for ultra-high-purity grades.
Asia Pacific is expanding at a 22.26% CAGR, a pace that could lift its revenue past North America before 2030. China's 14th Five-Year Plan lists nanotechnology as a core pillar, driving double-digit annual increases in public funding and accelerating first-time fab builds below 2 nm. South Korea and Japan sustain their leadership in OLED and battery supply chains, while India channels nanomaterials into low-cost water purification projects that serve rural populations.
Europe maintains a distinct profile built on sustainability and regulatory rigor. Horizon Europe grants target safer-by-design nanomaterials, prompting exporters to certify life-cycle impacts early in development. The Middle East scales desalination capacity incorporating nano-porous membranes, with Saudi-Arabia seeking a 94% greenhouse-gas cut relative to thermal methods. Brazil spearheads South American adoption through crop-specific nano-fertilisers that raise nutrient-use efficiency, supported by its standing as the second-largest biotech-crop producer worldwide.
- ACS Material
- American Elements
- Arkema
- Ascensus
- BASF SE
- Cabot Corporation
- Chasm Advanced Materials, Inc.
- Evonik Industries AG
- Jiangsu Cnano Technology Co., Ltd
- LG Chem
- Merck KGaA
- Nano-C
- Nanocyl SA
- NAWAH
- OCSiAl
- QuantumSphere, Inc.
- Raymor Industries Inc.
- Resonac Holdings Corporation
- Solesence
- US Research Nanomaterials, Inc.
- Zyvex Technologies
Additional Benefits:
- The market estimate (ME) sheet in Excel format
- 3 months of analyst support
TABLE OF CONTENTS
1 Introduction
- 1.1 Study Assumptions and Market Definition
- 1.2 Scope of the Study
2 Research Methodology
3 Executive Summary
4 Market Landscape
- 4.1 Market Overview
- 4.2 Market Drivers
- 4.2.1 Semiconductor-grade Nano-slurries Fuelled by New Asian Fabs
- 4.2.2 Lipid Nanoparticles Demand from North-America and Europe mRNA Vaccine Capacity
- 4.2.3 Gold and Silver Nano-inks in Flexible OLED Lines
- 4.2.4 Increasing Usage of Nanomaterials
- 4.2.5 GCC Desalination Build-out Driving Nano-porous Membranes
- 4.3 Market Restraints
- 4.3.1 Higher Costs of Technology
- 4.3.2 Raw Material Price Fluctuation
- 4.3.3 High-Capex Atomic-Layer-Deposition Reactors Limiting SME Scale-up
- 4.4 Value Chain Analysis
- 4.5 Porter's Five Forces
- 4.5.1 Bargaining Power of Suppliers
- 4.5.2 Bargaining Power of Buyers
- 4.5.3 Threat of New Entrants
- 4.5.4 Threat of Substitutes
- 4.5.5 Competitive Rivalry
5 Market Size and Growth Forecasts (Value)
- 5.1 By Product Type
- 5.1.1 Nanoparticles
- 5.1.1.1 Nanometals
- 5.1.1.1.1 Gold
- 5.1.1.1.2 Silver
- 5.1.1.1.3 Platinum
- 5.1.1.1.4 Titanium
- 5.1.1.1.5 Aluminium
- 5.1.1.2 Non-metal Oxides
- 5.1.1.2.1 Alumina
- 5.1.1.2.2 Iron Oxide
- 5.1.1.2.3 Titanium Oxide
- 5.1.1.2.4 Silica
- 5.1.1.2.5 Zinc Oxide
- 5.1.1.3 Complex Oxides
- 5.1.1.3.1 Calcium Phosphate
- 5.1.1.3.2 Rare-earth Metal Oxides
- 5.1.1.3.3 Lithium Titanate
- 5.1.1.3.4 Silica Hydride
- 5.1.2 Nanofibers
- 5.1.3 Nanotubes
- 5.1.4 Nanoclays
- 5.1.5 Nanowires
- 5.1.1 Nanoparticles
- 5.2 By Structure Type
- 5.2.1 Non-polymer Organic Nanomaterials
- 5.2.1.1 Carbon Black
- 5.2.1.2 Carbon Nanotubes
- 5.2.1.3 Aptamers
- 5.2.1.4 Small-Molecule OLED
- 5.2.1.5 Activated Carbon
- 5.2.1.6 Carbon Nanotubes Composites
- 5.2.2 Polymeric Nanomaterials
- 5.2.2.1 Coatings and Adhesives
- 5.2.2.2 Transfection Reagents
- 5.2.2.3 Diagnostic Reagents
- 5.2.2.4 Drug-Delivery Vehicles
- 5.2.2.5 Fabric Treatments
- 5.2.2.6 Optical Coatings
- 5.2.2.7 Nano-porous Filtration Membranes
- 5.2.2.8 Dielectric Films
- 5.2.2.9 OLED Films
- 5.2.1 Non-polymer Organic Nanomaterials
- 5.3 By Material Category
- 5.3.1 Carbon-based
- 5.3.2 Metal-based
- 5.3.3 Metal-oxide and Ceramic-based
- 5.3.4 Polymeric and Lipid-based
- 5.4 End-user Industry
- 5.4.1 Construction
- 5.4.2 Electronics
- 5.4.3 Energy
- 5.4.4 Healthcare
- 5.4.5 Personal Care
- 5.4.6 Rubber
- 5.4.7 Other End-user Industries
- 5.5 Geography
- 5.5.1 Asia-Pacific
- 5.5.1.1 China
- 5.5.1.2 India
- 5.5.1.3 Japan
- 5.5.1.4 South Korea
- 5.5.1.5 ASEAN
- 5.5.1.6 Rest of Asia-Pacific
- 5.5.2 North America
- 5.5.2.1 United States
- 5.5.2.2 Canada
- 5.5.2.3 Mexico
- 5.5.3 Europe
- 5.5.3.1 Germany
- 5.5.3.2 United Kingdom
- 5.5.3.3 Italy
- 5.5.3.4 France
- 5.5.3.5 Rest of Europe
- 5.5.4 South America
- 5.5.4.1 Brazil
- 5.5.4.2 Argentina
- 5.5.4.3 Rest of South America
- 5.5.5 Middle East and Africa
- 5.5.5.1 Saudi Arabia
- 5.5.5.2 South Africa
- 5.5.5.3 Rest of Middle East and Africa
- 5.5.1 Asia-Pacific
6 Competitive Landscape
- 6.1 Market Concentration
- 6.2 Strategic Moves
- 6.3 Market Share Analysis
- 6.4 Company Profiles (includes Global level Overview, Market level overview, Core Segments, Financials, Strategic Information, Market Rank/Share, Products and Services, Recent Developments)
- 6.4.1 ACS Material
- 6.4.2 American Elements
- 6.4.3 Arkema
- 6.4.4 Ascensus
- 6.4.5 BASF SE
- 6.4.6 Cabot Corporation
- 6.4.7 Chasm Advanced Materials, Inc.
- 6.4.8 Evonik Industries AG
- 6.4.9 Jiangsu Cnano Technology Co., Ltd
- 6.4.10 LG Chem
- 6.4.11 Merck KGaA
- 6.4.12 Nano-C
- 6.4.13 Nanocyl SA
- 6.4.14 NAWAH
- 6.4.15 OCSiAl
- 6.4.16 QuantumSphere, Inc.
- 6.4.17 Raymor Industries Inc.
- 6.4.18 Resonac Holdings Corporation
- 6.4.19 Solesence
- 6.4.20 US Research Nanomaterials, Inc.
- 6.4.21 Zyvex Technologies
7 Market Opportunities and Future Outlook
- 7.1 White-space and Unmet-need Assessment
 奈米薄膜市场规模、份额和成长分析:按材料、应用和地区划分-2026-2033年产业预测
 2034 年前智慧奈米材料的全球市场机会与策略
 奈米材料市场分析与预测(至2035年):按类型、产品类型、应用、技术、材料类型、最终用户、形态、组件和解决方案划分2026年全球奈米材料市场报告2026年全球二氧化钛奈米材料市场报告
 智慧奈米材料市场:按材料类型、形状、合成技术、功能化和应用划分-2026-2032年全球预测
 奈米工程材料市场预测至2032年:按材料类型、结构、技术、应用、最终用户和地区分類的全球分析
 奈米材料市场规模、份额和成长分析(按类型、应用和地区划分)-2026-2033年产业预测
 奈米材料的全球市场(2025年)- 终端用户,用途,竞争企业:2024年~2030年的分析与预测
 奈米化学品市场规模、份额和趋势分析报告:按产品、应用、地区和细分市场预测(2025-2033 年)