


 |
市场调查报告书
商品编码
1906016
金属包装:市场占有率分析、产业趋势与统计、成长预测(2026-2031)Metal Packaging - Market Share Analysis, Industry Trends & Statistics, Growth Forecasts (2026 - 2031) |
||||||
※ 本网页内容可能与最新版本有所差异。详细情况请与我们联繫。
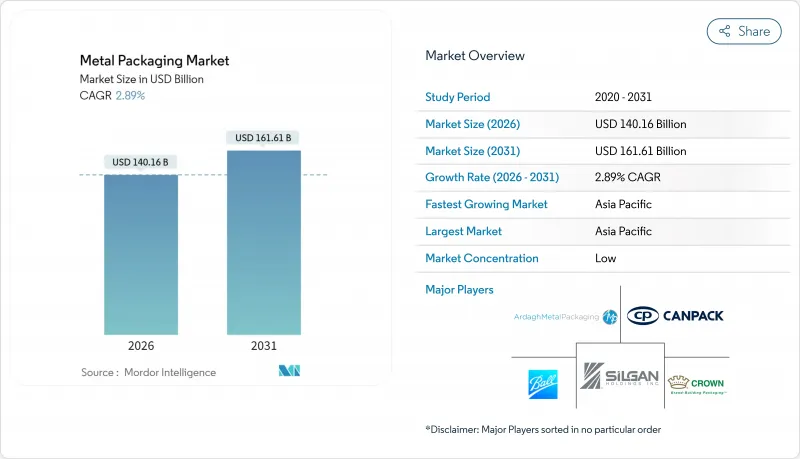
预计金属包装市场规模将从 2025 年的 1,362.2 亿美元成长到 2026 年的 1,401.6 亿美元,预计到 2031 年将达到 1,616.1 亿美元,2026 年至 2031 年的复合年增长率为 2.89%。
这一稳步增长得益于循环经济法规、即饮饮料的高端化以及零售商以金属替代塑料的努力。铝材良好的回收经济性,加上轻量化材料的进步以及品牌所有者提出的范围3减排目标,正在巩固金属包装市场作为碳酸饮料和机能饮料首选包装的地位。製造商继续透过长期合约和基于废料的供应策略来规避铝和钢价格波动的风险。同时,涂料供应商正在加速向不含排放A(无BPA)的化学品转型,以支持消费者的安全声明。儘管竞争环境适中,但主要製罐製造商正在深化涂层、回收和数位印刷能力的垂直整合,以在这个成熟但充满机会的市场环境中保护市场份额。
全球金属包装市场趋势与洞察
对循环经济的需求正在推动易拉罐回收。
日益严格的监管正在重塑价值链经济格局,强制规定最低再生材料含量(铝罐已达到此标准),并为金属包装市场带来合规优势。欧盟的《包装废弃物指令》(PPWR) 要求到 2030 年,饮料容器的再生材料含量必须达到 30%,而铝罐的平均再生材料含量为 71%。押金返还计划正推动回收率在 2029 年前达到 90%,从而确保可预测的废料供应,并减少对原生金属的依赖。像 Ball 这样的全球製造商的目标是达到 85% 的再生材料含量,以增强闭合迴路效率,降低原料成本风险。澳洲也遵循欧盟法规,并推出了一项标准,要求到 2040 年,食品罐的消费后再生材料含量达到 80%。持续的监管势头正在巩固铝相对于 PET 的优势,尤其是在饮料行业,因为循环性评分现在已被纳入采购过程中的供应商竞标评估。
新兴亚洲的高级即饮饮料
亚太地区对高端罐装饮料的强劲需求正在加速金属包装市场的成长。在日本,受消费者对低卡路里和含酒精饮料的需求推动,罐装酒市场预计将在2018年至2023年间成长两倍。朝日啤酒旗下的生啤酒(Nama Jockey)等品牌便是包装创新如何将店内体验带入家庭环境的绝佳例证。中国和印度消费者可支配收入的成长正推动高端即饮咖啡、康普茶和功能性代餐饮料进入大众零售市场,而这些产品都依赖罐装来维持风味和保温。优质化使製造商能够将不断上涨的原材料成本转嫁给消费者,从而在铝价波动的情况下维持利润率。
伦敦金属交易所(LME)铝和钢铁价格波动
能源价格波动导致的价格波动对金属包装市场的利润率带来压力,因为该市场仍然依赖于滞后于现货价格波动的转嫁合约。北美关税加剧了市场的复杂性,迫使生产商结合使用避险工具和区域采购来维持自身竞争力。欧洲冶炼厂面临持续的能源成本压力,加剧了全球价格波动。虽然大型企业可以透过废料原料和多年期合约来抵消价格波动的影响,但小型冶炼厂仍然容易受到影响,这可能导致资本支出週期放缓。
细分市场分析
截至2025年,铝将占金属包装市场42.80%的份额,预计到2031年将以3.57%的复合年增长率增长,这主要得益于符合PPWR法规的闭合迴路回收系统的普及。钢材仍将在大型食品容器和工业桶中占据一席之地,但由于重量和能源效率的考虑,其增长速度将放缓。诺贝丽斯公司在英国投资9,000万美元将其易拉罐回收能力翻倍的扩建计划,凸显了铝材的战略重要性。铝材的轻量特性有助于减少物流排放,提升企业在环境、社会和治理(ESG)的排放,并增强消费者对饮料品牌的忠诚度。市场参与企业持续投资于重熔技术,推动了再生铝金属包装市场规模的稳定成长。
与原生铝相比,再生铝的价格优势有助于品牌控制原物料成本并降低采购风险。印度铝业(Hindalco)100亿美元的生产力计画表明,一体化的冶炼和回收工厂如何缩短供应链并支持积极的再生材料含量目标。钢铁的磁性可回收性在混合废弃物处理中仍然是一项优势,但随着碳排放税的日益普及,容器重量的增加推高了运输成本。总体而言,铝的成本、循环性和重量优势巩固了其主导地位。同时,钢铁在一些注重机械强度和抗穿刺性的细分市场中也扮演着重要角色。
截至2025年,罐装产品将占金属包装市场41.12%的份额,预计在全球便利商店通路中,即饮咖啡、硬苏打水和机能饮料的高端化趋势推动下,罐装产品将以6.08%的复合年增长率成长。波尔公司的Dynamark Advanced Pro可变图形系统可实现大规模罐身个人化客製化,协助负责人提升消费者参与度,增强商店吸引力。食品罐市场保持稳定,为番茄酱、汤料和宠物食品等产品的全球贸易提供高阻隔保护。气雾罐正在个人护理领域占有一席之地,随着疫情后新兴市场需求的復苏,美髮造型产品、除臭剂和家用清洁剂剂等品类的需求正在增长。
轻量化倡议在不影响强度的前提下减少了单位铝材的使用量,有助于控製成本并减少范围3排放。瓶盖、封盖和旋盖凭藉其防篡改功能和便利性,在细分市场中保持市场份额。散装桶和中型钢製容器在农业化学品和食用油行业仍然很受欢迎,因为在这些行业中,可重复使用性和联合国运输认证至关重要。这些趋势巩固了罐体作为金属包装市场主流产品的地位,而邻近细分市场则透过材料科学和设计创新不断发展。
区域分析
到2025年,亚太地区将占全球金属包装市场38.21%的份额,并在2031年之前以5.89%的复合年增长率增长,这主要得益于中国即饮饮料行业的快速增长和印度中产阶级的不断壮大。本地生产的罐钢供应,加上印度铝业公司(Hindalco)数十亿美元的冶炼厂和回收设施扩建计划,不仅具有成本优势,而且有助于循环经济发展,因此吸引了全球品牌所有者的注意。日本透过出口高品质的雉海罐,展现了其在设计领域的领先地位,并影响着区域市场的发展趋势。同时,东南亚国家正利用旅游业带来的饮料需求以及正在实施的押金返还试点项目,积极开拓市场。
北美市场已趋于成熟,与主要啤酒和软性饮料灌装商签订的长期供应协议确保了国内易拉罐生产线接近满载运作。关税迫使易拉罐製造商在国内采购金属,从而推动了对废钢坯加工厂和仓库自动化设施的投资,并降低了单位成本。各州完善的瓶罐法规使铝回收率维持在60%以上,提高了二次生产所需原料的供应稳定性。
在欧洲,严格的PPWR(产品包装废弃物法规)要求与先进的回收网路相结合,为涂层创新和数位浮水印测试提供了试验场。皇冠集团位于西班牙和义大利的可扩展工厂正在为精酿啤酒出口商增设高速生产线,这表明即使在饱和的市场中,仍然存在持续的成长机会。以巴西为首的南美洲市场需求正稳定成长,啤酒品牌纷纷转向罐装包装,以提升优质化并简化物流。
儘管中东和非洲地区在基础设施方面落后,但人口增长和收入提高为新进入者打入气雾剂除臭剂和罐头食品市场创造了机会,全部区域必将为全球金属包装市场的增长做出贡献。
其他福利:
- Excel格式的市场预测(ME)表
- 3个月的分析师支持
目录
第一章 引言
- 研究假设和市场定义
- 调查范围
第二章调查方法
第三章执行摘要
第四章 市场情势
- 市场概览
- 市场驱动因素
- 循环经济政策推动罐头到罐头的回收循环
- 亚洲新兴市场即饮饮料的优质化
- 零售商对塑胶和金属的承诺
- 与PET相比,较高的废料回收率可降低实际成本。
- 利用罐内二维码/NFC技术实现消费者资料货币化
- 电子商务和DTC饮料零售的扩张
- 市场限制
- 伦敦金属交易所(LME)铝和钢铁价格波动
- 品牌所有者对范围 3 二氧化碳排放的强烈反对
- 单一材料纸瓶的兴起
- 金属包装的高成本生产和营运成本
- 供应链分析
- 监管环境
- 技术展望
- 波特五力分析
- 供应商的议价能力
- 买方的议价能力
- 新进入者的威胁
- 替代品的威胁
- 竞争对手之间的竞争
- 地缘政治局势如何影响市场
- 投资分析
第五章 市场规模与成长预测
- 依材料类型
- 铝
- 钢
- 依产品类型
- 能
- 罐头食品
- 饮料罐
- 气雾罐
- 散装容器
- 桶和桶的运输
- 瓶盖和封口
- 能
- 按最终用户行业划分
- 饮料
- 食物
- 化妆品和个人护理
- 家
- 其他终端用户产业
- 按涂层/衬里类型
- 含双酚A的环氧树脂
- BPA-NI环氧树脂
- 聚酯/PET
- 其他涂层/衬里类型
- 按货柜容量
- 少于250毫升
- 251-500 ml
- 501-1000 ml
- 1000毫升或更多
- 按地区
- 北美洲
- 美国
- 加拿大
- 墨西哥
- 欧洲
- 德国
- 英国
- 法国
- 义大利
- 西班牙
- 俄罗斯
- 其他欧洲地区
- 亚太地区
- 中国
- 印度
- 日本
- 韩国
- 澳洲和纽西兰
- 亚太其他地区
- 中东和非洲
- 中东
- 阿拉伯聯合大公国
- 沙乌地阿拉伯
- 土耳其
- 其他中东地区
- 非洲
- 南非
- 奈及利亚
- 埃及
- 其他非洲地区
- 中东
- 南美洲
- 巴西
- 阿根廷
- 其他南美洲
- 北美洲
第六章 竞争情势
- 市场集中度
- 策略趋势
- 市占率分析
- 公司简介
- Ardagh Metal Packaging SA
- Ball Corporation
- Crown Holdings Inc.
- CANPACK SA
- Silgan Holdings Inc.
- Greif Inc.
- TUBEX Packaging GmbH
- Mauser Packaging Solutions
- Nampak Limited
- Colep Packaging
- CPMC Holdings Ltd.
- Toyo Seikan Group Holdings
- Amcor plc(Metal division)
- AptarGroup Inc.
- Alcoa Corporation
- Sherwin-Williams(Can Coatings)
- Novelis Inc.
- Hindalco Industries Ltd.
- RPC Group plc
- BWAY Corporation
- Berlin Packaging
第七章 市场机会与未来展望
The metal packaging market is expected to grow from USD 136.22 billion in 2025 to USD 140.16 billion in 2026 and is forecast to reach USD 161.61 billion by 2031 at 2.89% CAGR over 2026-2031.
Steady growth stems from circular-economy legislation, premiumisation of ready-to-drink beverages, and retailers' plastic-to-metal substitution pledges. Aluminium's superior recycling economics, combined with material-lightweighting advances and brand-owner scope-3 reduction targets, reinforce the metal packaging market as the default option for carbonated and functional beverages. Producers continue to hedge aluminium and steel price swings through long-term contracts and scrap-based supply strategies, while coating suppliers accelerate the shift to BPA-free chemistries that underpin consumer safety narratives. Competitive intensity remains moderate as the leading canmakers deepen vertical integration across coating, recycling, and digital printing capabilities to defend share in a mature yet opportunity-rich landscape.
Global Metal Packaging Market Trends and Insights
Circular-Economy Mandates Boost Can-to-Can Recycling Loops
Tighter legislation is reshaping value-chain economics by mandating minimum recycled-content thresholds that aluminium cans already exceed, giving the metal packaging market a compliance edge. The EU's PPWR requires 30% recycled material in beverage containers by 2030, yet aluminium cans average 71% recycled content. Deposit-return schemes are driving collection rates toward 90% by 2029, supporting predictable scrap flows and reducing virgin-metal dependency. Global producers such as Ball target 85% recycled content, reinforcing closed-loop efficiencies that temper raw-material cost risk. Australia mirrors EU rules with an 80% post-consumer threshold for food-grade cans by 2040.Sustained regulatory momentum cements aluminium's moat over PET, particularly in beverages where procurement now factors circularity scores into supplier bids.
Premiumization of RTD Beverages in Emerging Asia
Surging demand for premium canned drinks is accelerating the metal packaging market growth in Asia-Pacific. Japan's canned chuhai segment tripled in the United States between 2018 and 2023 as consumers seek low-calorie, low-alcohol options. Brands like Asahi's Nama Jokki can demonstrate how packaging innovations replicate on-premise experiences in at-home settings. Rising disposable incomes in China and India push premium RTD coffee, kombucha, and functional meal-replacement beverages into mainstream retail, all of which rely on cans for flavor protection and thermal performance. The premiumisation wave enables manufacturers to pass higher material costs through to consumers, sustaining margins despite aluminium volatility.
Price Volatility of LME Aluminium and Steel
Energy-driven price swings strain margins because the metal packaging market still relies on contracts with pass-through clauses that lag spot fluctuations. North American tariffs add complexity, forcing producers to blend hedging tools with regional sourcing to protect competitiveness.European smelters face persistent energy-cost pressure, contributing to global price turbulence. While large players offset volatility through scrap-based feedstocks and multi-year agreements, smaller converters remain exposed, which can slow capital investment cycles.
Other drivers and restraints analyzed in the detailed report include:
- Retailers' Plastic-to-Metal Substitution Pledges
- High Scrap Recovery Rates Lower True Cost vs. PET
- Brand-Owner Push-Back on Scope-3 CO2 Footprint
For complete list of drivers and restraints, kindly check the Table Of Contents.
Segment Analysis
Aluminium generated 42.80% of the metal packaging market share in 2025 and is projected to grow at a 3.57% CAGR through 2031, benefiting from closed-loop recycling systems that meet PPWR mandates. Steel maintains relevance in large-format food and industrial drums but grows more slowly due to weight and energy considerations. Novelis's USD 90 million UK expansion to double can-recycling capacity underscores the material's strategic importance. Aluminium's light weight reduces logistics emissions, aligning with ESG scorecards and deepening customer loyalty among beverage brands. Market participants continue to invest in remelt technology, enabling the metal packaging market size associated with secondary aluminium to expand steadily.
Secondary aluminium pricing advantages help brands manage raw-material costs relative to virgin metal, mitigating procurement risk. Hindalco's USD 10 billion capacity plan illustrates how integrated smelting and recycling hubs shorten supply chains and support aggressive recycled-content targets. Steel's magnetic recoverability remains a plus in mixed-waste streams, yet higher container weight raises transport costs as carbon taxes spread. Altogether, aluminium's cost, circularity, and weight advantages cement its leadership position, even as steel serves resilient niches that prioritize mechanical strength and puncture resistance.
Cans represented 41.12% of the metal packaging market in 2025 and are set to grow at a 6.08% CAGR, propelled by the premiumisation of RTD coffee, hard seltzer, and functional beverages across global convenience channels. Ball's Dynamark Advanced Pro variable-graphics system personalizes cans at scale, allowing marketers to boost engagement and shelf appeal. Food cans hold a stable base, supplying high-barrier protection that underwrites global trade in tomato paste, soups, and pet food. Aerosol cans tap personal-care growth as pent-up post-pandemic demand lifts hair styling, deodorant, and household-cleaning categories in emerging markets.
Light-weighting initiatives reduce aluminium per unit without compromising integrity, helping contain costs and shrink scope-3 footprints. Caps, closures, and lug lids maintain niche relevance by providing tamper evidence and convenience. Bulk drums and intermediate steel containers retain popularity for agrochemicals and edible oils, where reusability and UN transport certifications are critical. Collectively, these dynamics guarantee that cans remain the metal packaging market's flagship product while ancillary segments evolve through material science and design innovation.
The Metal Packaging Market Report is Segmented by Material Type (Aluminum, Steel), Product Type (Bulk Containers, Shipping Barrels and Drums, Caps and Closures, and More), End-User Industry (Beverage, Food, and More), Coating/Lining Type (BPA-Based Epoxy, BPA-NI Epoxy and More), Container Capacity (less Than 250 Ml, 251-500, and More), Geography (North America, and More). The Market Forecasts are Provided in Terms of Value (USD).
Geography Analysis
Asia-Pacific held 38.21% of the metal packaging market in 2025 and is tracking a 5.89% CAGR through 2031, anchored by China's burgeoning RTD sector and India's rising middle class. Localised can-sheet supply, combined with Hindalco's multi-billion-dollar smelter-plus-recycling build-out, underpins cost leadership and circular credentials that appeal to global brand owners. Japan contributes design leadership, exporting high-quality chuhai formats that influence regional adoption patterns, while Southeast Asian nations leverage tourism-driven beverage demand and emerging deposit-return pilots.
North America represents a mature arena where domestic can lines run near full utilisation, cushioned by long-term supply contracts with major beer and soft-drink fillers. Tariff regimes compel canmakers to source metal domestically, spurring investment in scrap-based billet facilities and warehouse automation to drive down per-unit costs. Widespread state-level bottle bills keep aluminium recovery rates above 60%, bolstering feedstock security for secondary production.
Europe combines rigorous PPWR requirements with sophisticated recycling networks, making it a crucible for coating innovations and digital watermark pilots. Crown's scalable plants in Spain and Italy recently added high-speed lines to serve craft-beer exporters, evidencing sustained opportunity even within a saturated market. South America, spearheaded by Brazil, exhibits strong volume growth as beer brand owners convert to cans for premium positioning and logistics efficiency.
The Middle East and Africa trail on infrastructure, yet population expansion and rising incomes provide greenfield prospects for aerosol deodorant and canned-food penetration, ensuring region-wide growth contributions to the global metal packaging market.
- Ardagh Metal Packaging S.A.
- Ball Corporation
- Crown Holdings Inc.
- CANPACK S.A.
- Silgan Holdings Inc.
- Greif Inc.
- TUBEX Packaging GmbH
- Mauser Packaging Solutions
- Nampak Limited
- Colep Packaging
- CPMC Holdings Ltd.
- Toyo Seikan Group Holdings
- Amcor plc (Metal division)
- AptarGroup Inc.
- Alcoa Corporation
- Sherwin-Williams (Can Coatings)
- Novelis Inc.
- Hindalco Industries Ltd.
- RPC Group plc
- BWAY Corporation
- Berlin Packaging
Additional Benefits:
- The market estimate (ME) sheet in Excel format
- 3 months of analyst support
TABLE OF CONTENTS
1 INTRODUCTION
- 1.1 Study Assumptions and Market Definition
- 1.2 Scope of the Study
2 RESEARCH METHODOLOGY
3 EXECUTIVE SUMMARY
4 MARKET LANDSCAPE
- 4.1 Market Overview
- 4.2 Market Drivers
- 4.2.1 Circular-economy mandates boost can-to-can recycling loops
- 4.2.2 Premiumisation of RTD beverages in emerging Asia
- 4.2.3 Retailers' plastic-to-metal substitution pledges
- 4.2.4 High scrap recovery rates lower true cost vs. PET
- 4.2.5 In-can QR/NFC tech unlocking consumer-data monetisation
- 4.2.6 Expansion of e-commerce and DTC beverage retailing
- 4.3 Market Restraints
- 4.3.1 Price volatility of LME aluminium and steel
- 4.3.2 Brand-owner push-back on scope-3 CO? footprint
- 4.3.3 Rise of mono-material paper bottles
- 4.3.4 High production and operational costs of metal packaging
- 4.4 Supply-Chain Analysis
- 4.5 Regulatory Landscape
- 4.6 Technological Outlook
- 4.7 Porter's Five Forces Analysis
- 4.7.1 Bargaining Power of Suppliers
- 4.7.2 Bargaining Power of Buyers
- 4.7.3 Threat of New Entrants
- 4.7.4 Threat of Substitutes
- 4.7.5 Intensity of Competitive Rivalry
- 4.8 Impact of Geopolitical Scenario on the Market
- 4.9 Investment Analysis
5 MARKET SIZE AND GROWTH FORECASTS (VALUE)
- 5.1 By Material Type
- 5.1.1 Aluminium
- 5.1.2 Steel
- 5.2 By Product Type
- 5.2.1 Cans
- 5.2.1.1 Food Cans
- 5.2.1.2 Beverage Cans
- 5.2.1.3 Aerosol Cans
- 5.2.2 Bulk Containers
- 5.2.3 Shipping Barrels and Drums
- 5.2.4 Caps and Closures
- 5.2.1 Cans
- 5.3 By End-user Industry
- 5.3.1 Beverage
- 5.3.2 Food
- 5.3.3 Cosmetics and Personal Care
- 5.3.4 Household
- 5.3.5 Other End-user Industry
- 5.4 By Coating / Lining Type
- 5.4.1 BPA-Based Epoxy
- 5.4.2 BPA-NI Epoxy
- 5.4.3 Polyester / PET
- 5.4.4 Other Coating / Lining Type
- 5.5 By Container Capacity
- 5.5.1 Less than 250 ml
- 5.5.2 251 - 500 ml
- 5.5.3 501 - 1000 ml
- 5.5.4 More than 1000 ml
- 5.6 By Geography
- 5.6.1 North America
- 5.6.1.1 United States
- 5.6.1.2 Canada
- 5.6.1.3 Mexico
- 5.6.2 Europe
- 5.6.2.1 Germany
- 5.6.2.2 United Kingdom
- 5.6.2.3 France
- 5.6.2.4 Italy
- 5.6.2.5 Spain
- 5.6.2.6 Russia
- 5.6.2.7 Rest of Europe
- 5.6.3 Asia-Pacific
- 5.6.3.1 China
- 5.6.3.2 India
- 5.6.3.3 Japan
- 5.6.3.4 South Korea
- 5.6.3.5 Australia and New Zealand
- 5.6.3.6 Rest of Asia-Pacific
- 5.6.4 Middle East and Africa
- 5.6.4.1 Middle East
- 5.6.4.1.1 United Arab Emirates
- 5.6.4.1.2 Saudi Arabia
- 5.6.4.1.3 Turkey
- 5.6.4.1.4 Rest of Middle East
- 5.6.4.2 Africa
- 5.6.4.2.1 South Africa
- 5.6.4.2.2 Nigeria
- 5.6.4.2.3 Egypt
- 5.6.4.2.4 Rest of Africa
- 5.6.4.1 Middle East
- 5.6.5 South America
- 5.6.5.1 Brazil
- 5.6.5.2 Argentina
- 5.6.5.3 Rest of South America
- 5.6.1 North America
6 COMPETITIVE LANDSCAPE
- 6.1 Market Concentration
- 6.2 Strategic Moves
- 6.3 Market Share Analysis
- 6.4 Company Profiles (includes Global level Overview, Market level overview, Core Segments, Financials as available, Strategic Information, Market Rank/Share for key companies, Products and Services, and Recent Developments)
- 6.4.1 Ardagh Metal Packaging S.A.
- 6.4.2 Ball Corporation
- 6.4.3 Crown Holdings Inc.
- 6.4.4 CANPACK S.A.
- 6.4.5 Silgan Holdings Inc.
- 6.4.6 Greif Inc.
- 6.4.7 TUBEX Packaging GmbH
- 6.4.8 Mauser Packaging Solutions
- 6.4.9 Nampak Limited
- 6.4.10 Colep Packaging
- 6.4.11 CPMC Holdings Ltd.
- 6.4.12 Toyo Seikan Group Holdings
- 6.4.13 Amcor plc (Metal division)
- 6.4.14 AptarGroup Inc.
- 6.4.15 Alcoa Corporation
- 6.4.16 Sherwin-Williams (Can Coatings)
- 6.4.17 Novelis Inc.
- 6.4.18 Hindalco Industries Ltd.
- 6.4.19 RPC Group plc
- 6.4.20 BWAY Corporation
- 6.4.21 Berlin Packaging
7 MARKET OPPORTUNITIES AND FUTURE OUTLOOK
- 7.1 White-space and Unmet-need Assessment
 金属包装市场:依产品类型、材料类型、涂层类型、产品设计、生产技术和最终用途产业划分-2026-2032年全球预测
 泰国金属包装:市场占有率分析、产业趋势与统计、成长预测(2026-2031)
 2026-2030年全球轻量化金属包装市场
 金属包装市场规模、份额及成长分析(依产品类型、材料、应用及地区划分)-2026-2033年产业预测
 全球金属包装市场预测(至2032年):按产品类型、材质、最终用户和地区分類的分析
 金属包装市场:依材料、产品类型、最终用途产业及地区划分
 2025-2033年金属包装市场报告(依产品类型、材料、应用和地区)乳製品金属包装市场按容器类型、材料类型、封盖类型、应用和分销管道划分 - 全球预测 2025-2030
 全球金属包装市场:市场规模、份额、趋势分析(按材料、产品类型、最终用途和地区)、细分市场预测(2025-2030 年)印度金属包装:市场占有率分析、行业趋势和成长预测(2025-2030 年)