


 |
市场调查报告书
商品编码
1906144
中东和非洲生物肥料市场份额分析、行业趋势、统计数据和成长预测(2026-2031 年)Middle East And Africa Biofertilizers - Market Share Analysis, Industry Trends & Statistics, Growth Forecasts (2026 - 2031) |
||||||
※ 本网页内容可能与最新版本有所差异。详细情况请与我们联繫。
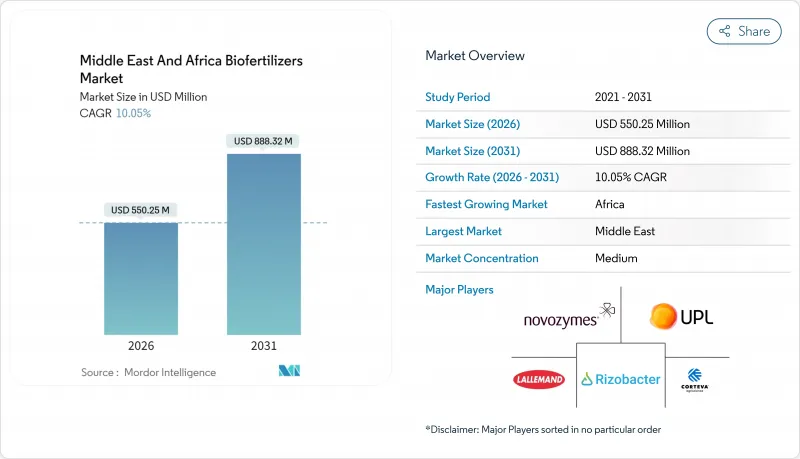
2025年中东和非洲生物肥料市场价值5亿美元,预计到2031年将达到8.8832亿美元,高于2026年的5.5025亿美元。
预计在预测期(2026-2031 年)内,复合年增长率将达到 10.05%。
这一成长势头是由区域特有的挑战所驱动的,例如水资源短缺、土壤盐碱化和合成肥料价格波动,这些挑战正在加速向生物来源肥料的转型。沙乌地阿拉伯的「2030愿景」、南非的「生物投入品监管加速计画」以及非洲联盟的「肥料自给自足计画」等政府倡议,透过降低监管壁垒和提供生物投入品补贴,支持生物肥料的推广应用。跨国供应商正透过本地生产和有针对性的伙伴关係来深化其市场地位,而本土创新者则透过开发适应严苛农业气候条件的微生物菌株来占据市场利基。在与气候智慧型农业目标一致的政策支持下,这些因素预计将推动中东和北非地区生物肥料市场的强劲成长。
中东和非洲生物肥料市场趋势及洞察
扩大经认证的有机农田
2019年至2024年间,中东和非洲主要市场的面积将持续成长,其中埃及、肯亚和南非的普及率将领先。这一成长趋势推动了对生物肥料的需求,因为有机认证标准要求使用生物投入物而非合成投入物。肯亚的有机农业目前覆盖面积超过16.5万公顷,主要得益于出口市场的高价以及政府透过国家有机农业政策提供的支持。这种扩张为生物肥料供应商创造了竞争激烈的市场,尤其是那些提供能够满足有机生产系统复杂营养需求的多菌株配方的供应商。摩洛哥的「绿色摩洛哥计画」投入大量资源支持有机转型,建立有利于生物投入物的法规结构,并制定品质认证途径。
有机材料的补助和优惠政策
全部区域政府的补贴体係日益倾向生物投入品。摩洛哥的有机投入品补贴计画使农民采用生物投入品的成本比未补贴的合成投入品降低了25%。沙乌地阿拉伯环境、水利和农业部正根据「2030愿景」的永续性目标,为采用生物营养管理系统的温室经营者提供有针对性的支援。这些政策转变体现了对生物投入品有助于实现粮食安全目标并降低进口依赖性的战略认识。阿拉伯联合大公国的《2051年国家粮食安全战略》明确优先考虑本地生产技术,包括用于可控环境农业的微生物接种剂。南非《肥料、饲料、农业化学品和畜牧化学品法》下的法规结构为生物肥料註册提供了明确的途径,但从3500兰特(202.30美元)的产品註册费到1800兰特(104.06美元)的续期费,高昂的费用对小规模生产商构成了一定的成本障碍。
补贴化肥的主导地位
尼日利亚、埃及和其他主要农业经济体的国家化肥补贴体系使合成肥料在价格敏感的市场领域拥有结构性优势,从而挤压了生物肥料的生存空间。尼日利亚的化肥补贴体系虽然有助于实现粮食安全目标,但由于人为地维持了生物肥料相对于进口合成肥料的价格优势,无意中限制了生物肥料的推广应用。埃及的补贴框架同样偏向传统肥料,但近期的政策讨论表明,未来有可能将生物肥料纳入补贴体系。这些体系造成了市场扭曲,迫使生物肥料供应商在性能而非成本方面竞争。维持补贴体系的财政负担未来可能为生物肥料的推广创造机会,因为各国政府会寻求更具成本效益的替代方案来提高农业生产力,同时缓解预算压力。
细分市场分析
到2025年,根瘤菌生物肥料将占据35.85%的市场份额,这反映了豆类种植在该地区对粮食安全和土壤肥力管理的重要性。这项优势源自于成熟的农艺知识和经证实有效的固氮技术,而这些技术也深受注重成本的农民青睐。跨国公司与区域研究机构之间的技术转移协议促进了双品牌建设,并有助于增强主要合作社之间的信任。将根瘤菌的应用与保护性耕作技术结合的培训模组进一步巩固了重复销售的基础。
菌根产品是成长最快的细分市场,预计到2031年将以12.75%的复合年增长率成长,这主要得益于高价值温室栽培和干旱地区农业系统的应用。在这些环境中,养分吸收的改善能够带来可观的产量提升。全部区域的研究活动日益集中在适应当地土壤条件和气候胁迫的本土微生物菌株,随着市场对本地产品的接受度不断提高,竞争格局预计将会重组。投资于菌株筛选和本地化改造的公司预计将从国际通用配方中抢占市场份额。
预计到2025年,载体增强型生物肥料将维持56.80%的市场份额,这反映了其与小规模农户现有施用方式的兼容性以及其成本效益。这些配方利用褐煤和木炭等当地易得的载体,降低了生产成本并支持了当地供应链。技术细分反映了市场两极化的现状:一方面是成本敏感的小农户应用,另一方面是性能驱动的商业性营运。随着市场日趋成熟和品质标准日益严格,开发能够在高温条件下维持活性的气候适应型配方的公司有望获得更大的相对价值。
液态生物肥料预计将成为成长最快的技术领域,到2031年将以15.1%的复合年增长率成长,这主要得益于其在海湾合作委员会(GCC)国家温室种植和精密农业应用的广泛应用。虽然液态生物肥料具有微生物存活率高、易于与灌溉系统整合等优势,但低温运输需求限制了其在基础设施受限市场的普及。
中东和非洲生物肥料市场按微生物类型(例如根瘤菌、固氮菌)、技术类型(例如载体增强型生物肥料、液体生物肥料)、应用(例如土壤改良)、作物类型(例如谷类)和地区(例如非洲、中东)进行细分。市场预测以价值(美元)和数量(公吨)为单位。
其他福利:
- Excel格式的市场预测(ME)表
- 3个月的分析师支持
目录
第一章 引言
- 研究假设和市场定义
- 调查范围
第二章调查方法
第三章执行摘要
第四章 市场情势
- 市场概览
- 市场驱动因素
- 扩大经认证的有机农田
- 补贴和有机材料推广政策
- 合成肥料价格波动
- 沿岸地区土壤盐害缓解计划
- 高科技温室热潮
- 土壤微生物组计划的排碳权试点项目
- 市场限制
- 补贴化肥的主导地位
- 农民意识薄弱,推广网络不完善
- 监管漏洞导致假冒伪劣疫苗的出现
- 液体药品低温运输物流面临的挑战
- 监管环境
- 技术展望
- 波特五力分析
- 新进入者的威胁
- 买方的议价能力
- 供应商的议价能力
- 替代品的威胁
- 竞争对手之间的竞争
第五章 市场规模和成长预测(价值和数量)
- 依微生物类型
- 根瘤菌
- 固氮菌
- 固氮螺菌
- 磷酸盐溶解细菌
- 菌根
- 其他微生物
- 依技术类型
- 载体增强型生物肥料
- 液体生物肥料
- 封装/微珠技术
- 其他技术
- 透过使用
- 土壤处理
- 种子处理
- 叶面喷布/根部浸泡
- 其他用途
- 按作物类型
- 粮食
- 豆子
- 经济作物
- 水果和蔬菜
- 其他作物
- 按地区
- 非洲
- 南非
- 肯亚
- 乌干达
- 坦尚尼亚
- 奈及利亚
- 其他非洲地区
- 中东
- 阿拉伯聯合大公国
- 沙乌地阿拉伯
- 土耳其
- 埃及
- 卡达
- 其他中东地区
- 非洲
第六章 竞争情势
- 市场集中度
- 策略趋势
- 市占率分析
- 公司简介
- Novozymes A/S
- UPL Limited
- Lallemand Inc
- Corteva, Inc.
- Rizobacter Argentina SA
- FMC Corporation
- Koppert BV
- IPL Biologicals Limited
- Groundwork BioAg Ltd.
- Biobest Group NV
- Biomax Technologies Pte. Ltd.
- Mapleton Agri Biotec Pty Ltd
- BASF SE
- Bayer AG
- Corteva Agriscience
第七章 市场机会与未来展望
The Middle East and Africa biofertilizers market was valued at USD 500 million in 2025 and estimated to grow from USD 550.25 million in 2026 to reach USD 888.32 million by 2031, at a CAGR of 10.05% during the forecast period (2026-2031).
Momentum stems from region-specific pressures including water scarcity, soil salinity, and synthetic input price volatility, which are accelerating the shift toward biologically based options. Government programs such as Saudi Arabia's Vision 2030, South Africa's regulatory fast-track for biologicals, and the African Union's fertilizer self-sufficiency agenda reinforce adoption by lowering regulatory hurdles and subsidizing biological inputs. Multinational suppliers deepen their presence through local manufacturing and targeted partnerships, while regional innovators secure niches by tailoring microbial strains to harsh agro-climatic conditions. Collectively, these forces position the Middle East and Africa biofertilizers market for robust, policy-backed expansion that aligns with climate-smart agriculture goals.
Middle East And Africa Biofertilizers Market Trends and Insights
Expansion of Organic-Certified Farmland
Certified organic acreage across key Middle East & Africa markets expanded between 2019-2024, with Egypt, Kenya, and South Africa leading adoption rates. This growth trajectory accelerates biofertilizer demand as organic certification standards mandate biological inputs over synthetic alternatives. Kenya's organic sector now encompasses over 165,000 hectares, driven by export market premiums and government support through the National Organic Agriculture Policy. The expansion creates a captive market for biofertilizer suppliers, particularly those offering multi-strain formulations that address the complex nutrient needs of organic production systems. Morocco's Green Morocco Plan has allocated significant resources to organic transition support, creating regulatory frameworks that favor biological inputs and establish quality certification pathways.
Subsidies and Favorable Organic-Input Policies
Government subsidy schemes across the region increasingly favor biological inputs, with Morocco's organic-input subsidy program reducing farmer adoption costs by 25% compared to unsubsidized synthetic alternatives. Saudi Arabia's Ministry of Environment, Water, and Agriculture has implemented targeted support for greenhouse operators adopting biological nutrient management systems, aligning with Vision 2030 sustainability objectives. These policy shifts reflect strategic recognition that biological inputs support food security goals while reducing import dependency. The UAE's National Food Security Strategy 2051 explicitly prioritizes local production technologies, including microbial inoculants for controlled environment agriculture. South Africa's regulatory framework under the Fertilizers, Farm Feeds, Agricultural Remedies and Stock Remedies Act provides clear pathways for biofertilizer registration, though fees ranging from R 3,500 (USD 202.30) for product registration to R 1,800 (USD 104.06) for renewals create cost barriers for smaller manufacturers .
Dominance of Subsidized Synthetic Fertilizers
National fertilizer subsidy programs in Nigeria, Egypt, and other major agricultural economies create structural advantages for synthetic inputs that crowd out biological alternatives in price-sensitive market segments. Nigeria's fertilizer subsidy program, while supporting food security objectives, inadvertently limits biofertilizer adoption by maintaining artificial price advantages for imported synthetic products. Egypt's subsidy framework similarly favors conventional inputs, though recent policy discussions indicate potential inclusion of biological products in future subsidy schemes. These programs create market distortions that require biofertilizer suppliers to compete on performance differentiation rather than cost parity. The fiscal burden of maintaining subsidy programs may create future opportunities for biological inputs as governments seek cost-effective alternatives that support agricultural productivity while reducing budget pressures.
Other drivers and restraints analyzed in the detailed report include:
- Synthetic-Fertilizer Price Volatility
- High-Tech Greenhouse Boom
- Low Farmer Awareness and Weak Extension Networks
For complete list of drivers and restraints, kindly check the Table Of Contents.
Segment Analysis
Rhizobium-based biofertilizers command 35.85% market share in 2025, reflecting the region's substantial legume cultivation for both food security and soil fertility management. This dominance stems from well-established agronomic understanding and proven nitrogen fixation benefits that resonate with cost-conscious farmers.Technology transfer agreements between multinationals and regional labs promote dual branding, enhancing trust among progressive cooperatives. Training modules that bundle Rhizobium use with conservation agriculture practices further anchor repeat sales.
Mycorrhizal products represent the fastest-growing segment at 12.75% CAGR through 2031, driven by adoption in high-value greenhouse operations and drought-prone farming systems where enhanced nutrient uptake provides measurable yield advantages. Research initiatives across the region increasingly focus on indigenous microbial strains adapted to local soil conditions and climatic stresses, potentially reshaping competitive dynamics as locally sourced products gain market acceptance. Companies investing in strain selection and regional adaptation are positioned to capture market share from generic international formulations.
Carrier-enriched biofertilizers maintain 56.80% market share in 2025, reflecting their cost-effectiveness and compatibility with existing farmer application practices across smallholder systems. These formulations utilize locally available carriers such as lignite and charcoal, reducing production costs and supporting regional supply chains. The technology segmentation reflects broader market bifurcation between cost-focused smallholder applications and performance-oriented commercial operations. Companies developing climate-adapted formulations that maintain viability under high-temperature conditions are likely to capture disproportionate value as the market matures and quality standards tighten.
Liquid biofertilizers emerge as the fastest-growing technology segment with 15.1% CAGR through 2031, primarily driven by greenhouse adoption in GCC countries and precision agriculture applications. The liquid segment benefits from superior microbial viability and ease of integration with fertigation systems, though cold-chain requirements limit adoption in infrastructure-constrained markets.
The Middle East and Africa Biofertilizers Market is Segmented by Microorganism Type (Rhizobium, Azotobacter, and More), by Technology Type (Carrier-Enriched Biofertilizers, Liquid Biofertilizers, and More), by Application (Soil Treatment, and More), by Crop Type (Grains and Cereals, and More), and by Geography (Africa, and the Middle East). The Market Forecasts are Provided in Terms of Value (USD) and Volume (Metric Tons).
List of Companies Covered in this Report:
- Novozymes A/S
- UPL Limited
- Lallemand Inc
- Corteva, Inc.
- Rizobacter Argentina S.A.
- FMC Corporation
- Koppert B.V.
- IPL Biologicals Limited
- Groundwork BioAg Ltd.
- Biobest Group NV
- Biomax Technologies Pte. Ltd.
- Mapleton Agri Biotec Pty Ltd
- BASF SE
- Bayer AG
- Corteva Agriscience
Additional Benefits:
- The market estimate (ME) sheet in Excel format
- 3 months of analyst support
TABLE OF CONTENTS
1 Introduction
- 1.1 Study Assumptions and Market Definition
- 1.2 Scope of the Study
2 Research Methodology
3 Executive Summary
4 Market Landscape
- 4.1 Market Overview
- 4.2 Market Drivers
- 4.2.1 Expansion of organic-certified farmland
- 4.2.2 Subsidies and favorable organic-input policies
- 4.2.3 Synthetic-fertilizer price volatility
- 4.2.4 Salinity-mitigation programs in Gulf soils
- 4.2.5 High-tech greenhouse boom
- 4.2.6 Carbon-credit pilots for soil microbiome projects
- 4.3 Market Restraints
- 4.3.1 Dominance of subsidized synthetic fertilizers
- 4.3.2 Low farmer awareness and weak extension networks
- 4.3.3 Counterfeit / low-quality inoculants from regulatory gaps
- 4.3.4 Cold-chain logistics hurdles for liquid formulations
- 4.4 Regulatory Landscape
- 4.5 Technological Outlook
- 4.6 Porter's Five Forces Analysis
- 4.6.1 Threat of New Entrants
- 4.6.2 Bargaining Power of Buyers
- 4.6.3 Bargaining Power of Suppliers
- 4.6.4 Threat of Substitutes
- 4.6.5 Competitive Rivalry
5 Market Size and Growth Forecasts (Value and Volume)
- 5.1 By Microorganism Type
- 5.1.1 Rhizobium
- 5.1.2 Azotobacter
- 5.1.3 Azospirillum
- 5.1.4 Phosphate-solubilizing Bacteria
- 5.1.5 Mycorrhiza
- 5.1.6 Other Microorganisms
- 5.2 By Technology Type
- 5.2.1 Carrier-enriched Biofertilizers
- 5.2.2 Liquid Biofertilizers
- 5.2.3 Encapsulated / Bead Technology
- 5.2.4 Other Technologies
- 5.3 By Application
- 5.3.1 Soil Treatment
- 5.3.2 Seed Treatment
- 5.3.3 Foliar / Root Dipping
- 5.3.4 Other Applications
- 5.4 By Crop Type
- 5.4.1 Grains
- 5.4.2 Pulses
- 5.4.3 Commercial Crops
- 5.4.4 Fruits and Vegetables
- 5.4.5 Other Crops
- 5.5 By Geography
- 5.5.1 Africa
- 5.5.1.1 South Africa
- 5.5.1.2 Kenya
- 5.5.1.3 Uganda
- 5.5.1.4 Tanzania
- 5.5.1.5 Nigeria
- 5.5.1.6 Rest of Africa
- 5.5.2 Middle East
- 5.5.2.1 United Arab Emirates
- 5.5.2.2 Saudi Arabia
- 5.5.2.3 Turkey
- 5.5.2.4 Egypt
- 5.5.2.5 Qatar
- 5.5.2.6 Rest of Middle East
- 5.5.1 Africa
6 Competitive Landscape
- 6.1 Market Concentration
- 6.2 Strategic Moves
- 6.3 Market Share Analysis
- 6.4 Company Profiles (Includes Global Level Overview, Market Level Overview, Core Segments, Financials as Available, Strategic Information, Market Rank/Share, Products and Services, Recent Developments)
- 6.4.1 Novozymes A/S
- 6.4.2 UPL Limited
- 6.4.3 Lallemand Inc
- 6.4.4 Corteva, Inc.
- 6.4.5 Rizobacter Argentina S.A.
- 6.4.6 FMC Corporation
- 6.4.7 Koppert B.V.
- 6.4.8 IPL Biologicals Limited
- 6.4.9 Groundwork BioAg Ltd.
- 6.4.10 Biobest Group NV
- 6.4.11 Biomax Technologies Pte. Ltd.
- 6.4.12 Mapleton Agri Biotec Pty Ltd
- 6.4.13 BASF SE
- 6.4.14 Bayer AG
- 6.4.15 Corteva Agriscience
7 Market Opportunities and Future Outlook
 基于固氮菌的生物肥料市场:2026-2032年全球市场预测(按产品类型、作物类型、配方类型、应用方法、分销管道和最终用户划分)生物肥料市场:按类型、形态、作物类型、应用方法和分销管道划分-2026-2032年全球市场预测
 2026年全球生物肥料市场报告
 2034年生物肥料接种剂市场预测-按产品类型、微生物类型、配方类型、应用方法、作物类型、通路和地区分類的全球分析
 生物肥料市场规模、份额、趋势和预测:按类型、作物、微生物、应用方法和地区划分,2026-2034年
 生物有机肥料:市场占有率分析、产业趋势与统计、成长预测(2026-2031)
 生物肥料市场规模、份额、成长及全球产业分析:按类型和应用划分,区域洞察及2026-2034年预测生物肥料:市场占有率分析、产业趋势与统计、成长预测(2026-2031)全球生物肥料市场规模、份额、趋势和成长分析报告(2026-2034年)2026年全球根瘤菌肥料市场报告