


 |
市场调查报告书
商品编码
1906186
电动汽车零件:市场占有率分析、产业趋势与统计、成长预测(2026-2031)Electric Vehicle Parts And Components - Market Share Analysis, Industry Trends & Statistics, Growth Forecasts (2026 - 2031) |
||||||
※ 本网页内容可能与最新版本有所差异。详细情况请与我们联繫。
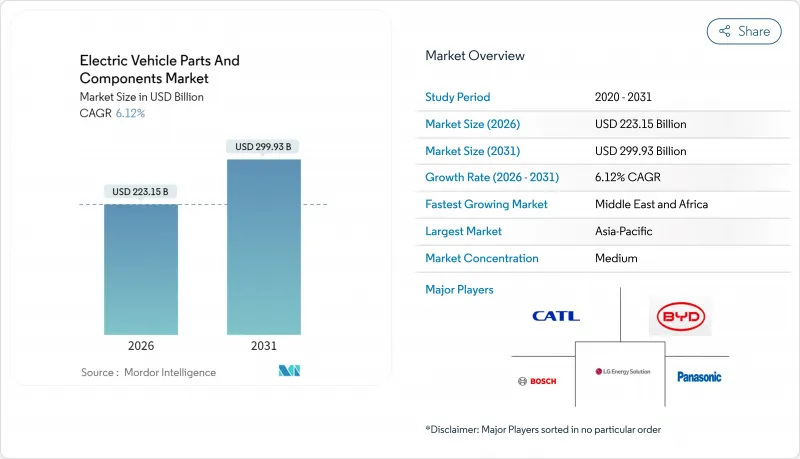
2025年电动车零件市场价值为2,102.8亿美元,预计到2031年将达到2,999.3亿美元,而2026年为2,231.5亿美元。
预计在预测期(2026-2031 年)内,复合年增长率将达到 6.12%。
与先前两位数的成长相比,扩张速度放缓表明,规模化生产、零件标准化和可预测的政策框架正在取代早期采用的强劲势头,预示着供需平衡的转变。锂离子电池成本下降、零排放法规同步实施以及公共快速充电基础设施的快速部署支撑了市场需求,而整车製造商向800V平台的转型则推高了每辆车的半导体负载。由于传统的一级供应商、电池专家和晶圆厂主导的半导体公司在不同的零件层级竞争,市场将持续保持适度分散的局面。区域供应链在地化策略和关键矿产资源的采购挑战将继续影响整个价值链的定价权和资本投资重点。
全球电动车零件市场趋势及洞察
锂离子电池成本下降和超级工厂产能
2023年,随着全球电池产能超过1,200吉瓦时,全球电池组价格降至每度电139美元。成本下降使电动车更具价格竞争力,缩短了车队营运商的投资回收期,并鼓励汽车製造商投资建造自有电池组组装线。在欧洲和北美建造区域性超级工厂,既能降低汇率和物流风险,又能帮助车辆获得国产化奖励。供应安全易受氢氧化锂和高镍正极材料加工瓶颈的影响,迫使矿业公司和化学精炼企业加快产能扩张。总体而言,较便宜的电池组支援更高能量密度的电池方案,从而缓解里程焦虑,并巩固了固态电池的技术蓝图。
政府激励措施和零排放车辆法规
《通膨控制法案》提供与在在地采购挂钩的7,500美元税额扣抵,鼓励供应商扩大美国生产。欧洲的「适航55」计画将2035年设定为内燃机乘用车销售的截止日期,为零部件投资确立了长期视角。中国双轨制在2024年实现1,130万辆电动车销量后,持续刺激需求。补贴政策的设计重点在于国内製造、研发津贴和充电网路联合融资,确保政策支持不仅限于零售价格下调。全球三大汽车市场监管时间表的趋同正在推动全球销售成长,并使供应商能够利用更广泛、更可预测的累积订单来摊销研发成本。
关键矿物供应瓶颈
2024年,碳酸锂价格年初显着上涨,随后在年底大幅下跌。这些价格波动凸显了全球供需环境的变化,这种变化正在影响电池生产成本,并影响电动车和储能产业的策略。炼油产能缺口而非矿石短缺是主要阻碍因素,迫使矿商和正极材料製造商加快推进前置作业时间长达两年的氢氧化物计划。对钴的依赖加剧了政治风险,而硫酸镍的短缺则延缓了高能量密度电池设计的研发。电池製造商正在转向磷酸锂铁,以缓解这种受限材料的压力。短期价格波动迫使原始设备製造商(OEM)重新评估其价格对冲策略和电池组设计蓝图。
细分市场分析
到2025年,乘用车将占电动车零件市场收入的72.65%,而商用车将以8.46%的复合年增长率超越乘用车。用于最后一公里配送的轻型商用货车正在使用容量合适的电池组和成本优化的温度控管系统,以在走走停停的驾驶循环中高效运行。公车正在利用可预测的停车场和高容量液冷充电器,将高昂的初始零件成本分摊到日常运转率中。中型和重型卡车开始采用续航里程达300英里的电池配置,以支援区域货运走廊,推动了对高性能电池、兆瓦级充电耦合器和预测性维护感测器的需求。乘用车专案正日趋成熟,紧凑型和中型车型的成本竞争力日益增强。同时,豪华跨界车正在推动800V系统和碳化硅牵引逆变器的广泛应用。在这两个领域,车队需求都会影响采购週期,并创造销售量,使零件供应商能够比仅依靠零售需求更快地扩大规模。
总体而言,商用车电气化正在重塑售后市场需求。行驶里程的增加将加剧冷却板、线路和接触器的磨损,从而推高零件更换收入。车队营运商需要具备远端资讯处理功能的车辆状态监控系统,这促使供应商整合感测器,并将资料传输到云端进行分析。营运数据和硬体可靠性之间的相互依存关係将推动汽车製造商、远端资讯处理服务提供者和一级供应商之间的合作,从而强化市场向服务主导经营模式的转变。
由于电池组成本下降和充电网路日趋成熟,纯电动车计画在2025年仍将维持61.70%的收入份额。插电式混合动力车作为一种过渡技术,其价值提案因电池成本下降而受到削弱。燃料电池电动车(FCEV)虽然在2025年仍处于小规模应用,但随着氢气加註与现有货运站的运行时间表和负载容量要求相契合,它们将在长途和重型运输试点项目中发挥主导作用。其8.05%的复合年增长率反映的是干线加氢站的基础设施投资,而非乘用车的普及。
对零件的影响将大相径庭。纯电动车 (BEV) 优先考虑高能量密度电池、快速充电介面和相容 V2G 技术的动力模组。燃料电池电动车 (FCEV) 则依赖碳纤维氢气罐、铂基电堆和高温压缩机。两条供应链上的企业都将实现收入来源多元化,但必须分别管理各自的品管和认证流程。那些致力于将氢能基础设施打造为货运枢纽的政策制定者,将决定到本十年末,燃料电池电动车的产量是否能够成长到足以改变零件结构的程度。
区域分析
到2025年,亚太地区将占全球电动车收入的58.10%,这主要得益于中国国内电动车註册量的庞大规模,当年中国电动车註册量达到1,130万辆。中国拥有从锂转化、正极材料生产到马达组装的完整价值链,这使其具有成本优势并缩短了研发週期。日本擅长高精度马达和电力电子技术,而韩国则在NCM电池组分和软包技术方面主导。印度的生产挂钩激励政策帮助振兴了当地的模组工厂并吸引了外国电池製造商,在过去十年间,该地区已从最终组装转向更深层的零件整合。
2026年至2031年,中东和非洲地区的复合年增长率将达到7.96%,位居全球之首。由阿联酋和沙乌地阿拉伯的主权财富基金领导的计划正在资助待开发区电动汽车工厂、电池机壳和碳化硅晶片工厂,并利用太阳能资源降低电解过程的能源成本。南非则利用铂族金属生产燃料电池堆,利用锰生产磷酸铁锂电池正极材料,将矿产资源更深入地融入国内价值链。电网升级和可再生能源的扩张将决定该地区零件生产的成长速度。
在北美,通用汽车正投资350亿美元建造电池芯和材料工厂,受益于《通货膨胀控制法案》,该法案将税额扣抵与国产化率挂钩。虽然在地化生产降低了外汇风险和运输成本,但也需要为隔膜、集电器和正极黏合剂建立新的供应链。在欧洲,回收配额和循环经济指令至关重要,新建的超级工厂计划包括一条黑料处理生产线,用于回收钴和镍,以用于封闭回路型正极材料。环境法规越来越重视生命週期分析软体和可追溯性模组在每个组件材料清单中的作用。
其他福利:
- Excel格式的市场预测(ME)表
- 3个月的分析师支持
目录
第一章 引言
- 研究假设和市场定义
- 调查范围
第二章调查方法
第三章执行摘要
第四章 市场情势
- 市场概览
- 市场驱动因素
- 锂离子电池成本下降和超级工厂产量增加
- 政府奖励和零排放车辆(ZEV)强制令
- OEM厂商向800V架构转型推动电力电子产品需求
- 扩大公共快速充电基础设施
- 碳化硅元件的广泛应用将推高元件成本。
- 软体定义电动动力传动系统控制单元的兴起
- 市场限制
- 关键矿产供应瓶颈
- 新兴市场电网容量短缺
- 稀土元素磁铁的价格波动
- 原始设备製造商的垂直整合给一级供应商的收入基础带来了压力。
- 价值/供应链分析
- 监管环境
- 技术展望
- 波特五力模型
- 新进入者的威胁
- 买方/消费者的议价能力
- 供应商的议价能力
- 替代品的威胁
- 竞争对手之间的竞争
第五章 市场规模与成长预测
- 按车辆类型
- 搭乘用车
- 袖珍的
- SUV/跨界车
- 奢华
- 商用车辆
- 轻型商用车
- 公车和长途客车
- 中型和重型卡车
- 搭乘用车
- 依推进类型
- 电池式电动车
- 插电式混合动力电动车
- 油电混合车
- 燃料电池电动车
- 依组件类型
- 电池组
- 电池单元
- 电池管理系统
- 电池温度控管系统
- 电动机
- 永磁同步
- 就职
- 切换阻力
- 电力电子
- 逆变器
- 直流-直流转换器
- 车用充电器
- 温度控管元件
- 热交换器
- 冷却板
- 线路、线束和连接器
- 感测器和控制单元
- 电池组
- 透过电压平台
- 最高 400V 系统
- 800V系统
- 超过 800V 系统
- 按地区
- 北美洲
- 美国
- 加拿大
- 北美其他地区
- 南美洲
- 巴西
- 阿根廷
- 其他南美洲
- 欧洲
- 德国
- 英国
- 法国
- 义大利
- 西班牙
- 俄罗斯
- 其他欧洲地区
- 亚太地区
- 中国
- 印度
- 日本
- 韩国
- 澳洲
- 亚太其他地区
- 中东和非洲
- 阿拉伯聯合大公国
- 沙乌地阿拉伯
- 土耳其
- 埃及
- 南非
- 其他中东和非洲地区
- 北美洲
第六章 竞争情势
- 市场集中度
- 策略趋势
- 市占率分析
- 公司简介
- Contemporary Amperex Technology Co. Ltd(CATL)
- LG Energy Solution Ltd
- Panasonic Holdings Corp.
- BYD Co. Ltd
- Samsung SDI Co. Ltd
- Robert Bosch GmbH
- Denso Corporation
- Continental AG
- Hyundai Mobis Co. Ltd
- Toyota Industries Corporation
- BorgWarner Inc.
- Hitachi Astemo Ltd
- Nidec Corporation
- Magna International Inc.
- ZF Friedrichshafen AG
- Vitesco Technologies Group AG
- Aisin Corp.
- Valeo SA
- Infineon Technologies AG
- Aptiv PLC
第七章 市场机会与未来展望
The electric vehicle parts and components market was valued at USD 210.28 billion in 2025 and estimated to grow from USD 223.15 billion in 2026 to reach USD 299.93 billion by 2031, at a CAGR of 6.12% during the forecast period (2026-2031).
Slower expansion versus the earlier double-digit phase signals a shift toward supply-demand balance as scale manufacturing, component standardization, and predictable policy frameworks replace the momentum of early adoption. Declining lithium-ion battery costs, synchronized zero-emission mandates, and rapid public fast-charging roll-outs sustain demand, while OEM migration to 800 V platforms lifts semiconductor content per vehicle. Moderate fragmentation persists because traditional Tier-1 suppliers, battery specialists, and fab-driven semiconductor firms compete across different component layers. Regional supply-chain localization strategies and critical-mineral sourcing challenges continue to shape pricing power and capital-spending priorities across the value chain.
Global Electric Vehicle Parts And Components Market Trends and Insights
Declining Li-ion Battery Costs and Gigafactory Output
Worldwide battery pack prices fell to USD 139 per kWh in 2023 as global cell manufacturing capacity surpassed 1,200 GWh. Falling costs improve electric vehicle affordability, shorten payback periods for fleet operators, and encourage automakers to commit capital to in-house pack assembly lines. Regional gigafactory build-outs in Europe and North America mitigate currency and logistics risks while helping vehicles qualify for domestic-content incentives. Supply security remains vulnerable to lithium hydroxide and high-nickel cathode processing bottlenecks, pressuring mining companies and chemical refiners to accelerate capacity additions. Overall, cheaper packs support higher battery energy density options that keep range anxiety in check and cement the technology roadmap toward solid-state cells.
Government Incentives and ZEV Mandates
The Inflation Reduction Act provides a USD 7,500 tax credit tied to local-content thresholds, pushing suppliers to scale United States production. Europe's Fit for 55 package fixes a 2035 end-date for internal combustion passenger cars, creating long-run visibility for component investments. China's dual-credit mechanism continues stimulating demand after generating 11.3 million EV sales in 2024. Subsidy design now emphasizes domestic manufacturing, R&D grants, and charging-network co-funding, ensuring that policy support transcends retail price cuts. The convergence of regulatory timelines across the three largest auto markets lifts global volumes, allowing suppliers to amortize R&D over broader, more predictable order books.
Critical-Mineral Supply Bottlenecks
In 2024, lithium carbonate prices saw a pronounced early-year surge, only to witness a marked drop as the year drew close. These price swings underscore the evolving global supply-demand landscape, affecting battery production expenses and shaping strategies within the electric vehicle and energy storage sectors. Refining gaps rather than raw-ore shortages became the core constraint, prompting miners and cathode producers to fast-track hydroxide projects with two-year lead times. Cobalt dependence elevates political risk, while nickel sulfate tightness delays high-energy-density designs. Battery makers diversify chemistries toward lithium iron phosphate to ease pressure on constrained materials. Short-term volatility forces OEMs to hedge prices and reevaluate pack design roadmaps.
Other drivers and restraints analyzed in the detailed report include:
- OEM Shift to 800 V Architectures Elevating Power-Electronics Demand
- Rise of Software-Defined E-Powertrain Control Units
- OEM Vertical Integration Squeezing Tier-1 Revenue Pools
For complete list of drivers and restraints, kindly check the Table Of Contents.
Segment Analysis
The passenger car slice of the electric vehicle parts and components market generated 72.65% of 2025 revenue, and commercial vehicles are rising at an 8.46% CAGR, outpacing passenger-car growth. Light commercial vans for last-mile delivery favor right-sized battery packs and cost-optimized thermal systems that operate efficiently in stop-and-go duty cycles. Buses exploit predictable depots, using high-capacity liquid-cooled chargers to amortize higher upfront component costs through daily utilization. Medium and heavy trucks began adopting 300-mile battery configurations that support regional freight corridors, lifting demand for ruggedized cells, megawatt-class charging couplers, and predictive-maintenance sensors. Passenger-car programs display maturity: compact and midsize models reach cost parity, while luxury crossovers spearhead 800 V adoption and silicon-carbide traction inverters. Across both segments, fleets influence procurement cycles, pushing volumes that allow component suppliers to reach scale faster than retail demand alone.
Overall, commercial electrification reshapes aftermarket requirements. Higher daily mileage intensifies wear on cooling plates, cabling, and contactors, expanding replacement parts revenue. Fleet operators demand telematics-enabled condition monitoring, encouraging suppliers to embed sensors that feed cloud analytics. The interdependency between operations data and hardware reliability drives collaboration among vehicle OEMs, telematics providers, and Tier-1s, reinforcing the market's shift toward service-led business models.
Battery electric programs continued to hold a 61.70% revenue share in 2025, underpinned by pack cost declines and a maturing charging network. Plug-in hybrids serve as transition technologies, but declining battery costs erode their value proposition. Fuel cell electric vehicles, although a minor slice in 2025, lead long-haul and heavy-duty pilots because hydrogen refueling aligns with existing freight stop schedules and payload requirements. Their 8.05% CAGR reflects infrastructure investments in corridor refueling hubs rather than broad passenger adoption.
Component implications differ sharply. BEVs prioritize energy-dense cells, fast-charge-capable connectors, and vehicle-to-grid-compatible power modules. FCEVs rely on carbon-fiber hydrogen tanks, platinum-based stacks, and high-temperature compressors. Suppliers across both chains diversify revenue but must manage separate quality regimes and homologation procedures. Policymakers advancing freight-center hydrogen nodes will determine whether FCEV volumes scale sufficiently to alter the component mix by decade-end.
The Electric Vehicle Parts and Components Market Report is Segmented by Vehicle Type (Passenger Cars and Commercial Vehicles), Propulsion Type (Battery Electric Vehicle and More), Component Type (Battery Packs and More), Voltage Platform (Up To 400V Systems, 800V Systems, and Above 800V Systems), and Geography. The Market Forecasts are Provided in Terms of Value (USD).
Geography Analysis
Asia-Pacific held 58.10% of global revenue in 2025, leveraging China's scale from 11.3 million domestic EV registrations that year. China's complete value chain-from lithium conversion and cathode production to motor assembly-creates cost advantages and shortens development loops. Japan specializes in high-precision motors and power electronics, while South Korea leads in NCM cell formulations and pouch technology. India's production-linked incentives catalyze local module factories and attract foreign cell makers, moving the region from final-assembly to deeper component integration across the decade.
The Middle East and Africa register the fastest 2026-to-2031 CAGR at 7.96%. Sovereign wealth projects in the United Arab Emirates and Saudi Arabia finance greenfield EV plants, battery enclosures, and silicon-carbide wafer fabs, leveraging solar resources to lower energy costs for electrolytic processes. South Africa capitalizes on platinum-group metals for fuel-cell stacks and manganese for LFP cathodes, embedding minerals deeper into domestic value chains. Grid upgrades and renewable expansion will dictate the pace at which component production scales regionally.
North America benefits from the Inflation Reduction Act, which ties tax credits to domestic content, GM channeling USD 35 billion into battery-cell and material plants. Localization reduces foreign-exchange risk and freight costs, but also demands new supplier bases for separators, current collectors, and cathode binders. Europe emphasizes recycling quotas and circular-economy directives; new gigafactory projects incorporate black-mass processing lines to capture cobalt and nickel for closed-loop cathodes. Environmental regulations elevate the role of life-cycle-analysis software and traceability modules within each component bill-of-materials.
- Contemporary Amperex Technology Co. Ltd (CATL)
- LG Energy Solution Ltd
- Panasonic Holdings Corp.
- BYD Co. Ltd
- Samsung SDI Co. Ltd
- Robert Bosch GmbH
- Denso Corporation
- Continental AG
- Hyundai Mobis Co. Ltd
- Toyota Industries Corporation
- BorgWarner Inc.
- Hitachi Astemo Ltd
- Nidec Corporation
- Magna International Inc.
- ZF Friedrichshafen AG
- Vitesco Technologies Group AG
- Aisin Corp.
- Valeo SA
- Infineon Technologies AG
- Aptiv PLC
Additional Benefits:
- The market estimate (ME) sheet in Excel format
- 3 months of analyst support
TABLE OF CONTENTS
1 Introduction
- 1.1 Study Assumptions and Market Definition
- 1.2 Scope of the Study
2 Research Methodology
3 Executive Summary
4 Market Landscape
- 4.1 Market Overview
- 4.2 Market Drivers
- 4.2.1 Declining Li-Ion Battery Costs and Gigafactory Output
- 4.2.2 Government Incentives and ZEV Mandates
- 4.2.3 OEM Shift to 800-V Architectures Elevating Power-Electronics Demand
- 4.2.4 Expansion of Public Fast-Charging Infrastructure
- 4.2.5 Silicon-Carbide Device Adoption Lifting Component ASPs
- 4.2.6 Rise of Software-Defined E-Powertrain Control Units
- 4.3 Market Restraints
- 4.3.1 Critical-Mineral Supply Bottlenecks
- 4.3.2 Inadequate Grid Capacity in Emerging Markets
- 4.3.3 Rare-Earth Magnet Price Volatility
- 4.3.4 OEM Vertical Integration Squeezing Tier-1 Revenue Pools
- 4.4 Value / Supply-Chain Analysis
- 4.5 Regulatory Landscape
- 4.6 Technological Outlook
- 4.7 Porter's Five Forces
- 4.7.1 Threat of New Entrants
- 4.7.2 Bargaining Power of Buyers/Consumers
- 4.7.3 Bargaining Power of Suppliers
- 4.7.4 Threat of Substitute Products
- 4.7.5 Intensity of Competitive Rivalry
5 Market Size and Growth Forecasts (Value, USD)
- 5.1 By Vehicle Type
- 5.1.1 Passenger Cars
- 5.1.1.1 Compact
- 5.1.1.2 SUV / Crossover
- 5.1.1.3 Luxury
- 5.1.2 Commercial Vehicles
- 5.1.2.1 Light Commercial Vehicles
- 5.1.2.2 Buses and Coaches
- 5.1.2.3 Medium and Heavy Trucks
- 5.1.1 Passenger Cars
- 5.2 By Propulsion Type
- 5.2.1 Battery Electric Vehicle
- 5.2.2 Plug-in Hybrid Electric Vehicle
- 5.2.3 Hybrid Electric Vehicle
- 5.2.4 Fuel Cell Electric Vehicle
- 5.3 By Component Type
- 5.3.1 Battery Packs
- 5.3.1.1 Battery Cells
- 5.3.1.2 Battery Management Systems
- 5.3.1.3 Battery Thermal Management Systems
- 5.3.2 Electric Motors
- 5.3.2.1 Permanent-Magnet Synchronous
- 5.3.2.2 Induction
- 5.3.2.3 Switched-Reluctance
- 5.3.3 Power Electronics
- 5.3.3.1 Inverters
- 5.3.3.2 DC-DC Converters
- 5.3.3.3 On-board Chargers
- 5.3.4 Thermal-Management Components
- 5.3.4.1 Heat Exchangers
- 5.3.4.2 Cooling Plates
- 5.3.5 Wiring, Harnesses and Connectors
- 5.3.6 Sensors and Control Units
- 5.3.1 Battery Packs
- 5.4 By Voltage Platform
- 5.4.1 Up to 400 V Systems
- 5.4.2 800-V Systems
- 5.4.3 Above 800-V Systems
- 5.5 By Geography
- 5.5.1 North America
- 5.5.1.1 United States
- 5.5.1.2 Canada
- 5.5.1.3 Rest of North America
- 5.5.2 South America
- 5.5.2.1 Brazil
- 5.5.2.2 Argentina
- 5.5.2.3 Rest of South America
- 5.5.3 Europe
- 5.5.3.1 Germany
- 5.5.3.2 United Kingdom
- 5.5.3.3 France
- 5.5.3.4 Italy
- 5.5.3.5 Spain
- 5.5.3.6 Russia
- 5.5.3.7 Rest of Europe
- 5.5.4 Asia-Pacific
- 5.5.4.1 China
- 5.5.4.2 India
- 5.5.4.3 Japan
- 5.5.4.4 South Korea
- 5.5.4.5 Australia
- 5.5.4.6 Rest of Asia-Pacific
- 5.5.5 Middle-East and Africa
- 5.5.5.1 United Arab Emirates
- 5.5.5.2 Saudi Arabia
- 5.5.5.3 Turkey
- 5.5.5.4 Egypt
- 5.5.5.5 South Africa
- 5.5.5.6 Rest of Middle-East and Africa
- 5.5.1 North America
6 Competitive Landscape
- 6.1 Market Concentration
- 6.2 Strategic Moves
- 6.3 Market Share Analysis
- 6.4 Company Profiles (Includes Global Level Overview, Market Level Overview, Core Segments, Financials as Available, Strategic Information, Market Rank/Share for Key Companies, Products & Services, and Recent Developments)
- 6.4.1 Contemporary Amperex Technology Co. Ltd (CATL)
- 6.4.2 LG Energy Solution Ltd
- 6.4.3 Panasonic Holdings Corp.
- 6.4.4 BYD Co. Ltd
- 6.4.5 Samsung SDI Co. Ltd
- 6.4.6 Robert Bosch GmbH
- 6.4.7 Denso Corporation
- 6.4.8 Continental AG
- 6.4.9 Hyundai Mobis Co. Ltd
- 6.4.10 Toyota Industries Corporation
- 6.4.11 BorgWarner Inc.
- 6.4.12 Hitachi Astemo Ltd
- 6.4.13 Nidec Corporation
- 6.4.14 Magna International Inc.
- 6.4.15 ZF Friedrichshafen AG
- 6.4.16 Vitesco Technologies Group AG
- 6.4.17 Aisin Corp.
- 6.4.18 Valeo SA
- 6.4.19 Infineon Technologies AG
- 6.4.20 Aptiv PLC
7 Market Opportunities & Future Outlook
 亚太地区汽车零件:市场占有率分析、产业趋势与统计、成长预测(2026-2031)汽车零件:市场占有率分析、产业趋势与统计、成长预测(2026-2031)
 2026年全球汽车零件送料器市场报告2026年全球翻斗车垫市场报告2026年全球镁合金汽车零件市场报告2026年全球电动车零件市场报告全球汽车零件维修服务市场报告(2026 年)
 汽车内装零件市场:2026年至2032年全球预测(按零件类别、材质、车辆类型和销售管道)汽车电动座椅组件市场按产品类型、车辆类型、座椅位置、技术、应用和分销管道划分,全球预测,2026-2032年2025年全球汽车循环包装市场报告