


 |
市场调查报告书
商品编码
1906282
POP展示架:市占率分析、产业趋势与统计、成长预测(2026-2031年)POP Display - Market Share Analysis, Industry Trends & Statistics, Growth Forecasts (2026 - 2031) |
||||||
※ 本网页内容可能与最新版本有所差异。详细情况请与我们联繫。
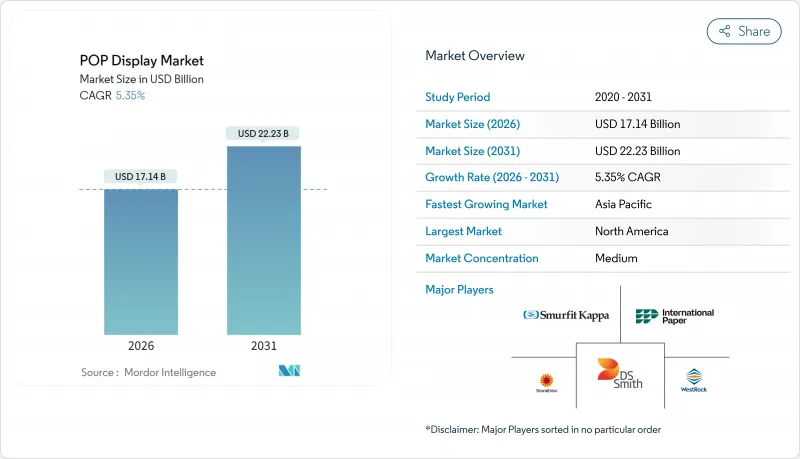
预计到 2026 年,POP 展示市场价值将达到 171.4 亿美元,高于 2025 年的 162.7 亿美元。
预计到 2031 年将达到 222.3 亿美元,2026 年至 2031 年的复合年增长率为 5.35%。
儘管电子商务蓬勃发展,但衝动性购买仍然在实体店中普遍存在,因此零售商持续增加对商店陈列的投入。落地展示架和瓦楞纸板解决方案仍然是商品展示方案的基础,这反映出零售商需要经济高效、可回收且能快速部署到全国门市网路的材料。零售媒体网路的日益普及推动了感测器和数位萤幕在实体展示中的集成,使品牌能够即时衡量顾客参与度并优化陈列图。同时,永续性法规和不断上涨的原材料成本正在加速向纤维基材料和闭合迴路供应链的转型。
全球POP展示市场趋势与洞察
新兴经济体中日常消费品和便利商店的快速扩张
7-Eleven 和 Lawson 等连锁店积极分店宣传活动,推动了当地对紧凑型产品展示架的需求,这些展示架能够在有限的空间内最大限度地提升销售效果。在印尼,小型商店占现代食品杂货交易量的 73%(高于 2013 年的 47%),这凸显了对适合有限占地面积的垂直模组化解决方案的需求。
零售商需要高转换率的店内接点
品牌所有者如今期望从每一平方英尺的销售空间中获得可衡量的收益。费列罗的「2025完美门市」计画正是这种转变的体现,该计画将展示与分析仪錶板结合,提供SKU等级的即时销售数据。这些数据丰富的系统使品类经理能够在促销期间调整商品陈列位置,而不是在促销结束后才进行调整。
电子商务和数位广告占据了实体店预算的大部分。
随着行销主管竞相追求可归因点击量,线上广告的兴起抑制了部分实体商品行销支出。研究表明,投资回报率的不确定性以及对干扰门市营运的担忧,正在减缓店内零售媒体的普及,并推迟预算回归实体店面。为了弥补这一缺口,零售商们正在尝试音讯广告和货架边缘萤幕,这些方式只需对占地面积进行最小程度的重新配置。
细分市场分析
到2025年,落地式展示架将占POP展示市场43.15%的份额,并以5.75%的复合年增长率持续增长,这印证了大型展示架是体验式销售区域的核心。柜檯式和端架式展示架旨在促进收银台附近或货架尽头的衝动性购买。托盘式展示架则适用于仓储式会员店和折扣零售商,支援越库作业,实现商品直接送达销售区域。据Look Company称,杂货店越来越多地采用试吃区和地面图形来鼓励顾客使用食谱主导购物车,从而推动了对结合纸板和屏幕的混合结构的需求。落地式展示架的规模允许嵌入感测器、QR码和NFC标籤,将实体触点与零售媒体网路连接起来。品牌支付的黄金地段租金为门市经营者提供了新的收入来源,进一步扩大了POP展示市场。端架式展示架的升级也遵循着类似的趋势,提供可根据一天中不同时间更换创新的动态LED顶灯,无需人工贴标籤即可提高SKU的轮换效率。
到2025年,瓦楞纸板将占POP展示市场35.05%的份额,而发泡板将继续以6.1%的复合年增长率成长。其光滑的表面有利于高解析度印刷,这对于化妆品和高科技设备至关重要。纤维材料的优点在于其轻盈、可回收和相对较低的单位成本。塑胶和金属是户外和潮湿地区长寿命货架展示架的必备材料,但不断上涨的原生聚合物课税加大了转向替代材料的压力。新兴的生物复合板将纤维素和农作物残渣混合,在较低的纸张重量下即可达到相同的抗压强度。零售商欢迎这些基材,因为它们可以简化EPR系统要求的报废产品回收审核。发泡板的崛起在高端护肤领域尤其明显,其结构、色彩还原度和边缘发光标识无需笨重的钢架即可提升货架展示效果。
POP展示架市场按产品类型(檯面展示架、落地展示架、端架展示架等)、材料(瓦楞纸、塑胶、金属等)、销售管道(百货公司、超级市场/大卖场等)、最终用户(食品饮料、化妆品及个人护理等)和地区进行细分。市场预测以以金额为准。
区域分析
至2025年,北美将维持24.25%的POP展示市占率。到2030年,零售媒体的普及和资本投资(例如WestRock位于威斯康辛州的「超级工厂」自动化设施)将推动市场成长,该设施将提升瓦楞纸板的生产能力并缩短前置作业时间。美国食品零售商正透过结合数位和光纤自助终端的程序化预订系统,加速端架库存的货币化。加拿大的延伸生产者责任制(EPR)立法正在推动对经认证的路边可回收展示架的需求。与此同时,墨西哥不断壮大的中产阶级正在推动与跨国供应链相关的便利商店连锁企业采用品牌运输容器。
预计亚太地区将达到最高成长率,到2031年复合年增长率将达到5.55%。便利商店连锁计画到2026年新增1万家门市。中国的智慧零售商正在门市实施人工智慧驱动的货架陈列优化,将产品轮换週期从数週缩短至数小时。印度的连锁零售商正在将购物中心扩展到区域城市,品牌商则利用双语图文和QR码食谱演示来推广产品知识。在东南亚的商店(许多面积不到200平方公尺),预先组装的轻薄可折迭展示架正逐渐成为主流,以降低运输成本。欧洲的POP展示市场正围绕着永续性。英国的塑胶税和德国的包装方法(VerpackG)正在推动循环材料的使用(参见gov.uk)。零售商要求供应商提供管理证书,并越来越多地使用FSC认证的纸板和水性油墨。法国的大型超市正在试行使用防冷凝纸质冷藏柜罩,并扩大冷藏区纺织材料的使用。数位化应用程式也不断成长,一家荷兰食品集团已将其配备电子货架的货架与行动应用程式连接,以便即时推送促销讯息。儘管面临通膨压力,化妆品和奢侈食品领域的高端策略仍能维持单价,并抵销价格敏感型品类销售成长放缓的影响。
其他福利:
- Excel格式的市场预测(ME)表
- 分析师支持(3个月)
目录
第一章 引言
- 研究假设和市场定义
- 调查范围
第二章调查方法
第三章执行摘要
第四章 市场情势
- 市场概览
- 市场驱动因素
- 日常消费品(FMCG)和便利商店在新兴国家的快速扩张
- 店内接点的需求促使零售商实现高转换率
- 永续纤维基纸板取代塑料
- 配备智慧感测器的POP用于即时分析
- 模组化显示器即服务 (DaaS) 租赁模式日益普及
- 利用3D列印技术实现超小批量客製化显示器
- 市场限制
- 电子商务和数位广告占据了商店预算的大部分。
- 箱板纸和树脂价格的波动给利润率带来了压力。
- 严格的掩埋和塑胶税法规
- 由于店面面积缩小,商品陈列密度降低
- 供应链分析
- 监管环境
- 技术展望
- 波特五力分析
- 供应商的议价能力
- 买方的议价能力
- 新进入者的威胁
- 替代品的威胁
- 竞争对手之间的竞争
- 对影响市场的宏观经济因素进行评估
第五章 市场规模与成长预测
- 依产品类型
- 柜檯展示
- 落地展示
- 端盖展示
- 托盘展示
- 其他的
- 材料
- 纸板
- 塑胶
- 金属
- 树
- 其他的
- 按销售管道
- 百货公司
- 超级市场和大卖场
- 专卖店
- 其他的
- 最终用户
- 食品/饮料
- 化妆品和个人护理
- 製药
- 电子设备/家用电器
- 其他的
- 按地区
- 北美洲
- 美国
- 加拿大
- 墨西哥
- 南美洲
- 巴西
- 阿根廷
- 其他南美洲
- 欧洲
- 德国
- 英国
- 法国
- 义大利
- 西班牙
- 其他欧洲地区
- 亚太地区
- 中国
- 日本
- 印度
- 韩国
- 东南亚
- 亚太其他地区
- 中东和非洲
- 中东
- 沙乌地阿拉伯
- 阿拉伯聯合大公国
- 土耳其
- 其他中东地区
- 非洲
- 南非
- 奈及利亚
- 埃及
- 其他非洲地区
- 中东
- 北美洲
第六章 竞争情势
- 市场集中度
- 策略趋势
- 市占率分析
- 公司简介
- DS Smith PLC
- WestRock Company
- Smurfit Kappa Group PLC
- International Paper Company
- Stora Enso Oyj
- Pratt Industries Inc.
- Sonoco Products Company
- Graphic Packaging International
- Georgia-Pacific LLC
- Menasha Packaging Company LLC
- Creative Displays Now!
- PPDandG
- Shenzhen WOW Display Co. Ltd.
- Mondi Group PLC
- Durabox Displays
- FFR Merchandising
- Parkway Display Products Ltd.
- Great Northern Corporation
- Hansen Display Group
- Repack Canada
第七章 市场机会与未来展望
The POP display market size in 2026 is estimated at USD 17.14 billion, growing from 2025 value of USD 16.27 billion with 2031 projections showing USD 22.23 billion, growing at 5.35% CAGR over 2026-2031.
Retailers continue to invest in on-shelf theatre because impulse purchases still originate in stores even as e-commerce grows. Floor displays and corrugated cardboard solutions remain the backbone of merchandising programs, reflecting retailers' need for cost-effective, recyclable materials that can be deployed quickly across national store networks. Heightened interest in retail media networks is driving the integration of sensors and digital screens into physical displays, allowing brands to measure engagement and optimize planograms in real time. At the same time, sustainability legislation and raw-material cost spikes are accelerating the shift toward fibre-based substrates and closed-loop supply chains.
Global POP Display Market Trends and Insights
Surging FMCG and Convenience-Store Roll-outs in Emerging Economies
Aggressive store-opening campaigns by chains such as 7-Eleven and Lawson are fuelling localised demand for compact merchandising fixtures that can generate maximum impact within tight footprints. Small-format stores already represent 73% of modern grocery trade in Indonesia, compared with 47% in 2013, underscoring the need for vertical, modular solutions that fit limited floor space.
Retailers' Demand for High-conversion In-store Touchpoints
Brand owners now expect every square foot of selling space to deliver measurable returns. Ferrero's 2025 Perfect Store programme illustrates this shift, with displays linked to analytics dashboards that reveal SKU-level performance in real time. Such data-rich installations allow category managers to tweak placement during a promotion cycle rather than after it.
E-commerce and Digital Ads Siphoning In-store Budgets
A tilt toward online advertising has curbed some physical merchandising spend as marketing chiefs chase attributable clicks. Research finds ROI uncertainty and store interference fears slowing adoption of in-store retail media, delaying budget migration back to fixtures. To compensate, retailers are piloting audio ads and shelf-edge screens that require minimal floor-space reconfiguration.
Other drivers and restraints analyzed in the detailed report include:
- Fibre-based Corrugated Replacing Plastics
- Smart Sensor-equipped POP for Real-time Analytics
- Volatile Linerboard and Resin Pricing Squeezes Margins
For complete list of drivers and restraints, kindly check the Table Of Contents.
Segment Analysis
Floor units held 43.15% share of the POP display market in 2025 and are expanding at 5.75% CAGR, confirming that large-format fixtures remain the anchor of experiential selling zones. Countertop and end-cap units target impulse moments near tills and aisle terminations. Pallet displays support warehouse clubs and discount retailers, enabling cross-docking straight to sales floors. The Look Company notes that grocers now fuse sampling stations with floor graphics to trigger recipe-led baskets, spurring demand for hybrid cardboard-and-screen constructions.Floor displays' scale allows embedded sensors, QR codes and NFC tags, linking physical touchpoints to retail-media networks. As brands pay tenancy fees for prime floor real estate, store operators derive new income streams, further scaling the POP display market. End-cap upgrades mirror that trend, offering dynamic LED headers that switch creatives by daypart, improving SKU rotation without manual relabeling.
Corrugated cardboard represented 35.05% of the POP display market size in 2025, but foam board is advancing at 6.1% CAGR because its smooth surface delivers high-definition print crucial for cosmetics and tech gadgets. Fibre dominance stems from its light weight, recyclability and comparatively low unit cost. Plastic and metal remain vital for long-life gondolas in outdoor or high-humidity zones, yet taxes on virgin polymer intensify substitution pressure. Emergent bio-composite boards mix cellulose with crop residue, promising similar crush resistance at lower grammage. Retailers welcome such substrates because they simplify end-of-life recycling audits mandated by EPR regimes. Foam board's rise is pronounced in premium skincare where structure, colour fidelity and edge-lit logos elevate shelf presence without heavy steel frames.
POP Display Market is Segmented by Product Type (Countertop Displays, Floor Displays, End-Cap Displays, and More), Material (Corrugated Cardboard, Plastic, Metal, and More), Sales Channel (Department Stores, Supermarkets and Hypermarkets, and More), End User (Food and Beverages, Cosmetics and Personal Care and More) and by Geography. The Market Forecasts are Provided in Terms of Value (USD).
Geography Analysis
North America retained 24.25% share of the POP display market in 2025. Growth through 2030 stems from retail-media rollouts and capital investments such as WestRock's automated Wisconsin "superplant," which enhances corrugated capacity and shortens lead times. US grocers increasingly monetise end-cap inventory through programmatic booking systems that bundle digital kiosks with fibre kiosks. Canada's EPR legislation spurs demand for displays certified for curbside recycling, while Mexico's rising middle class drives adoption of branded shippers in convenience chains linked to cross-border supply hubs.
Asia-Pacific will record the fastest CAGR at 5.55% through 2031 as convenience chains plan 10,000 additional outlets by 2026. Chinese smart retail operators retrofit stores with AI-driven planogram optimisation, compressing refresh cycles from weeks to hours. India's organised retail corridor adds malls in second-tier cities, where brands deploy bilingual graphics and QR-coded recipe demos to build category education. Southeast Asian formats, often under 200 sqm, rely on slim, fold-flat towers that ship in knock-down kits to minimise freight.Europe's POP display market dynamics revolve around sustainability. The UK's plastic-tax framework and Germany's VerpackG law incentivise closed-loop substrates gov.uk. Retailers demand chain-of-custody certification, propelling interest in FSC-certified corrugated and water-based inks. French hypermarkets trial paper-based cooler claddings that resist condensation, extending fibre usage into refrigerated aisles. Digital adoption is growing as well, with grocery groups in the Netherlands linking ESL-equipped gondolas to mobile apps for instant promotions. Despite inflationary headwinds, premium positioning across cosmetics and gourmet food sustains unit values, offsetting volume softness in price-sensitive categories.
- DS Smith PLC
- WestRock Company
- Smurfit Kappa Group PLC
- International Paper Company
- Stora Enso Oyj
- Pratt Industries Inc.
- Sonoco Products Company
- Graphic Packaging International
- Georgia-Pacific LLC
- Menasha Packaging Company LLC
- Creative Displays Now!
- PPDandG
- Shenzhen WOW Display Co. Ltd.
- Mondi Group PLC
- Durabox Displays
- FFR Merchandising
- Parkway Display Products Ltd.
- Great Northern Corporation
- Hansen Display Group
- Repack Canada
Additional Benefits:
- The market estimate (ME) sheet in Excel format
- 3 months of analyst support
TABLE OF CONTENTS
1 INTRODUCTION
- 1.1 Study Assumptions and Market Definition
- 1.2 Scope of the Study
2 RESEARCH METHODOLOGY
3 EXECUTIVE SUMMARY
4 MARKET LANDSCAPE
- 4.1 Market Overview
- 4.2 Market Drivers
- 4.2.1 Surging FMCG and C-store roll-outs in emerging economies
- 4.2.2 Retailers demand for high-conversion in-store touchpoints
- 4.2.3 Sustainable, fibre-based corrugated replacing plastics
- 4.2.4 Smart sensor-equipped POP for real-time analytics
- 4.2.5 Modular display-as-a-service rental models gain traction
- 4.2.6 3-D printing enabling ultra-short-run custom displays
- 4.3 Market Restraints
- 4.3.1 E-commerce and digital ads siphoning in-store budgets
- 4.3.2 Volatile linerboard and resin pricing squeezes margins
- 4.3.3 Strict landfill and plastics-tax regulations
- 4.3.4 Shrink-floor retail concepts lowering display density
- 4.4 Supply-Chain Analysis
- 4.5 Regulatory Landscape
- 4.6 Technological Outlook
- 4.7 Porter's Five Forces Analysis
- 4.7.1 Bargaining Power of Suppliers
- 4.7.2 Bargaining Power of Buyers
- 4.7.3 Threat of New Entrants
- 4.7.4 Threat of Substitutes
- 4.7.5 Intensity of Competitive Rivalry
- 4.8 Assesment of Macroeconomic Factors on the market
5 MARKET SIZE AND GROWTH FORECASTS (VALUE)
- 5.1 By Product Type
- 5.1.1 Countertop Displays
- 5.1.2 Floor Displays
- 5.1.3 End-cap Displays
- 5.1.4 Pallet Displays
- 5.1.5 Others
- 5.2 By Material
- 5.2.1 Corrugated Cardboard
- 5.2.2 Plastic
- 5.2.3 Metal
- 5.2.4 Wood
- 5.2.5 Others
- 5.3 By Sales Channel
- 5.3.1 Department Stores
- 5.3.2 Supermarkets and Hypermarkets
- 5.3.3 Specialty Stores
- 5.3.4 Others
- 5.4 By End User
- 5.4.1 Food and Beverages
- 5.4.2 Cosmetics and Personal Care
- 5.4.3 Pharmaceuticals
- 5.4.4 Electronics and Appliances
- 5.4.5 Others
- 5.5 By Geography
- 5.5.1 North America
- 5.5.1.1 United States
- 5.5.1.2 Canada
- 5.5.1.3 Mexico
- 5.5.2 South America
- 5.5.2.1 Brazil
- 5.5.2.2 Argentina
- 5.5.2.3 Rest of South America
- 5.5.3 Europe
- 5.5.3.1 Germany
- 5.5.3.2 United Kingdom
- 5.5.3.3 France
- 5.5.3.4 Italy
- 5.5.3.5 Spain
- 5.5.3.6 Rest of Europe
- 5.5.4 Asia-Pacific
- 5.5.4.1 China
- 5.5.4.2 Japan
- 5.5.4.3 India
- 5.5.4.4 South Korea
- 5.5.4.5 Southeast Asia
- 5.5.4.6 Rest of Asia-Pacific
- 5.5.5 Middle East and Africa
- 5.5.5.1 Middle East
- 5.5.5.1.1 Saudi Arabia
- 5.5.5.1.2 United Arab Emirates
- 5.5.5.1.3 Turkey
- 5.5.5.1.4 Rest of Middle East
- 5.5.5.2 Africa
- 5.5.5.2.1 South Africa
- 5.5.5.2.2 Nigeria
- 5.5.5.2.3 Egypt
- 5.5.5.2.5 Rest of Africa
- 5.5.5.1 Middle East
- 5.5.1 North America
6 COMPETITIVE LANDSCAPE
- 6.1 Market Concentration
- 6.2 Strategic Moves
- 6.3 Market Share Analysis
- 6.4 Company Profiles (includes Global level Overview, Market level overview, Core Segments, Financials as available, Strategic Information, Market Rank/Share for key companies, Products and Services, and Recent Developments)
- 6.4.1 DS Smith PLC
- 6.4.2 WestRock Company
- 6.4.3 Smurfit Kappa Group PLC
- 6.4.4 International Paper Company
- 6.4.5 Stora Enso Oyj
- 6.4.6 Pratt Industries Inc.
- 6.4.7 Sonoco Products Company
- 6.4.8 Graphic Packaging International
- 6.4.9 Georgia-Pacific LLC
- 6.4.10 Menasha Packaging Company LLC
- 6.4.11 Creative Displays Now!
- 6.4.12 PPDandG
- 6.4.13 Shenzhen WOW Display Co. Ltd.
- 6.4.14 Mondi Group PLC
- 6.4.15 Durabox Displays
- 6.4.16 FFR Merchandising
- 6.4.17 Parkway Display Products Ltd.
- 6.4.18 Great Northern Corporation
- 6.4.19 Hansen Display Group
- 6.4.20 Repack Canada
7 MARKET OPPORTUNITIES AND FUTURE OUTLOOK
- 7.1 White-space and Unmet-need Assessment


