


 |
市场调查报告书
商品编码
1906915
再生包装解决方案:市场占有率分析、产业趋势与统计、成长预测(2026-2031 年)Recycled Materials Packaging Solutions - Market Share Analysis, Industry Trends & Statistics, Growth Forecasts (2026 - 2031) |
||||||
※ 本网页内容可能与最新版本有所差异。详细情况请与我们联繫。
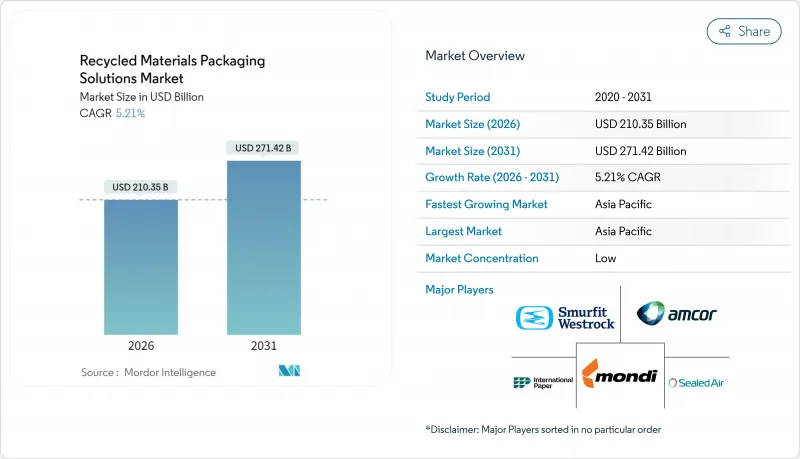
预计到 2026 年,再生材料包装解决方案市场规模将达到 2,103.5 亿美元,从 2025 年的 1999.3 亿美元成长到 2031 年的 2714.2 亿美元,2026 年至 2031 年的年复合成长率(CAGR)为 5.21%。
不断扩大的生产者延伸责任制 (EPR) 要求、品牌所有者对再生材料含量的目标以及对人工智慧 (AI) 分拣技术的投资,正在推动再生包装解决方案市场的持续成长。亚太地区凭藉着不断完善的法规和大规模的基础设施计划,已获得先发优势;而北美和欧洲则透过化学回收和垂直整合的原料采购来提升产能。消费者愿意为低碳包装支付溢价,这支撑着市场发展,并缩小了再生材料与原生材料之间的成本差距。同时,诸如基于解决方案的回收和单一材料软包装袋等供应侧创新,正在缩小再生材料解决方案与现有原生材料解决方案之间的性能差距。
全球再生包装解决方案市场趋势与洞察
扩大生产者延伸责任制(EPR)体系
生产者责任延伸制度(EPR)将废弃物处理成本从市政当局转移到生产商,使使用再生材料在经济上更具吸引力。越南2024年的法规要求硬质宝特瓶含有22%的再生材料和40%的材料回收率,鼓励了设备的快速升级。韩国正在将宝特瓶再生塑胶的含量从3%提高到10%,目标是到2030年达到30%。泰国的「无标定PET」倡议正在减少污染,并探索对再生树脂的税额扣抵抵免。欧盟的《包装和包装废弃物条例》规定,到2030年,食品包装中必须含有30%的再生PET。印度现在允许在食品包装中使用某些再生塑料,并要求可追溯性标籤标註。
品牌拥有者2025年再生材料含量目标
全球品牌正在自愿超越监管要求:雅诗兰黛的目标是到 2030 年使用至少 25% 的再生塑料 (PCR),并将原生塑料的使用量减半;玛氏公司已将其主要糖果甜点罐更换为 100% 再生树脂,每年减少 1300 吨原生塑料的使用;亿滋国际将使用 80% 可识别的可识别塑胶包装 33 可识别的国际化;亿条吉百利分享装巧克力;吉百利澳洲公司已为其牛奶巧克力棒采购了 1000 吨化学回收聚丙烯。
优质再生原料供应不稳定
再生PET和高密度聚苯乙烯的价格波动很大,为加工商的预算带来了挑战。饮料品牌最近发现,食品级再生PET(rPET)的交货週期长达六到八週,而原生塑胶替代品只需三週即可到货。由于受到污染,15%到25%的回收塑胶未能通过食品级检测,导致一些品牌无法达到其再生塑胶含量承诺。这种价格波动对于阻隔材料而言特别显着,因为这类材料需要特殊等级的再生PET。
细分市场分析
截至2025年,纸张将占再生包装解决方案市场44.25%的份额,这反映出北美地区纤维回收系统的成熟以及纸板回收率超过90%。预计到2031年,塑胶将以6.03%的复合年增长率成长,这主要得益于化学回收提高了食品级塑胶的品质以及新应用领域的开发。玻璃在高端饮料和化妆品领域的需求仍然旺盛,这些领域的品牌价值强调丰富的触感。金属具有无限的可再生,吸引了闭合迴路买家,并在气雾剂、饮料和化妆品包装领域巩固了其地位,儘管目前市场份额不大。
儘管在全球电子商务的推动下,纸张市场持续稳定成长,但塑胶市场也蕴藏着巨大的未来成长潜力。超过80亿美元的投资正在加速化学回收利用,以填补食品级再生PET(rPET)的短缺。例如,伊士曼公司的Gemini Compact等产品,利用分子回收树脂,推动了塑胶在化妆品领域的应用。因此,预计再生包装解决方案市场将逐渐实现纸本和塑胶解决方案之间的材料组合整合。
到2025年,食品应用将占总需求的36.20%,但监管安全标准限制了其成长。印度最近批准在食品包装中使用某些可回收塑料,并要求严格的可追溯性,这在一定程度上缓解了障碍。百事可乐等饮料品牌已推出由50%再生聚丙烯製成的零食包装,显示在性能可接受的领域,再生塑胶的应用正在增加。
由于消费者越来越重视低碳产品,家居及个人护理用品市场预计将以6.58%的复合年增长率成长。波尔公司对Meadow的投资以及推出的可完全回收的铝製肥皂和洗髮精包装盒表明,各大品牌已准备好快速更换包装材料。随着回收网路的日趋成熟,电子商务和工业包装等二次产业也开始更多地采用消费后回收材料,从而扩大了再生包装解决方案的市场。
区域分析
预计到2025年,亚太地区将占全球再生包装解决方案市场规模的45.80%,复合年增长率达7.55%。越南的生产者责任延伸制度(EPR)目标、韩国的再生材料含量标准以及泰国的税收优惠等监管政策的明朗化,正在促进投资流入。东南亚国协的基础设施资金筹措正在消除回收瓶颈,并弥合长期以来阻碍供应安全的历史遗留问题。
在北美,自2017年以来宣布的80亿美元回收扩建计画将每年新增约900万吨废弃物能力。奥勒冈州和科罗拉多的「生产者延伸责任制」(EPR)将于2025年7月生效,该制度将明确生产者收费标准,并鼓励产品设计以方便回收。企业采购承诺带来的稳定回收需求支撑了强劲的投资前景。欧洲保持其监管领域的主导地位。到2030年,PET食品包装中再生材料含量必须达到30%的强制性要求以及「可回收设计」(Design for Recycle)标准将促进创新。诸如4evergreen和FINAT等合作平台正在分别制定纸张和标籤衬纸回收的技术指南。南美洲以及中东和非洲的温和成长反映了再生包装解决方案市场的逐步扩张,这得益于津贴计画的扩展和已建立的EPR框架。
其他福利:
- Excel格式的市场预测(ME)表
- 3个月的分析师支持
目录
第一章 引言
- 研究假设和市场定义
- 调查范围
第二章调查方法
第三章执行摘要
第四章 市场情势
- 市场概览
- 市场驱动因素
- 扩大强制性生产者延伸责任制(EPR)体系
- 品牌拥有者2025年再生材料目标
- 先进的分选技术:减少污染物
- 消费者偏好低碳包装
- 企业净零排放目标加速PCR采购
- 化学品回收产能的投资激增
- 市场限制
- 优质再生原料供应波动
- 来自替代纺织包装材料的竞争性需求
- 由于原生树脂价格下跌,经济状况恶化
- 新兴市场缺乏回收基础设施
- 产业价值链分析
- 监管环境
- 技术展望
- 波特五力分析
- 供应商的议价能力
- 买方的议价能力
- 新进入者的威胁
- 替代品的威胁
- 竞争对手之间的竞争
- 宏观经济因素如何影响市场
第五章 市场规模与成长预测
- 依材料类型
- 塑胶
- 纸
- 玻璃
- 金属
- 按最终用户行业划分
- 食物
- 饮料
- 居家及个人护理
- 卫生保健
- 其他终端用户产业
- 按包装类型
- 硬包装
- 软包装
- 按来源分类的回收材料
- 消费后回收材料(PCR)
- 工业后回收材料(PIR)
- 海洋废弃物和回收废弃物
- 按地区
- 北美洲
- 美国
- 加拿大
- 墨西哥
- 南美洲
- 巴西
- 阿根廷
- 其他南美洲
- 欧洲
- 德国
- 法国
- 英国
- 义大利
- 西班牙
- 其他欧洲地区
- 亚太地区
- 中国
- 日本
- 印度
- 韩国
- 东南亚国协
- 澳洲和纽西兰
- 亚太其他地区
- 中东和非洲
- 中东
- 沙乌地阿拉伯
- 阿拉伯聯合大公国
- 土耳其
- 其他中东地区
- 非洲
- 南非
- 奈及利亚
- 埃及
- 其他非洲地区
- 中东
- 北美洲
第六章 竞争情势
- 市场集中度
- 策略趋势
- 市占率分析
- 公司简介
- Amcor plc
- Kruger Inc.
- Smurfit WestRock plc
- Packaging Corporation of America
- Tetra Laval International SA
- International Paper Company
- Mondi plc
- Verallia SA
- Sealed Air Corporation
- Ardagh Group
- Plastipak Holdings, Inc.
- Billerud AB
- Stora Enso Oyj
- UPM-Kymmene Corporation
- Huhtamaki Oyj
- Graphic Packaging Holding Company
- Veolia Environnement SA
- Eco-Products, Inc.
- Loop Industries, Inc.
- Sonoco Products Company
第七章 市场机会与未来展望
The recycled materials packaging solutions market size in 2026 is estimated at USD 210.35 billion, growing from 2025 value of USD 199.93 billion with 2031 projections showing USD 271.42 billion, growing at 5.21% CAGR over 2026-2031.
Rising Extended Producer Responsibility mandates, brand-owner recycled-content targets, and investments in artificial-intelligence sortation are collectively positioning the recycled materials packaging solutions market for sustained growth. Asia-Pacific secures early-mover advantages through evolving regulations and large-scale infrastructure projects, while North America and Europe build capacity through chemical recycling and vertically integrated feedstock procurement. Demand is reinforced by consumers willing to pay premiums for low-carbon packaging, which smooths cost differentials between recycled and virgin materials. At the same time, supply-side innovations such as dissolution-based recycling and mono-material flexible pouches are narrowing performance gaps against incumbent virgin solutions.
Global Recycled Materials Packaging Solutions Market Trends and Insights
Extended Producer Responsibility (EPR) Mandates Expansion
EPR statutes shift end-of-life costs from municipalities to producers, making recycled content economically attractive. Vietnam's 2024 rules require 22% recycling for rigid PET and 40% material recovery rates, sparking rapid equipment upgrades. South Korea is boosting the required recycled plastic in PET bottles from 3% to 10% and targets 30% by 2030. Thailand's label-free PET initiative trims contamination and considers tax credits for recycled resin. The EU Packaging and Packaging Waste Regulation mandates 30% recycled PET in food packaging by 2030. India now allows specified recycled plastics in food packaging, requiring traceability labelling.
Brand-Owner 2025 Recycled-Content Targets
Global brands are voluntarily outpacing regulation. Estee Lauder seeks at least 25% PCR and to halve virgin plastic by 2030. Mars moved key confectionery jars to 100% recycled resin, cutting 1,300 tonnes of virgin plastic each year. Mondelez will package 300 million Cadbury sharing bars in 80% attributable recycled plastic. Cadbury Australia sourced 1,000 tonnes of chemically recycled polypropylene for Dairy Milk bars.
Volatile Supply of High-Quality Recycled Feedstock
Pricing for recycled PET and high-density polyethylene swings widely, imposing budgeting challenges for converters. Beverage brands recently queued 6-8 weeks for food-grade rPET while virgin alternatives were available in 3 weeks. Contamination means 15-25% of collected plastics fail food-grade tests, forcing some brands to under-fulfill recycled-content pledges. The volatility is most acute for barrier materials that demand specialty grades.
Other drivers and restraints analyzed in the detailed report include:
- Advanced Sortation Technologies: Reducing Contamination
- Consumer Preference for Low-Carbon Packaging
- Competing Demand from Fiber-Based Substitute Packaging
For complete list of drivers and restraints, kindly check the Table Of Contents.
Segment Analysis
In 2025, paper commanded 44.25% of the recycled materials packaging solutions market share, reflecting mature fiber collection systems and corrugated recovery rates above 90% in North America. Plastic is projected to post a 6.03% CAGR through 2031 as chemical recycling improves food-grade quality and unlocks new applications. Glass continues serving premium beverage and cosmetic niches where brand equity values tactile heft. Metal offers infinite recyclability that attracts closed-loop purchasers, buttressing its role in aerosol, beverage, and cosmetics packaging even when volumes remain modest.
Paper maintains steady growth due to global e-commerce, but plastics claim future upside. Investment topping USD 8 billion accelerates chemical recycling to offset the shortfall in food-grade rPET. Examples such as Eastman's Gemini compact underscore plastics' progress into cosmetics using molecularly recycled resins. Consequently, the recycled materials packaging solutions market expects a gradual convergence in the material mix between paper and plastic solutions.
Food applications generated 36.20% of 2025 demand, but regulatory safety thresholds constrain growth. India's new allowance of specific recycled plastics in food packaging under strict traceability slightly relaxes barriers. Beverage brands such as PepsiCo demonstrate 50% recycled polypropylene snack packs, hinting at broader adoption where performance permits.
Home and personal care is set to rise at a 6.58% CAGR, as consumers accept premiums for low-carbon formats. Ball Corporation financed Meadow to launch fully recyclable aluminum cartridges for soaps and shampoos, showing brand readiness to switch materials swiftly. Secondary industries such as e-commerce and industrial packaging also incorporate more PCR as collection networks mature, broadening the recycled materials packaging solutions market.
The Recycled Materials Packaging Solutions Market Report is Segmented by Material Type (Plastic, Paper, Glass, and Metal), End-User Industry (Food, Beverage, Home and Personal Care, Healthcare, and More), Packaging Type (Rigid Packaging, and Flexible Packaging), Source of Recycled Material (Post-Consumer Recyclate, Post-Industrial Recyclate, and More), and Geography. The Market Forecasts are Provided in Terms of Value (USD).
Geography Analysis
Asia-Pacific held 45.80% of the recycled materials packaging solutions market size in 2025 and will grow at a 7.55% CAGR. Regulatory clarity, such as Vietnam's EPR targets, South Korea's recycled-content thresholds, and Thailand's tax incentives, is reinforcing investment flows. Infrastructure financing across ASEAN nations addresses collection bottlenecks, closing gaps that historically impeded supply consistency.
North America benefits from USD 8 billion in announced recycling expansions since 2017, adding capacity to process almost 9 million tonnes of waste annually. Extended Producer Responsibility laws in Oregon and Colorado that take effect in July 2025 clarify producer fees and spur redesign toward recyclability. Corporate procurement commitments secure offtake, supporting a stable investment outlook. Europe sustains regulatory leadership. Mandatory 30% recycled PET for food packaging by 2030 and design-for-recycling criteria foster innovation pipelines. Collaborative platforms such as 4evergreen and FINAT develop technical guidance for paper and label liner recycling, respectively. Moderate growth in South America and the Middle East & Africa reflects emerging grant funding and nascent EPR frameworks that gradually enlarge the recycled materials packaging solutions market.
- Amcor plc
- Kruger Inc.
- Smurfit WestRock plc
- Packaging Corporation of America
- Tetra Laval International S.A.
- International Paper Company
- Mondi plc
- Verallia SA
- Sealed Air Corporation
- Ardagh Group
- Plastipak Holdings, Inc.
- Billerud AB
- Stora Enso Oyj
- UPM-Kymmene Corporation
- Huhtamaki Oyj
- Graphic Packaging Holding Company
- Veolia Environnement S.A.
- Eco-Products, Inc.
- Loop Industries, Inc.
- Sonoco Products Company
Additional Benefits:
- The market estimate (ME) sheet in Excel format
- 3 months of analyst support
TABLE OF CONTENTS
1 INTRODUCTION
- 1.1 Study Assumptions and Market Definition
- 1.2 Scope of the Study
2 RESEARCH METHODOLOGY
3 EXECUTIVE SUMMARY
4 MARKET LANDSCAPE
- 4.1 Market Overview
- 4.2 Market Drivers
- 4.2.1 Extended Producer Responsibility (EPR) Mandates Expansion
- 4.2.2 Brand-Owner 2025 Recycled-Content Targets
- 4.2.3 Advanced Sortation Technologies: Reducing Contamination
- 4.2.4 Consumer Preference for Low-Carbon Packaging
- 4.2.5 Corporate Net-Zero Commitments Accelerating PCR Procurement
- 4.2.6 Surging Investment in Chemical Recycling Capacity
- 4.3 Market Restraints
- 4.3.1 Volatile Supply of High-Quality Recycled Feedstock
- 4.3.2 Competing Demand from Fiber-Based Substitute Packaging
- 4.3.3 Unfavorable Economics when Virgin Resin Prices Decline
- 4.3.4 Recycling Infrastructure Gaps in Emerging Markets
- 4.4 Industry Value Chain Analysis
- 4.5 Regulatory Landscape
- 4.6 Technological Outlook
- 4.7 Porter's Five Forces Analysis
- 4.7.1 Bargaining Power of Suppliers
- 4.7.2 Bargaining Power of Buyers
- 4.7.3 Threat of New Entrants
- 4.7.4 Threat of Substitutes
- 4.7.5 Intensity of Competitive Rivalry
- 4.8 Impact of Macroeconomic Factors on the Market
5 MARKET SIZE AND GROWTH FORECASTS (VALUE)
- 5.1 By Material Type
- 5.1.1 Plastic
- 5.1.2 Paper
- 5.1.3 Glass
- 5.1.4 Metal
- 5.2 By End-User Industry
- 5.2.1 Food
- 5.2.2 Beverage
- 5.2.3 Home and Personal Care
- 5.2.4 Healthcare
- 5.2.5 Other End-user Industries
- 5.3 By Packaging Type
- 5.3.1 Rigid Packaging
- 5.3.2 Flexible Packaging
- 5.4 By Source of Recycled Material
- 5.4.1 Post-consumer Recyclate (PCR)
- 5.4.2 Post-industrial Recyclate (PIR)
- 5.4.3 Ocean-bound and Recovered Waste
- 5.5 By Geography
- 5.5.1 North America
- 5.5.1.1 United States
- 5.5.1.2 Canada
- 5.5.1.3 Mexico
- 5.5.2 South America
- 5.5.2.1 Brazil
- 5.5.2.2 Argentina
- 5.5.2.3 Rest of South America
- 5.5.3 Europe
- 5.5.3.1 Germany
- 5.5.3.2 France
- 5.5.3.3 United Kingdom
- 5.5.3.4 Italy
- 5.5.3.5 Spain
- 5.5.3.6 Rest of Europe
- 5.5.4 Asia-Pacific
- 5.5.4.1 China
- 5.5.4.2 Japan
- 5.5.4.3 India
- 5.5.4.4 South Korea
- 5.5.4.5 ASEAN Countries
- 5.5.4.6 Australia and New Zealand
- 5.5.4.7 Rest of Asia-Pacific
- 5.5.5 Middle East and Africa
- 5.5.5.1 Middle East
- 5.5.5.1.1 Saudi Arabia
- 5.5.5.1.2 United Arab Emirates
- 5.5.5.1.3 Turkey
- 5.5.5.1.4 Rest of Middle East
- 5.5.5.2 Africa
- 5.5.5.2.1 South Africa
- 5.5.5.2.2 Nigeria
- 5.5.5.2.3 Egypt
- 5.5.5.2.4 Rest of Africa
- 5.5.5.1 Middle East
- 5.5.1 North America
6 COMPETITIVE LANDSCAPE
- 6.1 Market Concentration
- 6.2 Strategic Moves
- 6.3 Market Share Analysis
- 6.4 Company Profiles (includes Global level Overview, Market level overview, Core Segments, Financials as available, Strategic Information, Market Rank/Share for key companies, Products and Services, and Recent Developments)
- 6.4.1 Amcor plc
- 6.4.2 Kruger Inc.
- 6.4.3 Smurfit WestRock plc
- 6.4.4 Packaging Corporation of America
- 6.4.5 Tetra Laval International S.A.
- 6.4.6 International Paper Company
- 6.4.7 Mondi plc
- 6.4.8 Verallia SA
- 6.4.9 Sealed Air Corporation
- 6.4.10 Ardagh Group
- 6.4.11 Plastipak Holdings, Inc.
- 6.4.12 Billerud AB
- 6.4.13 Stora Enso Oyj
- 6.4.14 UPM-Kymmene Corporation
- 6.4.15 Huhtamaki Oyj
- 6.4.16 Graphic Packaging Holding Company
- 6.4.17 Veolia Environnement S.A.
- 6.4.18 Eco-Products, Inc.
- 6.4.19 Loop Industries, Inc.
- 6.4.20 Sonoco Products Company
7 MARKET OPPORTUNITIES AND FUTURE OUTLOOK
- 7.1 White-space and Unmet-need Assessment
 黏性毛毡垫市场:2026-2032年全球市场预测(按应用、产品类型、材料、最终用途、销售管道和厚度划分)键合线封装材料市场:依材料、封装类型、线径及最终用途产业划分-2026-2032年全球市场预测
 绿色建筑材料中再生塑胶的市场分析与预测(至2035年):按类型、产品、应用、技术、材料类型、最终用户、製程、安装类型和解决方案划分
 全球阻挡垫和防滑垫市场规模、份额、趋势和成长分析报告(2026-2034)
 2026年全球再生塑胶屋顶瓦市场报告全球老年家具市场(按产品类型、分销管道、材料和设计划分)预测(2026-2032)生命科学低温运输包装解决方案市场(按材料、温度范围、包装类型、冷媒、运输方式和最终用途划分),全球预测(2026-2032年)
 印刷基板(PCB) 和先进封装化学品市场预测至 2032 年:按化学品类型、封装类型、製程、技术、最终用户和地区分類的全球分析
 再生材料包装解决方案市场规模、份额和成长分析(按材料类型、产品类型、最终用户产业和地区划分)-2026-2033年产业预测2032年再生包装材料市场预测:按材料类型、包装类型、分销管道、最终用户和地区分類的全球分析