


 |
市场调查报告书
商品编码
1906947
北美资料中心电力市场:份额分析、产业趋势、统计数据和成长预测(2026-2031 年)North America Data Center Power - Market Share Analysis, Industry Trends & Statistics, Growth Forecasts (2026 - 2031) |
||||||
※ 本网页内容可能与最新版本有所差异。详细情况请与我们联繫。
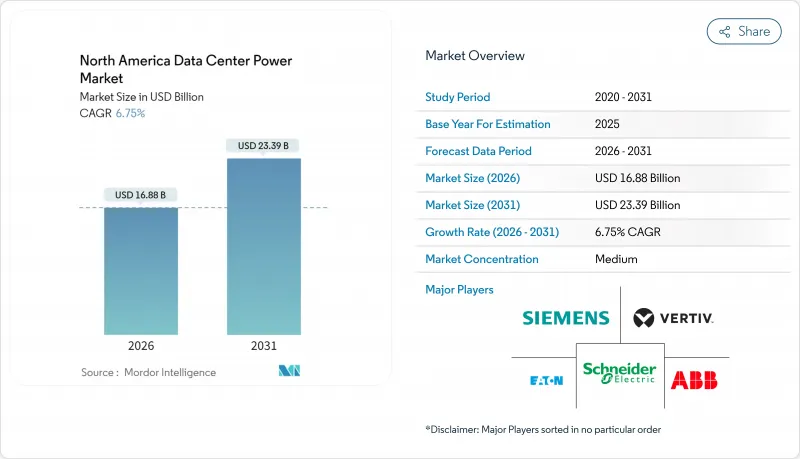
预计到 2026 年,北美资料中心电力市场规模将达到 168.8 亿美元,高于 2025 年的 158.1 亿美元,预计到 2031 年将达到 233.9 亿美元,2026 年至 2031 年的复合年增长率为 6.75%。
强劲的成长主要得益于以人工智慧为中心的工作负载,这些工作负载正将机架密度从 5-15kW 推高至 40-140kW,迫使营运商对其电力架构进行现代化改造。超大规模园区正在建造千兆瓦级变电站以满足需求,而边缘运算则正在部署需要独立 UPS 和发电机组的微型站点。严格的能源效率法规,例如 PUE阈值,正在加速液冷技术和电池储能 (BESS) 的普及应用。在德克萨斯州、魁北克省和亚伯达省签署的可再生能源购电协议 (PPA) 正在帮助企业实现其永续性目标,同时对冲电价波动风险。主要都会区日益增长的电网容量限制正在推动企业向美国次市场市场、水力资源丰富的加拿大省份以及墨西哥新兴的託管地点扩张。
北美资料中心电力市场趋势与洞察
超大规模和超级资料中心的日益普及
超大规模营运商目前正规划兴建多栋建筑组成的园区,这些园区由现场变电站提供数百兆瓦的电力,并部署需要持续、高品质电力供应的液冷GPU机架。 Meta公司斥资650亿美元,目标是将其北美所有园区的PUE值控制在1.1以下,这表明电力设计已成为永续性的基石。例如,位于亚伯达的Wonder Valley Park计划,将天然气燃气涡轮机与地热循环相结合,创造了1.4吉瓦的专用容量,凸显了在电网延迟超过四年的情况下,向自发电模式的转变。园区围绕着廉价可再生能源的聚集造成了区域负载集中,迫使电力公司透过更早的电网升级来应对这些负载。提供工厂整合开关设备、母线槽和储能模组的供应商,透过缩短电气化流程和减少现场工作,正在赢得市场份额。不断增长的投资也推动了软体定义电力监控系统的应用,这些系统可以优化负载配置并实现发电机排序,从而防止电网闪烁。
云端运算与OTT流量的爆炸性成长
协作工具、串流媒体和生成式人工智慧推理的快速发展正迫使通讯业者和云端服务供应商将运算资源部署到更靠近终端用户的位置。功率范围从 250kW 到 1MW 的边缘节点正安装在零售商场、通讯枢纽和市政候车亭中,每个节点都配备了锂离子不间断电源 (UPS)、小型发电机和远端系统管理韧体。由于电力线路电压稳定性差异很大且断电频率高,分散式站点的容量规划变得更加复杂。营运商正在利用双馈自动换接开关和基于云端的 SCADA 控制面板来降低风险,这些控制面板可以汇总数百个微型设施的警报资讯。加速的内容传送也需要更高的突发功率来应对转码器转换期间的功率突波,这推动了基于毫秒切换的静态开关 UPS 拓扑结构的应用。数千个边缘站点的累积效应增加了全部区域负荷,同时每个站点都必须遵守各州能源法规,这些法规对允许的 PUE阈值要求更加严格。
维修电力和冷却设备需要较高的初始资本投入。
许多现有资料中心的设计机架功率为 5-15kW,若要满足 40-140kW 的人工智慧负载,则需要进行大规模维修。电气室通常需要增加变压器、重新布线母线槽,以及将风冷式精密空调机组更换为液冷式冷却器,这些计划专案成本高于运作中新建设的基准值。营运商被迫分阶段进行建设以适应持续的工作负载,从而延长工期并增加风险。小规模的供应商在没有客户或政府主要奖励的情况下,难以资金筹措进行大规模的电气升级。即使资金到位,24kV 开关设备和 3MVA UPS 机架的供应链前置作业时间也可能超过 60 週。这种即时的现金支出阻碍了人工智慧优化电源解决方案在短期内进入市场。
细分市场分析
配电解决方案(开关设备、配电单元、母线槽)是任何设施的电气基础,预计到2025年将占总收入的44.40%。然而,随着业主对设计、整合和预测性维护的专业知识需求增加,服务业务正以6.98%的复合年增长率快速成长。咨询服务在施工开始前数月就已启动,涵盖谐波分析、短路研究和储能投资报酬率建模。整合专家负责在多相建设专案中建立「单线图」的完整性,以避免閒置容量。支援团队将边缘分析技术嵌入到UPS模组中,产生数据,并在服务等级协定(SLA)失效前自动产生工单。这些附加价值服务提高了客户留存率,并将硬体供应商转变为长期合作伙伴。
供应商将韧体升级捆绑销售,以实现更高级的正常运作计算,从而延长电池寿命并缩短更换週期。在劳动力严重短缺的地区,远端维护合约可提供红外线扫描、断路器操作和过热保护等服务。北美资料中心电力市场受益于服务奖励模式,该模式能够平滑大型企划週期之间的收入波动,激励企业在当地维持大规模的员工队伍,并确保为超大规模客户提供快速回应。
到2025年,超大规模资料中心园区将占据47.55%的市场份额,这反映了其庞大的规模和标准化的电源模组。然而,随着人工智慧推理将运算任务转移到消费者端,边缘资料中心和微型资料中心将以6.92%的复合年增长率实现最快的成长。为了最大限度地减少面积,这些小型资料中心采用208/415V的配电系统和高效的线上互动式UPS,而不是超大规模资料中心常用的13.8kV馈线和双转换UPS。因此,北美资料中心电力市场的规模正在向边缘端扩展,不仅体现在兆瓦级,也体现在单元级。
同时,企业设施正在采用混合模式,扩展电力容量以支援私有云端丛集,同时将对延迟敏感的任务卸载到附近的边缘节点。营运商正在采用模组化电池柜,可以以 100kW 为增量进行扩展,以适应 IT 的逐步扩展。超大规模资料中心建造者正在将直接可再生能源供电与短时飞轮式 UPS 结合,以降低营运成本。融合的设计理念使供应商能够提供共用韧体和监控 API 的开关设备和 UPS“系列”,从而降低不同类型设施的整合成本。
其他福利:
- Excel格式的市场预测(ME)表
- 分析师支持(3个月)
目录
第一章 引言
- 研究假设和市场定义
- 调查范围
第二章调查方法
第三章执行摘要
第四章 市场情势
- 市场概览
- 市场驱动因素
- 超大规模和超级资料中心的日益普及
- 云端运算和OTT流量爆炸
- 严格的PUE/能源效率法规
- 由于银行、金融和保险 (BFSI) 以及医疗保健行业的数位化,对託管服务的需求不断增长。
- 公用事业规模的可再生能源购电协议有助于稳定电力成本。
- 在区域和郊区丛集中部署边缘人工智慧微型资料中心
- 市场限制
- 维修电力和冷却设备需要较高的初始资本投资成本。
- 主要大都会地区的输电能力瓶颈
- 持证高压技术员短缺
- 深入了解水冷散热的隐性功耗损失
- 价值/供应链分析
- 监管环境
- 技术展望
- 波特五力模型
- 供应商的议价能力
- 买方的议价能力
- 新进入者的威胁
- 替代品的威胁
- 竞争对手之间的竞争
- 地缘政治对华盛顿特区基础设施的影响
- 产业生态系分析
5. 北美资料中心安装分析
- 北美资料中心现况分析(基于IT负载能力和资料中心数量)
- 北美射线热点分析(该地区前 15 个热点)
- 北美资料中心基础设施总支出分析
第六章 市场规模与成长预测
- 按类型
- 按解决方案类型
- 配电解决方案
- 传输开关
- 开关设备
- 配电盘和组件
- 其他的
- 备用电源解决方案
- UPS
- 发电机
- 配电解决方案
- 服务:设计与咨询、系统整合、支援与维护
- 按解决方案类型
- 依资料中心类型
- 託管设施
- 企业/边缘设施
- 超大规模/自建设施
- 按最终用户行业划分
- BFSI
- 资讯科技和电信
- 政府/国防
- 製造业和工业部门
- 媒体与娱乐
- 医疗保健和生命科学
- 零售与电子商务
- 按功率容量
- 500千瓦或以下
- 501kW~1MW
- 1.1~3 MW
- 超过3兆瓦
- 按层级标准
- 一级和二级
- Tier III
- Tier IV
- 按国家/地区
- 美国
- 加拿大
- 墨西哥
第七章 竞争情势
- 市占率分析
- 公司简介
- ABB Ltd
- Schneider Electric
- Vertiv Group Corp.
- Eaton Corp.(incl. Tripp Lite)
- Legrand(Raritan, Starline)
- nVent(Enlogic)
- Siemens AG
- Cummins Inc.
- Caterpillar Inc.
- Generac Power Systems
- Mitsubishi Electric
- Delta Electronics
- Huawei Technologies Co. Ltd.
- Piller Power Systems
- Kohler Co.
- LayerZero Power Systems
- Socomec Group
- Panduit Corp.
- Riello UPS
- Power Innovations International
- Starline(Legrand)
- Powin Energy
- Bloom Energy
第八章:市场机会与未来展望
- 閒置频段与未满足需求评估
The North America data center power market size in 2026 is estimated at USD 16.88 billion, growing from 2025 value of USD 15.81 billion with 2031 projections showing USD 23.39 billion, growing at 6.75% CAGR over 2026-2031.
Solid growth is tied to AI-centric workloads that push rack densities from 5-15 kW to 40-140 kW, forcing operators to modernize electrical architectures. Hyperscale campuses anchor demand as they build gigawatt-scale substations, while edge computing rolls out micro sites that need autonomous UPS and generator sets. Stricter efficiency regulations such as PUE thresholds are accelerating liquid-cooling adoption and battery-energy-storage integration. Renewable power purchase agreements (PPAs) signed in Texas, Quebec, and Alberta have become a hedge against volatile utility tariffs while meeting corporate sustainability goals. Heightened grid-capacity constraints in tier-1 metros now shift expansion toward secondary U.S. markets, hydro-rich Canadian provinces, and Mexico's emerging colocation hubs.
North America Data Center Power Market Trends and Insights
Rising Adoption of Hyperscale and Mega Data Centers
Hyperscale operators now plan multi-building campuses that draw hundreds of megawatts from on-site substations and deploy liquid-cooled GPU racks requiring continuous, high-quality power. Meta's USD 65 billion program targets sub-1.1 PUE across North American sites, underscoring how power design has become a cornerstone of sustainability commitments.Projects such as Alberta's Wonder Valley park pair natural-gas turbines with geothermal loops to create 1.4 GW of dedicated capacity, illustrating a shift toward self-generation when grid queues exceed four years. The clustering of campuses around cheap renewable resources generates regional load pockets that utilities must accommodate through accelerated transmission upgrades. Vendors that deliver factory-integrated switchgear, busways, and energy-storage modules win share by shortening electrification timelines and reducing site labor. The scale of investment also drives adoption of software-defined power monitoring that optimizes load placement and sequence-starts generators to prevent grid flicker.
Surge in Cloud Computing and OTT Traffic
Rapid growth in collaboration tools, streaming media, and generative AI inference pushes carriers and cloud providers to place compute closer to end users. Edge nodes ranging from 250 kW to 1 MW are now installed in retail strips, telco hubs, and municipal shelters, each fitted with lithium-ion UPS, compact gensets, and remote-management firmware. Distributed sites complicate capacity planning because utility feeders vary widely in voltage stability and outage frequency. Operators mitigate risk with dual-feed automatic transfer switches and cloud-based SCADA dashboards that aggregate alarms across hundreds of micro facilities. Content delivery acceleration also demands higher burst power to cover codec transcoding spikes, prompting adoption of static-switch UPS topologies that deliver millisecond transfer times. The cumulative effect of thousands of edge sites lifts overall regional load, yet each location must comply with state energy codes that increasingly cap allowable PUE thresholds.
High Upfront CAPEX for Power & Cooling Retrofits
Many brownfield data centers were designed for 5-15 kW racks and must be gutted to accommodate 40-140 kW AI loads. Electrical rooms often need transformer upsizing, busway rerouting, and replacement of air-cooled CRAC units with liquid chillers, driving project costs above new-build benchmarks. Operators must stage construction around live workloads, lengthening schedules and elevating risk. Smaller providers struggle to secure financing for large-scale electrical upgrades without anchor customers or government incentives. Even where funding is available, supply-chain lead times for 24-kV switchgear and 3 MVA UPS frames can exceed 60 weeks. The immediate cash outlay thus curbs near-term market penetration of AI-optimized power solutions.
Other drivers and restraints analyzed in the detailed report include:
- Stringent PUE / Energy-Efficiency Mandates
- Colocation Demand from BFSI and Healthcare Digitalization
- Grid-Capacity Bottlenecks in Tier-1 Metros
For complete list of drivers and restraints, kindly check the Table Of Contents.
Segment Analysis
The segment holding 44.40% of 2025 revenue remains power-distribution solutions-switchgear, PDU, and busway-that form the electrical backbone of every facility. However, services are expanding at a 6.98% CAGR because owners need design, integration, and predictive-maintenance expertise. Consulting engagements now begin months before ground-break, covering harmonic analysis, short-circuit studies, and energy-storage ROI modeling. Integration specialists engineer "single-line-diagram" conformity across multi-phase build-outs to avoid stranded capacity. Support teams embed edge analytics in UPS modules, generating data that auto-creates work orders before SLA breaches. Those value-added services raise stickiness, turning hardware suppliers into long-term partners.
Vendors bundle firmware upgrades that enable advanced runtime calculations, extending battery life and cutting replace-ment cycles. Where labor availability is tight, remote-hands contracts cover IR scanning, breaker racking, and thermal runway avoidance. The North America data center power market benefits because service annuities smooth revenue between mega-project cycles, incentivizing firms to maintain large regional field forces that in turn reassure hyperscale clients of rapid response times.
Hyperscale campuses held 47.55% share in 2025, reflecting their sheer size and standardized power blocks. Yet edge and micro data centers deliver the fastest 6.92% CAGR as AI inference shifts compute toward consumers. These pods rely on 208/415 V distribution with high-efficiency line-interactive UPS to minimize footprint, contrasting with 13.8 kV feeders and double-conversion UPS found in hyperscale builds. The North America data center power market size for edge form factors thus grows on a unit-count basis rather than megawatt alone.
In parallel, enterprise facilities embrace hybrid models, expanding electrical capacity to host private-cloud clusters while off-loading latency-sensitive tasks to nearby edge nodes. Operators adopt modular battery cabinets that scale in 100 kW increments, matching phased IT expansions. Hyperscale builders experiment with direct renewable feeders combined with short-duration flywheel UPS to shave opex. The convergence of design philosophies drives suppliers to offer "families" of switchgear and UPS that share firmware and monitoring APIs, cutting integration costs across facility classes.
The North America Data Center Power Market Report is Segmented by Type (Solution, and Service), Data Center Type (Colocation, Hyperscale, and More), End-User Industry (BFSI, IT and Telecom, and More), Power Capacity (<= 500 KW, Greater Than 3 MW, and More), Tier Standard (Tier I and II, Tier IV, and More), and Geography (United States, Canada and More). Market Forecasts are Provided in Terms of Value (USD).
List of Companies Covered in this Report:
- ABB Ltd
- Schneider Electric
- Vertiv Group Corp.
- Eaton Corp. (incl. Tripp Lite)
- Legrand (Raritan, Starline)
- nVent (Enlogic)
- Siemens AG
- Cummins Inc.
- Caterpillar Inc.
- Generac Power Systems
- Mitsubishi Electric
- Delta Electronics
- Huawei Technologies Co. Ltd.
- Piller Power Systems
- Kohler Co.
- LayerZero Power Systems
- Socomec Group
- Panduit Corp.
- Riello UPS
- Power Innovations International
- Starline (Legrand)
- Powin Energy
- Bloom Energy
Additional Benefits:
- The market estimate (ME) sheet in Excel format
- 3 months of analyst support
TABLE OF CONTENTS
1 INTRODUCTION
- 1.1 Study Assumptions and Market Definition
- 1.2 Scope of the Study
2 RESEARCH METHODOLOGY
3 EXECUTIVE SUMMARY
4 MARKET LANDSCAPE
- 4.1 Market Overview
- 4.2 Market Drivers
- 4.2.1 Rising adoption of hyperscale and mega data centers
- 4.2.2 Surge in cloud computing and OTT traffic
- 4.2.3 Stringent PUE / energy-efficiency mandates
- 4.2.4 Colocation demand from BFSI and healthcare digitalization
- 4.2.5 Utility-scale renewable PPAs stabilising power costs
- 4.2.6 Edge-AI micro DC rollout in rural and suburban clusters
- 4.3 Market Restraints
- 4.3.1 High upfront CAPEX for power and cooling retrofits
- 4.3.2 Grid-capacity bottlenecks in Tier-1 metros
- 4.3.3 Shortage of certified high-voltage technicians
- 4.3.4 Water-based cooling's hidden power penalty scrutiny
- 4.4 Value / Supply-Chain Analysis
- 4.5 Regulatory Landscape
- 4.6 Technological Outlook
- 4.7 Porter's Five Forces
- 4.7.1 Bargaining Power of Suppliers
- 4.7.2 Bargaining Power of Buyers
- 4.7.3 Threat of New Entrants
- 4.7.4 Threat of Substitutes
- 4.7.5 Intensity of Competitive Rivalry
- 4.8 Geopolitical Impact on DC Infrastructure
- 4.9 Industry Ecosystem Analysis
5 ANALYSIS OF DATA CENTER FOOTPRINT IN NORTH AMERICA
- 5.1 Analysis of current DC footprint in terms of IT load capacity and of Data Centers in the North America
- 5.2 Analysis of ley hotspots in the North America (top 15 hotspots will be analyzed in the region)
- 5.3 Analysis of overall spending on Data Center Infrastructure in North America
6 MARKET SIZE AND GROWTH FORECASTS (VALUE, USD)
- 6.1 By Type
- 6.1.1 By Solution Type
- 6.1.1.1 Power Distribution Solutions
- 6.1.1.1.1 Transfer Switches
- 6.1.1.1.2 Switchgear
- 6.1.1.1.3 Power Panels and Components
- 6.1.1.1.4 Others
- 6.1.1.2 Power Backup Solutions
- 6.1.1.2.1 UPS
- 6.1.1.2.2 Generators
- 6.1.1.1 Power Distribution Solutions
- 6.1.2 Service - Design and Consulting, Integration, Support and Maintenance
- 6.1.1 By Solution Type
- 6.2 By Data Center Type
- 6.2.1 Colocation Facilities
- 6.2.2 Enterprise/Edge Facilities
- 6.2.3 Hyperscale/Self-built Facilities
- 6.3 By End-User Industry
- 6.3.1 BFSI
- 6.3.2 IT and Telecom
- 6.3.3 Government and Defense
- 6.3.4 Manufacturing and Industrial
- 6.3.5 Media and Entertainment
- 6.3.6 Healthcare and Life Sciences
- 6.3.7 Retail and E-commerce
- 6.4 By Power Capacity
- 6.4.1 less than or equal to 500 kW
- 6.4.2 501 kW - 1 MW
- 6.4.3 1.1 - 3 MW
- 6.4.4 greater than 3 MW
- 6.5 By Tier Standard
- 6.5.1 Tier I and II
- 6.5.2 Tier III
- 6.5.3 Tier IV
- 6.6 By Country
- 6.6.1 United States
- 6.6.2 Canada
- 6.6.3 Mexico
7 COMPETITIVE LANDSCAPE
- 7.1 Market Share Analysis
- 7.2 Company Profiles (includes Global level Overview, Market level overview, Core Segments, Financials as available, Strategic Information, Market Rank/Share for key companies, Products and Services, and Recent Developments)
- 7.2.1 ABB Ltd
- 7.2.2 Schneider Electric
- 7.2.3 Vertiv Group Corp.
- 7.2.4 Eaton Corp. (incl. Tripp Lite)
- 7.2.5 Legrand (Raritan, Starline)
- 7.2.6 nVent (Enlogic)
- 7.2.7 Siemens AG
- 7.2.8 Cummins Inc.
- 7.2.9 Caterpillar Inc.
- 7.2.10 Generac Power Systems
- 7.2.11 Mitsubishi Electric
- 7.2.12 Delta Electronics
- 7.2.13 Huawei Technologies Co. Ltd.
- 7.2.14 Piller Power Systems
- 7.2.15 Kohler Co.
- 7.2.16 LayerZero Power Systems
- 7.2.17 Socomec Group
- 7.2.18 Panduit Corp.
- 7.2.19 Riello UPS
- 7.2.20 Power Innovations International
- 7.2.21 Starline (Legrand)
- 7.2.22 Powin Energy
- 7.2.23 Bloom Energy
8 MARKET OPPORTUNITIES AND FUTURE OUTLOOK
- 8.1 White-space and Unmet-Need Assessment
 资料中心电源市场:按组件类型、层级、资料中心类型和行业划分 - 全球市场预测(2026-2032 年)
 资料中心电源市场分析及预测(至2035年):类型、产品类型、服务、技术、组件、应用、部署模式、最终用户、解决方案、交付模式
 2026年全球资料中心电力市场报告2026年全球资料中心电源管理市场报告伺服器电源市场:依产品类型、组件、额定功率、外形规格、应用、最终用户和通路划分-2026-2030年全球预测资料中心以AC-DC电源市场:按组件、电源类型、冗余方式和应用划分-2026-2032年全球预测资料中心电源系统氮化镓市场分析及预测(至2035年):依类型、产品、服务、技术、组件、应用、形式、材料类型、装置及部署方式划分
 全球资料中心电力市场规模、份额、趋势和成长分析报告(2026-2034)全球资料中心电力市场:市场规模、占有率、成长率、产业分析、依类型、应用和地区划分的分析及预测(2026-2034 年)
 资料中心电源市场 - 全球产业规模、份额、趋势、机会及预测(按解决方案、组件、最终用户产业、地区和竞争格局划分),2021-2031年