


 |
市场调查报告书
商品编码
1906948
生物刺激剂:市场占有率分析、产业趋势与统计、成长预测(2026-2031)Biostimulants - Market Share Analysis, Industry Trends & Statistics, Growth Forecasts (2026 - 2031) |
||||||
※ 本网页内容可能与最新版本有所差异。详细情况请与我们联繫。
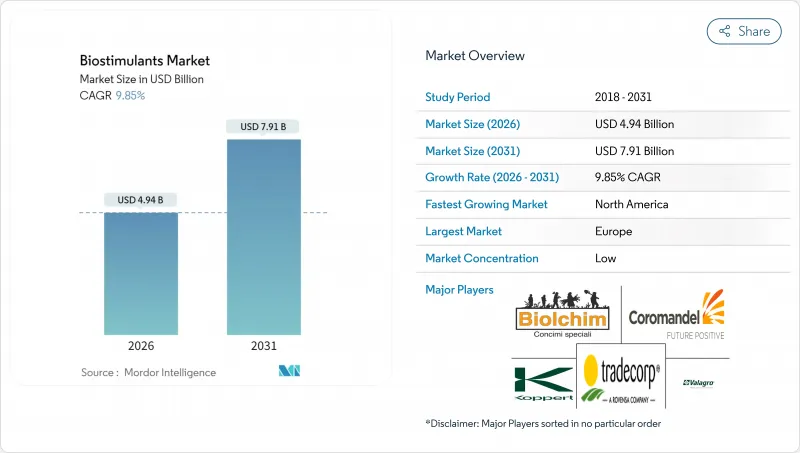
2025年生物刺激剂市值为45亿美元,预计2031年将达到79.1亿美元,高于2026年的49.4亿美元。
预计在预测期(2026-2031 年)内,复合年增长率将达到 9.85%。
这一增长势头源于对永续作物投入品的强劲需求、日益统一的监管定义以及生物材料与产量稳定性之间联繫的不断积累的证据。农民正将生物刺激剂纳入传统的土壤肥力管理方案,以提高作物的抗逆性并合格新的碳信用额度。同时,生产商正加速推出将微生物群落与胺基酸和腐植酸结合的产品,力求广泛的兼容性。儘管欧洲凭藉早期明确的监管政策继续保持创新中心的地位,但北美目前正经历着最快速的推广应用,这主要得益于美国「气候智慧型商品伙伴关係计画」(Climate Smart Commodity Partnership program),该计画为田间应用成本提供高达75%的补贴。此外,美国植物营养官员协会(AAPFCO)的努力已使美国所有司法管辖区的註册流程标准化,核准时间缩短了约三分之一,进一步支持了全球扩张。
全球生物刺激剂市场趋势与洞察
对有机食品的需求不断增长
美国的有机农地面积持续扩大,印证了消费者愿意为使用生物投入物种植的农产品支付溢价。欧洲的「从农场到餐桌」框架旨在2030年实现25%的农地有机化,该框架正在加速生产者采用生物刺激剂,以确保在过渡期内的产量。美国国家有机计划发布的指南明确了核准的生物刺激剂类别,消除了先前在认证方面的模糊之处。价格的上涨,加上专业零售通路需求的激增,正在推动农场层面高纯度胺基酸和海藻萃取物的投资回报。
政府补助和支持条例
气候智慧型商品伙伴关係已拨出大量资金用于永续种植实践的补贴,符合条件的种植者可收回高达75%的生物刺激剂成本。加州健康土壤计画也提供额外的成本分摊津贴。在产业方面,美国植物营养官员协会统一了各州的定义,减少了製造商重复的资料提交流程,并加快了产品推广速度。欧洲通用农业政策生态计划也进行了类似的协调,让农民将生物刺激剂纳入其养分管理计划,并申请补助。
监理定义不统一
在欧盟以外,许多司法管辖区仍将生物刺激剂归类为农药,这增加了合规成本,因为需要提供额外的毒性数据。东南亚和非洲国家通常没有专门的审查委员会,这可能导致产品上市延迟长达两个种植季。国际标准化组织 (ISO) 的一个工作小组正在製定全球指南,但预计实施时间将推迟到 2027 年以后。
细分市场分析
预计到2025年,胺基酸将占总收入的30.62%,这证实了其在施肥灌溉和叶面喷布计画中作为高价值园艺作物非生物胁迫管理手段的广泛应用。每英亩40-80美元的相对收益可抵消15-25美元的投入成本,这促使人们继续在番茄、辣椒和黄瓜种植系统中使用氨基酸。氨基酸与滴灌化学品的兼容性以及已证实的储存稳定性,也使其持续受到保护性种植者的青睐。园艺一体化企业在寻求符合美国国家有机计划(NOP)法规时也倾向于选择胺基酸,因为大多数酶解途径都符合有机加工标准。水溶性腐植酸仍是成长最快的子类别,预计到2031年将以12.45%的复合年增长率成长。腐植酸的土壤改良机制,例如螯合微量元素和提高阳离子交换能力,受到注重根际健康的玉米和大豆种植者的青睐。
製造商正着重强调其产品与传统尿素-硝酸铵溶液的交叉相容性,以扩大其在主流农作物中的应用。改良的颗粒包覆技术可实现均匀的粒径,避免以往阻碍其使用的设备堵塞问题。蛋白质水解物在经认证的有机产业链中持续占据市场份额,其中动物源氨基酸混合物可在一次施用中同时提供氮和碳。海藻萃取物仍然至关重要,但面临供应不稳定的问题,促使人们利用精准发酵技术开发合成类似物。富里酸在采用变数喷雾器的精密农业农业种植者中越来越受欢迎,其低分子量使其能够快速渗透组织,并可透过频谱无人机影像进行持续的反应监测。
生物刺激剂市场报告按形态(胺基酸、富里酸、腐植酸等)、作物类型(经济作物、园艺作物、田间作物等)和地区(北美、南美、欧洲等)进行细分。市场预测以价值(美元)和数量(公吨)为单位。
区域分析
2025年,欧洲在全球农业价值份额中维持38.62%的领先地位,这得益于成熟的监管体系和通用农业政策生态方案中完善的补贴机制。荷兰生产商正在使用适用于化学肥料灌溉的腐植酸,既保证了产量上限,又减少了硝酸盐径流造成的损失。丹麦耕地农民利用其25%的有机耕地目标,以优惠利率获得银行贷款,条件是他们在营养计划中加入生物刺激剂,从而将经济奖励与生物技术的采用相结合。波兰和罗马尼亚的东欧生产商正受益于农村发展支柱计画提供的知识转移和资金支持,这为该地区继续保持主导地位奠定了基础。
预计北美将呈现最高的成长轨迹,到2031年复合年增长率将达到12.35%。美国伙伴关係津贴吸引了像Archer Daniels Midland这样的企业聚合商赞助跨州先导计画并促进面积调整。爱荷华州立大学和堪萨斯州立大学等高校正在透过提供开放取用的田间试验资料集来降低农场层面的试验风险,从而加速玉米带地区的推广应用。加拿大的永续农业策略也体现了类似的奖励,让小麦和菜籽生产商在从合成生长调节剂转向生物增效剂时,符合温室排放减排通讯协定。
亚太地区展现出多层次的潜力。中国的国家生物农业指令将生物刺激剂列为战略投入品,但分散的地方监管体系阻碍了其统一推广应用。印度的有机认证转移计画正在推动对高价值巴斯马蒂大米和芒果出口的需求,但高纯度原料的供应仍然不稳定。南美洲,尤其是巴西,大豆种植者正透过采用腐植酸来控制酸性土壤中的铝毒害,取得了进展。阿根廷的犁地种植系统正在将微生物种子披衣纳入更广泛的再生农业方案。儘管中东和非洲地区仍处于发展阶段,但以色列和摩洛哥已开始探索在灌溉受限的园艺种植中,利用富里酸根部灌溉来缓解盐碱化通讯协定。
其他福利:
- Excel格式的市场预测(ME)表
- 3个月的分析师支持
目录
第一章 引言
- 研究假设和市场定义
- 调查范围
- 调查方法
第二章 报告
第三章执行摘要和主要发现
第四章:主要产业趋势
- 有机耕作面积
- 人均有机产品支出
- 法律规范
- 阿根廷
- 澳洲
- 巴西
- 加拿大
- 中国
- 埃及
- 法国
- 德国
- 印度
- 印尼
- 义大利
- 日本
- 墨西哥
- 荷兰
- 奈及利亚
- 菲律宾
- 俄罗斯
- 南非
- 西班牙
- 泰国
- 土耳其
- 英国
- 美国
- 越南
- 价值炼和通路分析
- 市场驱动因素
- 对有机食品的需求不断增长
- 政府补贴和扶持性法规
- 永续性生产者的采用
- 产量和非生物胁迫改善的证据
- 将种子披衣和微量营养素混合物整合在一起
- 排碳权货币化的可能性
- 市场限制
- 监理定义不一致
- 农民缺乏意识,对效果持怀疑态度
- 与微生物接种剂和生物肥料的竞争
- 海藻原料供应风险
第五章 市场规模和成长预测(价值和数量)
- 按形式
- 胺基酸
- 富里酸
- 腐植酸
- 蛋白质水解物
- 海藻萃取物
- 其他生物刺激剂市场
- 按作物类型
- 经济作物
- 园艺作物
- 田间作物
- 按地区
- 非洲
- 按国家/地区
- 埃及
- 奈及利亚
- 南非
- 其他非洲地区
- 按国家/地区
- 亚太地区
- 按国家/地区
- 澳洲
- 中国
- 印度
- 印尼
- 日本
- 菲律宾
- 泰国
- 越南
- 亚太其他地区
- 按国家/地区
- 欧洲
- 按国家/地区
- 法国
- 德国
- 义大利
- 荷兰
- 俄罗斯
- 西班牙
- 土耳其
- 英国
- 其他欧洲地区
- 按国家/地区
- 中东
- 按国家/地区
- 伊朗
- 沙乌地阿拉伯
- 其他中东地区
- 按国家/地区
- 北美洲
- 按国家/地区
- 加拿大
- 墨西哥
- 美国
- 北美其他地区
- 按国家/地区
- 南美洲
- 按国家/地区
- 阿根廷
- 巴西
- 南美洲其他地区
- 按国家/地区
- 非洲
第六章 竞争情势
- 重大策略倡议
- 市占率分析
- 公司概况
- 公司简介
- Valagro(Syngenta Group)
- Trade Corporation International(Rovensa Group)
- Atlantica Agricola SA
- Agriculture Solutions Inc.
- Biolchim SpA(JM Huber Corporation)
- Coramandel International Limited
- UPL Ltd.
- BASF SE
- Bayer AG
- FMC Corporation
- Koppert Group
- Gowan Company
- Haifa Group(Trance Resource Minerals Pte.)
- BioAtlantis Ltd.
第七章:CEO们需要思考的关键策略问题
The biostimulants market was valued at USD 4.5 billion in 2025 and estimated to grow from USD 4.94 billion in 2026 to reach USD 7.91 billion by 2031, at a CAGR of 9.85% during the forecast period (2026-2031).
Surging demand for sustainable crop inputs, growing alignment of regulatory definitions, and mounting evidence linking biologicals with yield stability are anchoring this momentum. Farmers are integrating biostimulants with conventional fertility programs to widen stress-tolerance ranges and qualify for emerging carbon-credit schemes, while manufacturers accelerate product launches that pair microbial consortia with amino and humic acids for broader compatibility. Europe continues to serve as the innovation hub because of early regulatory clarity, although North America now records the sharpest deployment curve under the United States Department of Agriculture Climate-Smart Commodities Partnership, which reimburses up to 75% of field-level application costs. Global expansion is further supported by the Association of American Plant Food Control Officials' initiative that standardizes registration pathways across the United States jurisdictions, cutting approval times by nearly one-third.
Global Biostimulants Market Trends and Insights
Growing demand for organic food products
Organic acreage in the United States is continuously expanding, confirming consumer willingness to pay premiums for produce cultivated with biological inputs. Europe's Farm to Fork framework, which targets 25 % organic farmland by 2030, quickens biostimulant uptake among producers seeking to safeguard yields during transition periods. National Organic Program guidance now lists approved biostimulant categories, clearing prior ambiguity around certification. Parallel surges in specialty retail channels strengthen price realization, driving farm-level return on investment for high-purity amino and seaweed extracts.
Government subsidies and supportive regulations
The Climate-Smart Commodities Partnership sets aside significant fund for sustainable practice reimbursements, with eligible growers recouping as much as 75 % of biostimulant costs. California's Healthy Soils Program layers additional cost-share grants. On the industry side, the Association of American Plant Food Control Officials harmonized state-by-state definitions, trimming redundant data filing steps for manufacturers and expediting product rollouts. Similar alignment across Europe's Common Agricultural Policy eco-schemes allows farmers to claim payments after integrating biostimulants into nutrient-management plans.
Heterogeneous regulatory definitions
Outside the European Union, many jurisdictions still file biostimulants under pesticide statutes, adding toxicological data requirements that inflate compliance costs. Countries in Southeast Asia and Africa often lack dedicated review committees, delaying market entry by up to two seasons. Pending International Organization for Standardization workstreams aim to deliver global guidelines, yet implementation timelines stretch beyond 2027.
Other drivers and restraints analyzed in the detailed report include:
- Sustainability-driven grower adoption
- Yield and abiotic-stress improvement evidence
- Low farmer awareness and efficacy skepticism
For complete list of drivers and restraints, kindly check the Table Of Contents.
Segment Analysis
Amino acids captured 30.62 % of 2025 revenue, confirming their widespread acceptance in fertigation and foliar programs addressing abiotic stress in high-value horticulture. Comparative returns of USD 40 - 80 per acre offset input costs of USD 15 - 25, encouraging continuous application in tomato, pepper, and cucumber systems. Compatibility with drip irrigation chemistries and proven shelf stability underpin loyalty among protected-crop producers. Horticultural integrators also favor amino acids when seeking to meet National Organic Program rules because most enzymatic hydrolysis routes qualify under organic processing standards. Water-soluble humic acids remain the breakout subcategory, projected to register a 12.45 % CAGR through 2031. Soil-conditioning mechanisms that chelate micronutrients and improve cation-exchange capacity resonate with corn and soybean growers focused on root-zone health.
Manufacturers highlight cross-compatibility with conventional urea ammonium nitrate solutions to expand usage in mainstream row crops. Improved prill coating technologies deliver uniform particle size, avoiding equipment blockages that once hindered use. Protein hydrolysates continue to build share in certified organic chains, where animal-derived amino blends contribute nitrogen and carbon in a single pass. Seaweed extracts, although still integral, face supply volatility that encourages synthetic analog development using precision fermentation. Fulvic acids are gaining loyalty among precision farmers deploying variable-rate sprayers because their lower molecular weight supports rapid tissue infiltration, allowing consistent response monitoring through multispectral drone imagery.
The Biostimulants Market Report is Segmented by Form (Amino Acids, Fulvic Acid, Humic Acid, and More), Crop Type (Cash Crops, Horticultural Crops, and Row Crops), and Geography (North America, South America, Europe, and More). The Market Forecasts are Provided in Terms of Value (USD) and Volume (Metric Tons).
Geography Analysis
Europe retained 38.62 % value share in 2025 on the back of a mature regulatory infrastructure and comprehensive subsidies within the Common Agricultural Policy eco-scheme. Producers in the Netherlands use fertigation-compatible humic acids to cut nitrate leaching fines while safeguarding yield ceilings. Danish arable farms leverage the 25 % organic land goal to secure bank loans at preferential rates, provided that biostimulants feature in nutrient plans, thereby tying financial incentives to biological adoption. Eastern European producers in Poland and Romania benefit from knowledge transfer and funding via Rural Development Program pillars, positioning the bloc for continued leadership.
North America registers the highest growth curve at 12.35 % CAGR by 2031. The United States Department of Agriculture partnership grants draw corporate aggregators such as Archer Daniels Midland to sponsor multistate pilot projects, encouraging acreage alignment. Universities, including Iowa State and Kansas State, deliver open-access field trial datasets that de-risk farm-level experiments, accelerating diffusion in the Corn Belt. Canada's Sustainable Agriculture Strategy mirrors these incentives, enabling wheat and canola growers to qualify for greenhouse-gas offset protocols when switching from synthetic growth regulators to biological enhancers.
Asia-Pacific demonstrates layered potential. China's domestic biological-agriculture directive lists biostimulants as strategic inputs, but fragmented provincial oversight slows homogeneous deployment. India's organic transfer schemes boost demand in high-value basmati rice and mango exports, yet supply of high-purity raw materials remains uneven. South America gains traction largely in Brazil, where soybean producers adopt humic acids to manage aluminum toxicity in acid soils. Argentina's no-till systems integrate microbial seed coatings as part of wider regenerative packages. Middle East and Africa stay nascent, though irrigation-constrained horticulture in Israel and Morocco begins to explore fulvic acid root-drench protocols to mitigate salinity.
- Valagro (Syngenta Group)
- Trade Corporation International ( Rovensa Group )
- Atlantica Agricola S.A.
- Agriculture Solutions Inc.
- Biolchim SpA ( J. M. Huber Corporation )
- Coramandel International Limited
- UPL Ltd.
- BASF SE
- Bayer AG
- FMC Corporation
- Koppert Group
- Gowan Company
- Haifa Group ( Trance Resource Minerals Pte. )
- BioAtlantis Ltd.
Additional Benefits:
- The market estimate (ME) sheet in Excel format
- 3 months of analyst support
TABLE OF CONTENTS
1 INTRODUCTION
- 1.1 Study Assumptions and Market Definition
- 1.2 Scope of the Study
- 1.3 Research Methodology
2 REPORT OFFERS
3 EXECUTIVE SUMMARY AND KEY FINDINGS
4 KEY INDUSTRY TRENDS
- 4.1 Area Under Organic Cultivation
- 4.2 Per Capita Spending on Organic Products
- 4.3 Regulatory Framework
- 4.3.1 Argentina
- 4.3.2 Australia
- 4.3.3 Brazil
- 4.3.4 Canada
- 4.3.5 China
- 4.3.6 Egypt
- 4.3.7 France
- 4.3.8 Germany
- 4.3.9 India
- 4.3.10 Indonesia
- 4.3.11 Italy
- 4.3.12 Japan
- 4.3.13 Mexico
- 4.3.14 Netherlands
- 4.3.15 Nigeria
- 4.3.16 Philippines
- 4.3.17 Russia
- 4.3.18 South Africa
- 4.3.19 Spain
- 4.3.20 Thailand
- 4.3.21 Turkey
- 4.3.22 United Kingdom
- 4.3.23 United States
- 4.3.24 Vietnam
- 4.4 Value Chain and Distribution Channel Analysis
- 4.5 Market Drivers
- 4.5.1 Growing demand for organic food products
- 4.5.2 Government subsidies and supportive regulations
- 4.5.3 Sustainability-driven grower adoption
- 4.5.4 Yield and abiotic-stress improvement evidence
- 4.5.5 Seed-coating and micronutrient blend integration
- 4.5.6 Carbon-credit monetization potential
- 4.6 Market Restraints
- 4.6.1 Heterogeneous regulatory definitions
- 4.6.2 Low farmer awareness and efficacy skepticism
- 4.6.3 Competition from microbial inoculants and biofertilizers
- 4.6.4 Seaweed raw-material supply risk
5 MARKET SIZE AND GROWTH FORECASTS (VALUE AND VOLUME)
- 5.1 Form
- 5.1.1 Amino Acids
- 5.1.2 Fulvic Acid
- 5.1.3 Humic Acid
- 5.1.4 Protein Hydrolysates
- 5.1.5 Seaweed Extracts
- 5.1.6 Other Biostimulants
- 5.2 Crop Type
- 5.2.1 Cash Crops
- 5.2.2 Horticultural Crops
- 5.2.3 Row Crops
- 5.3 Geography
- 5.3.1 Africa
- 5.3.1.1 By Country
- 5.3.1.1.1 Egypt
- 5.3.1.1.2 Nigeria
- 5.3.1.1.3 South Africa
- 5.3.1.1.4 Rest of Africa
- 5.3.1.1 By Country
- 5.3.2 Asia-Pacific
- 5.3.2.1 By Country
- 5.3.2.1.1 Australia
- 5.3.2.1.2 China
- 5.3.2.1.3 India
- 5.3.2.1.4 Indonesia
- 5.3.2.1.5 Japan
- 5.3.2.1.6 Philippines
- 5.3.2.1.7 Thailand
- 5.3.2.1.8 Vietnam
- 5.3.2.1.9 Rest of Asia-Pacific
- 5.3.2.1 By Country
- 5.3.3 Europe
- 5.3.3.1 By Country
- 5.3.3.1.1 France
- 5.3.3.1.2 Germany
- 5.3.3.1.3 Italy
- 5.3.3.1.4 Netherlands
- 5.3.3.1.5 Russia
- 5.3.3.1.6 Spain
- 5.3.3.1.7 Turkey
- 5.3.3.1.8 United Kingdom
- 5.3.3.1.9 Rest of Europe
- 5.3.3.1 By Country
- 5.3.4 Middle East
- 5.3.4.1 By Country
- 5.3.4.1.1 Iran
- 5.3.4.1.2 Saudi Arabia
- 5.3.4.1.3 Rest of Middle East
- 5.3.4.1 By Country
- 5.3.5 North America
- 5.3.5.1 By Country
- 5.3.5.1.1 Canada
- 5.3.5.1.2 Mexico
- 5.3.5.1.3 United States
- 5.3.5.1.4 Rest of North America
- 5.3.5.1 By Country
- 5.3.6 South America
- 5.3.6.1 By Country
- 5.3.6.1.1 Argentina
- 5.3.6.1.2 Brazil
- 5.3.6.1.3 Rest of South America
- 5.3.6.1 By Country
- 5.3.1 Africa
6 COMPETITIVE LANDSCAPE
- 6.1 Key Strategic Moves
- 6.2 Market Share Analysis
- 6.3 Company Landscape
- 6.4 Company Profiles (Includes Global Level Overview, Market Level Overview, Core Segments, Financials as available, Strategic Information, Market Rank/Share, Products and Services, and Recent Developments)
- 6.4.1 Valagro (Syngenta Group)
- 6.4.2 Trade Corporation International ( Rovensa Group )
- 6.4.3 Atlantica Agricola S.A.
- 6.4.4 Agriculture Solutions Inc.
- 6.4.5 Biolchim SpA ( J. M. Huber Corporation )
- 6.4.6 Coramandel International Limited
- 6.4.7 UPL Ltd.
- 6.4.8 BASF SE
- 6.4.9 Bayer AG
- 6.4.10 FMC Corporation
- 6.4.11 Koppert Group
- 6.4.12 Gowan Company
- 6.4.13 Haifa Group ( Trance Resource Minerals Pte. )
- 6.4.14 BioAtlantis Ltd.
7 KEY STRATEGIC QUESTIONS FOR AGRICULTURAL BIOLOGICALS CEOS
 中国生物刺激剂市场:市场占有率分析、产业趋势与统计、成长预测(2026-2031)欧洲生物刺激剂:市场占有率分析、产业趋势与统计、成长预测(2026-2031)
 全球生物刺激剂市场规模、份额、趋势和成长分析报告(2026-2034年)
 2026年全球生物刺激剂市场报告
 生物刺激剂市场规模、份额和趋势分析报告:按活性成分、作物类型、应用、地区和细分市场预测(2026-2033 年)
 24- 表油菜素内酯市场按形态、作物类型、应用、最终用途和分销管道划分 - 全球预测(2026-2032 年)PGPR生物刺激剂市场按类型、作物类型、配方、应用和最终用户划分-2026-2032年全球预测微生物植物生长促进剂市场(依微生物类型、作物类型、配方、功能、应用方法和通路)——2026-2032年全球预测海藻衍生生物刺激剂市场按作物类型、产品类型、海藻类型、应用方法、通路和最终用途划分,全球预测(2026-2032年)草本肥料市场按形态、作物类别、包装、应用和分销管道划分-2026-2032年全球预测