


 |
市场调查报告书
商品编码
1907292
工业包装:市场占有率分析、产业趋势与统计、成长预测(2026-2031)Industrial Packaging - Market Share Analysis, Industry Trends & Statistics, Growth Forecasts (2026 - 2031) |
||||||
※ 本网页内容可能与最新版本有所差异。详细情况请与我们联繫。
预计到 2026 年,工业包装市场价值将达到 745.1 亿美元,高于 2025 年的 709.9 亿美元。
预计到 2031 年,市场规模将达到 949.3 亿美元,2026 年至 2031 年的复合年增长率为 4.96%。
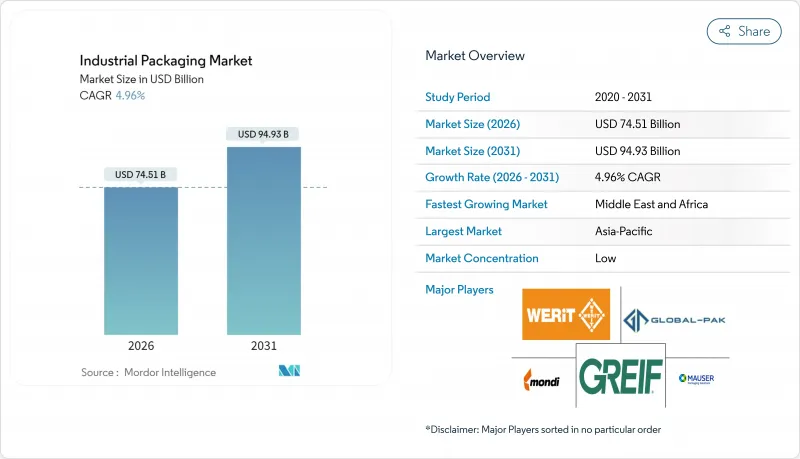
需求韧性反映了履约的扩张、现场包装自动化程度的加速提升,以及日益严格的法规结构,这些因素正在影响整个製造业的材料选择和营运重点。电子商务物流需要能够承受多次配送且体积重量较小的保护性包装,而自动化投资则有助于生产商在劳动力人手不足的市场中减少对劳动力的依赖。亚太地区在2024年将占全球收入的40.45%,这主要得益于该地区高度集中的出口导向製造业。同时,中东和非洲地区将成为成长最快的地区,到2030年将以6.34%的复合年增长率成长,这主要得益于对能源、基础设施和食品加工领域的投资计画。
全球工业包装市场趋势与洞察
永续和可再生材料的兴起
在工业采购中,再生材料含量要求和企业永续性目标正成为采购标准的核心。欧盟规定,到2030年,塑胶製品必须含有30%的再生材料,迫使加工商重新评估其原料来源。纤维素复合材料具有食品和製药应用所需的强度和防潮性,并符合ISO 14855生物降解标准。辉瑞公司透过将包装改为可回收形式,在遵守FDA 21 CFR 211无菌法规的前提下,减少了25%的包装废弃物。生产商透过投资生物基涂料来取代PFAS,从而规避树脂价格波动风险,同时遵守新的禁令。随着研发投入的增加,早期采用者正在获得成本和合规优势,并提高客户维繫。
不断扩大的电子商务和跨境贸易流量
2024年,美国电子商务销售额将达到1.14兆美元,占零售总额的16.4%。多次搬运的小包裹需要缓衝保护和高效的体积重量设计。日处理量超过2,000件的物流中心越来越多地使用机器人进行包装,机器人包装准确率高达99.5%,并可降低40%的人事费用。特斯拉在实施自适应包装系统后,材料用量减少了18%。日益复杂的药品监管正在推动药品包装转向符合跨市场ICH通讯协定规范的标准化全球格式。
树脂和钢材价格波动
2024年,钢材价格维持在每吨650-850美元的区间,给签订长期合约的钢桶製造商带来压力。聚乙烯和聚丙烯价格波动15-20%,由于原物料成本占总成本的60-70%,生产商必须自行承担价格波动的影响。陶氏化学的供应商利润率下降了12%。弹性价格设定和短期合约的使用正在增加,而重新谈判的次数比2024年之前增加了25%,这给双方关係带来了压力。
细分市场分析
预计到2031年,中型散货箱将以6.98%的复合年增长率快速增长,这主要得益于氢气计划对350-700巴压力下复合材料容器的需求。至2025年,桶装容器将占工业包装市场的35.02%,并继续保持其作为多用途化学品主要包装容器的地位。
IBC(中型散装容器)受惠于氢能中心70亿美元的资金筹措,而钢桶的需求则面临原物料价格波动的挑战,并享有联合国认证的认可。柔性IBC符合ATEX标准,并采用防静电材料製成,因此适用于爆炸性环境。
塑胶仍将保持其主导地位,2025年将占据46.02%的市场份额,但面临日益增长的监管压力。随着不含PFAS的阻隔涂层技术的成熟,纸张和纺织材料预计将以6.61%的复合年增长率成长。
根据 TAPPI 统计,阻隔性纸板产量增加了 25%,汽车製造商强制要求可回收塑胶容器含有 30% 的再生材料,先进的纤维素薄膜具有与聚乙烯相当的氧气阻隔性能,从而扩大了纸张的用途。
区域分析
预计到2025年,亚太地区将占全球收入的40.12%,这主要得益于出口主导製造业的发展以及国内包装器材产量8.1%的成长。中东和非洲地区预计将引领区域成长,年复合成长率将达到6.18%,这主要得益于一项价值200亿美元的石化计划。
北美正受惠于近岸外包,墨西哥的出口额成长了 15%,达到 4,920 亿美元,而欧洲正在加强其循环经济通讯协定,优先考虑可回收形式。
沙乌地阿拉伯的产业政策正在推动对符合联合国标准的大型桶和复合材料IBC货柜的需求。印度340亿卢比(约4.08亿美元)的食品加工投资正在推动纺织品二次包装的发展。日本的化学品安全法规正在推动高阻隔多层包装的转变。阿联酋的产业策略旨在将製造业占GDP的比重提高到25%,从而刺激对区域托盘和货柜共享服务的需求。
非洲大陆自由贸易协定(AfCFTA)框架将促进区域内贸易,并为跨境部署标准化工业包装市场解决方案铺路。撒哈拉以南非洲的基础建设将增加对水泥和化学品运输用袋装和桶装包装的需求。欧洲港口正在透过扩展电子资料交换(EDI)文件和采用国际标准散装容器标籤来加快清关速度。
其他福利:
- Excel格式的市场预测(ME)表
- 3个月的分析师支持
目录
第一章 引言
- 研究假设和市场定义
- 调查范围
第二章调查方法
第三章执行摘要
第四章 市场情势
- 市场概览
- 市场驱动因素
- 永续和可回收材料的兴起
- 电子商务的扩张和跨境贸易的流动
- 食品级和药品散装物流的成长
- 现场包装自动化实施状态
- 可重复使用包装池经营模式
- 氢气供应链对复合材料IBC的需求
- 市场限制
- 树脂和钢材价格波动
- 加强全球环境法规
- 阻隔涂层中禁用 PFAS/微塑料
- 近岸外包减少了长途运输所需的包装量。
- 产业价值链分析
- 监管环境
- 技术展望
- 波特五力分析
- 供应商的议价能力
- 买方的议价能力
- 新进入者的威胁
- 替代品的威胁
- 竞争对手之间的竞争
- 宏观经济因素如何影响市场
第五章 市场规模与成长预测
- 副产品
- 中型散货箱(IBC)
- 鼓
- 萨克斯风
- 桶罐
- 其他产品
- 材料
- 塑胶
- 金属
- 纸张和纤维基
- 其他成分
- 按最终用户行业划分
- 化学品和製药
- 食品/饮料
- 车
- 石油、天然气和石化产品
- 建筑/施工
- 其他终端用户产业
- 按包装容量
- 50公升或以下
- 51-500 L
- 501-1,000 L
- 1,001-2,000 L
- 超过2000公升
- 按地区
- 北美洲
- 美国
- 加拿大
- 墨西哥
- 南美洲
- 巴西
- 阿根廷
- 南美洲其他地区
- 欧洲
- 德国
- 英国
- 法国
- 西班牙
- 义大利
- 其他欧洲地区
- 亚太地区
- 中国
- 日本
- 印度
- 澳洲
- 韩国
- 亚太其他地区
- 中东和非洲
- 中东
- 沙乌地阿拉伯
- 阿拉伯聯合大公国
- 土耳其
- 其他中东地区
- 非洲
- 南非
- 肯亚
- 其他非洲地区
- 中东
- 北美洲
第六章 竞争情势
- 市场集中度
- 策略趋势
- 市占率分析
- 公司简介
- Greif, Inc.
- Mauser Packaging Solutions Holding Company
- Mondi plc
- Smurfit WestRock
- Amcor plc
- International Paper Company
- Packaging Corporation of America
- Schutz GmbH & Co. KGaA
- WERIT Kunststoffwerke W. Schneider GmbH & Co. KG
- Tank Holding Corp.
- Visy Industries Holdings Pty Ltd
- Pact Group Holdings Ltd
- Brambles Limited(CHEP)
- Global-Pak, Inc.
- Nefab AB
- Snyder Industries, LLC
- Myers Container, LLC
- Veritiv Corporation
- Snyder Industries, Inc.
- Pyramid Technoplast Ltd
第七章 市场机会与未来展望
Industrial packaging market size in 2026 is estimated at USD 74.51 billion, growing from 2025 value of USD 70.99 billion with 2031 projections showing USD 94.93 billion, growing at 4.96% CAGR over 2026-2031.
Demand resilience reflects the rise of e-commerce fulfillment, accelerating on-site packaging automation, and stricter regulatory frameworks that shape material choices and operational priorities across manufacturing sectors. E-commerce logistics require protective formats that survive multi-node shipping while keeping dimensional weight low, and automation investments help producers curb labor dependence amid tight labor markets. Asia-Pacific commanded 40.45% of 2024 revenue, supported by dense export-oriented manufacturing, while the Middle East and Africa are advancing the fastest at 6.34% CAGR to 2030 on the back of energy, infrastructure, and food processing investment pipelines.
Global Industrial Packaging Market Trends and Insights
Emergence of Sustainable and Recyclable Materials
Industrial buyers are making recycled-content mandates and corporate sustainability targets a central procurement criterion. The European Union requires 30% recycled content in plastic formats by 2030, compelling converters to overhaul feedstock sourcing. Cellulose-based composites deliver strength and moisture resistance suitable for food and pharma usage and meet ISO 14855 biodegradability thresholds. Pfizer's internal switch to recyclable formats cut packaging waste 25% yet complied with FDA 21 CFR 211 sterility rules. Producers hedge resin volatility by investing in bio-based coatings that replace PFAS while complying with emerging bans. As R&D scales, early adopters gain cost and compliance advantages that enhance customer retention.
Expansion of E-commerce and Cross-Border Trade Flows
E-commerce revenue in the United States hit USD 1.14 trillion in 2024, or 16.4% of retail sales. Multihandled parcels need cushioning and dimensional-weight efficient designs. Facilities shipping more than 2,000 orders per day are increasingly deploying robotics able to pack with 99.5% accuracy and cut labor costs by 40%. Tesla demonstrated an 18% materials drop after installing adaptive packaging systems. Regulatory complexity in pharmaceuticals pushes shippers toward standardized global formats that meet ICH labeling protocols across markets.
Volatile Resin and Steel Prices
Steel ranged from USD 650-850 / t in 2024, squeezing drum makers under long-term contracts. Polyethylene and polypropylene fluctuated 15-20%, with producers absorbing hits because raw inputs form 60-70% of cost. Dow's suppliers suffered 12% margin erosion. Flexible pricing and shorter contracts proliferate, yet renegotiations rose 25% over pre-2024 levels, straining relationships.
Other drivers and restraints analyzed in the detailed report include:
- Growth in Food-Grade and Pharma Bulk Logistics
- On-Site Packaging Automation Adoption
- PFAS / Micro-Plastic Bans on Barrier Coatings
For complete list of drivers and restraints, kindly check the Table Of Contents.
Segment Analysis
Intermediate bulk containers own the fastest 6.98% CAGR to 2031, propelled by hydrogen projects that require 350-700-bar composite vessels. Drums held 35.02% industrial packaging market share in 2025 and remain the backbone for multipurpose chemicals.
IBCs benefit from USD 7 billion in hydrogen hub funding, while steel drum demand faces raw-material swings yet enjoys entrenched UN certification familiarity. Flexible intermediate bulk containers adopt antistatic fabrics compliant with ATEX to serve explosive-atmosphere sectors.
Plastic dominated with 46.02% share in 2025 but faces mounting regulatory scrutiny. Paper and fiber options are set for a 6.61% CAGR as PFAS-free barrier coatings mature.
TAPPI measured 25% growth in barrier paperboard output, and automakers now mandate 30% recycled content in plastic returnable bins. Advanced cellulose films match oxygen barrier performance seen in polyethylene, enlarging paper's addressable use cases.
The Industrial Packaging Market Report is Segmented by Product (Intermediate Bulk Containers, Drums, Sacks, and More), Material (Plastics, Metal, Paper and Fiber-Based, and More), End-User Industry (Chemicals and Pharmaceuticals, Food and Beverage, Automotive, Oil Gas and Petrochemicals, and More), Packaging Capacity (<=50L, 51-500L, 501-1000L, and More), and Geography. The Market Forecasts are Provided in Terms of Value (USD).
Geography Analysis
Asia-Pacific supplied 40.12% of 2025 revenue thanks to export-heavy manufacturing and 8.1% growth in domestic packaging machinery output. Middle East and Africa will top regional growth charts at 6.18% CAGR, aided by USD 20 billion in petrochemical projects.
North America benefits from near-shoring as Mexico's exports rose 15% to USD 492 billion. Europe tightens circular-economy protocols that favor recyclable formats.
Saudi industrial policies drive demand for heavy-duty drums and composite IBCs meeting UN specs. India's food-processing investments worth INR 3,400 crore (USD 408 million) encourage fiber-based secondary packaging. Japanese chemical safety rules inspire high-barrier multilayer upgrades. The UAE's industrial strategy targets 25% manufacturing GDP share, stimulating regional pallet and container pools.
Africa's AfCFTA framework fosters intra-continental trade, opening gateways for standardized industrial packaging market solutions across borders. Sub-Saharan infrastructure work advances demand for large sacks and drums to move cement and chemicals. European ports expand EDI documentation to accelerate customs clearance, prompting adoption of globally harmonized labeling on bulk containers.
- Greif, Inc.
- Mauser Packaging Solutions Holding Company
- Mondi plc
- Smurfit WestRock
- Amcor plc
- International Paper Company
- Packaging Corporation of America
- Schutz GmbH & Co. KGaA
- WERIT Kunststoffwerke W. Schneider GmbH & Co. KG
- Tank Holding Corp.
- Visy Industries Holdings Pty Ltd
- Pact Group Holdings Ltd
- Brambles Limited (CHEP)
- Global-Pak, Inc.
- Nefab AB
- Snyder Industries, LLC
- Myers Container, LLC
- Veritiv Corporation
- Snyder Industries, Inc.
- Pyramid Technoplast Ltd
Additional Benefits:
- The market estimate (ME) sheet in Excel format
- 3 months of analyst support
TABLE OF CONTENTS
1 INTRODUCTION
- 1.1 Study Assumptions and Market Definition
- 1.2 Scope of the Study
2 RESEARCH METHODOLOGY
3 EXECUTIVE SUMMARY
4 MARKET LANDSCAPE
- 4.1 Market Overview
- 4.2 Market Drivers
- 4.2.1 Emergence of sustainable and recyclable materials
- 4.2.2 Expansion of e-commerce and cross-border trade flows
- 4.2.3 Growth in food-grade and pharma bulk logistics
- 4.2.4 On-site packaging automation adoption
- 4.2.5 Reusable packaging pool business models
- 4.2.6 Hydrogen-supply chain demand for composite IBCs
- 4.3 Market Restraints
- 4.3.1 Volatile resin and steel prices
- 4.3.2 Tightening global environmental regulations
- 4.3.3 PFAS / micro-plastic bans on barrier coatings
- 4.3.4 Near-shoring lowering long-haul packaging volumes
- 4.4 Industry Value Chain Analysis
- 4.5 Regulatory Landscape
- 4.6 Technological Outlook
- 4.7 Porter's Five Forces Analysis
- 4.7.1 Bargaining Power of Suppliers
- 4.7.2 Bargaining Power of Buyers
- 4.7.3 Threat of New Entrants
- 4.7.4 Threat of Substitutes
- 4.7.5 Intensity of Competitive Rivalry
- 4.8 The Impact of Macroeconomic Factors on the Market
5 MARKET SIZE AND GROWTH FORECASTS (VALUE)
- 5.1 By Product
- 5.1.1 Intermediate Bulk Containers (IBCs)
- 5.1.2 Drums
- 5.1.3 Sacks
- 5.1.4 Pails
- 5.1.5 Other Products
- 5.2 By Material
- 5.2.1 Plastics
- 5.2.2 Metal
- 5.2.3 Paper and Fiber-based
- 5.2.4 Other Materials
- 5.3 By End-user Industry
- 5.3.1 Chemicals and Pharmaceuticals
- 5.3.2 Food and Beverage
- 5.3.3 Automotive
- 5.3.4 Oil, Gas and Petrochemicals
- 5.3.5 Building and Construction
- 5.3.6 Other End-user Industries
- 5.4 By Packaging Capacity
- 5.4.1 <= 50 L
- 5.4.2 51 - 500 L
- 5.4.3 501 - 1,000 L
- 5.4.4 1,001 - 2,000 L
- 5.4.5 > 2,000 L
- 5.5 By Geography
- 5.5.1 North America
- 5.5.1.1 United States
- 5.5.1.2 Canada
- 5.5.1.3 Mexico
- 5.5.2 South America
- 5.5.2.1 Brazil
- 5.5.2.2 Argentina
- 5.5.2.3 Rest of South America
- 5.5.3 Europe
- 5.5.3.1 Germany
- 5.5.3.2 United Kingdom
- 5.5.3.3 France
- 5.5.3.4 Spain
- 5.5.3.5 Italy
- 5.5.3.6 Rest of Europe
- 5.5.4 Asia-Pacific
- 5.5.4.1 China
- 5.5.4.2 Japan
- 5.5.4.3 India
- 5.5.4.4 Australia
- 5.5.4.5 South Korea
- 5.5.4.6 Rest of Asia-Pacific
- 5.5.5 Middle East and Africa
- 5.5.5.1 Middle East
- 5.5.5.1.1 Saudi Arabia
- 5.5.5.1.2 United Arab Emirates
- 5.5.5.1.3 Turkey
- 5.5.5.1.4 Rest of Middle East
- 5.5.5.2 Africa
- 5.5.5.2.1 South Africa
- 5.5.5.2.2 Kenya
- 5.5.5.2.3 Rest of Africa
- 5.5.5.1 Middle East
- 5.5.1 North America
6 COMPETITIVE LANDSCAPE
- 6.1 Market Concentration
- 6.2 Strategic Moves
- 6.3 Market Share Analysis
- 6.4 Company Profiles (includes Global level Overview, Market level overview, Core Segments, Financials as available, Strategic Information, Market Rank/Share for key companies, Products and Services, and Recent Developments)
- 6.4.1 Greif, Inc.
- 6.4.2 Mauser Packaging Solutions Holding Company
- 6.4.3 Mondi plc
- 6.4.4 Smurfit WestRock
- 6.4.5 Amcor plc
- 6.4.6 International Paper Company
- 6.4.7 Packaging Corporation of America
- 6.4.8 Schutz GmbH & Co. KGaA
- 6.4.9 WERIT Kunststoffwerke W. Schneider GmbH & Co. KG
- 6.4.10 Tank Holding Corp.
- 6.4.11 Visy Industries Holdings Pty Ltd
- 6.4.12 Pact Group Holdings Ltd
- 6.4.13 Brambles Limited (CHEP)
- 6.4.14 Global-Pak, Inc.
- 6.4.15 Nefab AB
- 6.4.16 Snyder Industries, LLC
- 6.4.17 Myers Container, LLC
- 6.4.18 Veritiv Corporation
- 6.4.19 Snyder Industries, Inc.
- 6.4.20 Pyramid Technoplast Ltd
7 MARKET OPPORTUNITIES AND FUTURE OUTLOOK
- 7.1 White-space and Unmet-need Assessment
 工业包装市场分析及预测(至2035年):依类型、产品类型、服务、技术、材料类型、应用、製程、最终用户、功能划分
 2026年全球工业包装市场报告
 工业包装市场规模、份额和趋势分析报告:按材料、产品、最终用途、地区和细分市场预测(2026-2033 年)
 印尼工业包装:市场占有率分析、产业趋势与统计、成长预测(2026-2031)
 工业包装市场规模、份额和成长分析(按产品类型、材料类型(塑胶、金属(钢))、最终用途产业、应用和地区划分)-2026-2033年产业预测
 日本工业包装市场报告:按产品、材料、应用和地区划分(2026-2034年)
 全球桶装包装市场:预测至2032年-按材料类型、桶型、容量、服务类型、最终用户和地区分類的分析
 工业包装市场:2025-2030年未来预测
 工业包装市场:依产品类型、材料类型、类别、应用和地区
 工业包装市场-全球产业规模、份额、趋势、机会和预测(按包装类型、应用、地区和竞争细分,2020-2030 年)