


 |
市场调查报告书
商品编码
1907317
铌:市场占有率分析、产业趋势与统计、成长预测(2026-2031)Niobium - Market Share Analysis, Industry Trends & Statistics, Growth Forecasts (2026 - 2031) |
||||||
※ 本网页内容可能与最新版本有所差异。详细情况请与我们联繫。
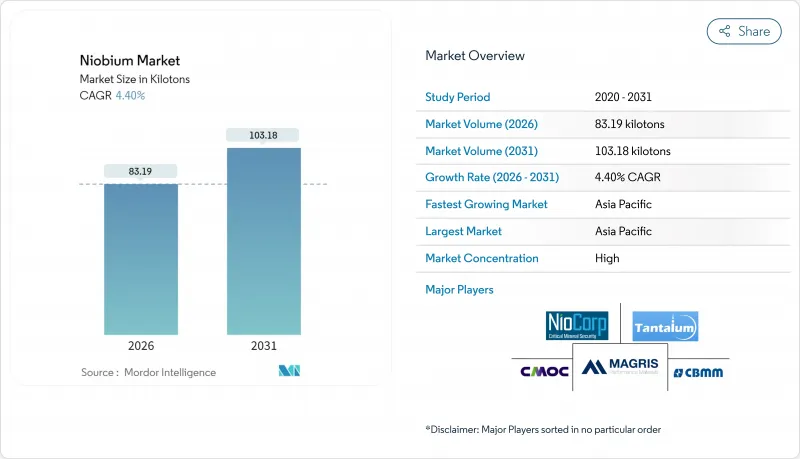
预计铌市场将从 2025 年的 79.68 千吨成长到 2026 年的 83.19 千吨,到 2031 年将达到 103.18 千吨,2026 年至 2031 年的复合年增长率为 4.4%。
建筑和汽车製造业对高强度低合金钢(HSLA)的持续需求支撑着此扩张,因为添加微量铌可将抗拉强度提高高达30%,同时保持良好的焊接性能。以巴西为中心的集中供应基地将价格稳定在每公斤45至50美元,这有利于签订长期供应协议,从而降低大型基础设施计划的采购风险。市场对添加铌的电池负极材料、量子级超导体和耐氢管钢的兴趣日益浓厚,促进了终端市场的多元化,使铌市场免受钢铁週期放缓的影响。加拿大和美国的供应多元化措施旨在降低巴西主导地位带来的地缘政治风险,并加强国内关键矿产战略。
全球铌市场趋势与洞察
建筑业中高强度低合金钢(HSLA钢)的应用日益广泛
随着建筑规范的修订,为提升抗震性能,建筑材料对强度重量比提出了更高的要求。含铌量为0.02%至0.05%的高强度低合金钢(HSLA)相比传统钢材,强度可提高20%至30%,同时还能降低用量。中国2024年抗震规范明确规定高楼必须使用铌微合金钢,印尼和墨西哥也考虑类似的修订。工程公司正将铌材规范纳入其长期基础设施规划,因为儘管材料成本会增加5%至8%,但结构钢的使用量可减少最多20%。随着亚洲和非洲新一轮都市化进程的加速,建筑需求占铌总消费量的49%以上,进一步巩固了铌市场的稳定基础。监管力度的加大将使高强度低合金钢(HSLA)的普及应用在十年内成为不可逆转的趋势。
促进汽车和造船产业的轻量化发展
更严格的燃油经济性目标和船舶排放法规正在推动积极的轻量化策略。铌掺杂的先进高强度钢目前已应用于超过60%的高阶车型,并且随着原始设备製造商(OEM)在提升碰撞安全性和增加电池重量之间寻求平衡,这种钢材在量产车型平台上的应用也日益广泛。在造船领域,添加铌的低温高强度低合金钢(HSLA)能够满足液化天然气(LNG)运输船在-162°C低温下的断裂韧性要求,从而支持韩国和卡达的船队更新。商用卡车和铁路车辆製造商也倾向于采用铌增强樑和底盘零件,在无需进行重大设计改造的情况下提高负载效率。这种跨产业的应用週期使铌市场能够充分利用多个产业的协同效应,而不是仅仅依赖单一领域。
急性暴露引起的健康与环境问题
铌矿通常与钍和铀共生,因此开采过程中需要严格的辐射监测。在巴西,监管机构现在要求在许可证续约前进行地下水基准调查和同位素测绘,这使得合规成本增加了15%至25%。围绕原住民居住地区的争议进一步延缓了新采矿许可证的审批,加拿大「火环」地区也面临类似的社区参与挑战。虽然尚未有工业暴露水准下出现慢性中毒病例的报告,但公众对风险的认知可能会影响资本投资决策并限制供应弹性。
细分市场分析
碳酸盐矿床在2025年占全球铌供应量的95.85%,预计到2031年将以4.43%的复合年增长率成长,这将支撑铌市场的成长动能。巴西阿拉沙矿的特点是剥采比低、矿石粗粒烧绿石,且选矿製程简单,能够以具竞争力的营运成本生产铌铁。
目前,勘探投资主要集中在格陵兰岛和坦尚尼亚探勘的碳酸岩矿床,但尚未发现像阿拉克萨矿场那样规模的矿藏,延续了现有供应集中的趋势。可预测的矿物成分和数十年来累积的冶金技术确保了稳定的加工量,为长期供应合约奠定了基础,并增强了铌市场的价格稳定性。日本和德国的战略储备商继续优先采购碳酸盐岩原料,因为其杂质组成稳定,有助于简化合金厂的品管。
2025年,铌铁的出货量占比高达92.75%,预计到2031年将以4.35%的复合年增长率成长,与全球粗钢需求趋势相符。通常含铌量为65%的中间合金可无缝整合到碱性氧气转炉熔炼製程中,使熔炼车间技术人员能够精确控制晶粒尺寸和析出速率。儘管氧化铌目前市场份额较小,但由于电池和介电陶瓷需求的成长,其成长速度正在加快。 CBMM的专用氧化物生产线计画在2030年实现年产4万吨的目标。
真空金属和特殊合金粉末为航太发动机、核磁共振磁铁和量子装置提供原料,儘管产量较低,但单价仍然很高。随着积层製造技术的日益普及,预计对球形C-103粉末的需求将超过板材和棒材,使加工商的收入来源更加多元化。因此,虽然铌铁仍将是主要产品,但高纯度衍生将推动整个铌铁产业的利润率成长。
本铌报告依矿床类型(碳酸盐岩及相关矿床、铌钽铁矿)、产品类型(铌铁、氧化铌等)、应用(铌铁、超导磁体和电容器等)、终端用户产业(建筑、汽车和南美、航太和国防等)以及北美地区(亚太地区、北美地区、欧洲地区、中东地区和国防等)。
区域分析
预计亚太地区将继续占据铌市场最大的区域份额,到 2025 年将占全球产量的 60.10%,到 2031 年将以 4.71% 的复合年增长率成长。中国庞大的钢铁产量和不断发展的抗震标准将支撑巨大的需求,而探索铌硅合金的航太计画正在扩大其在下一代推进系统中的应用。
北美地区的成长取决于两大主题:交通工具的脱碳以及国防主导的高超音速技术发展。美国环保署(EPA)更严格的燃油经济性法规和各州零排放强制令正促使汽车製造商(OEM)采用铌强化钢来减轻车辆重量,并平衡日益增长的电池系统重量。儘管加拿大尼奥贝克矿的产量约占全球总产量的8%至10%,美国决策者仍将透过埃尔克溪矿实现供应来源多元化视为一项战略重点,以减少对巴西进口的依赖。
在欧洲,氢气管道的扩建(需要铌微合金化的API X70级钢材)正在推动净零排放目标的实现。在汽车产业,严格的二氧化碳排放法规促使高抗拉强度钢在冲压领域广泛应用。在德国的汽车产业丛集中,铌铁的添加使得轻量化素车组装成为可能。同时,挪威的矿产策略将铌列为国内探勘的优先资源,并修订了相关许可法规。该地区也支持为欧洲核子研究中心(CERN)加速器升级而进行的铌超导体基础研究,从而在更广泛的铌市场中保持着以研究为导向的铌超导体基础研究,从而在更广泛的铌市场中保持着以研究主导的铌产业地位。
其他福利:
- Excel格式的市场预测(ME)表
- 3个月的分析师支持
目录
第一章 引言
- 研究假设和市场定义
- 调查范围
第二章调查方法
第三章执行摘要
第四章 市场情势
- 市场概览
- 市场驱动因素
- 建筑业中高强度低合金钢(HSLA钢)的应用日益广泛
- 促进汽车和造船产业的轻量化发展
- 氢气和液化天然气运输管道的建设
- 扩大铌掺杂锂离子电池的生产规模
- 用于航太工业的增材製造铌合金
- 市场限制
- 巴西的供应集中度与定价权
- 急性暴露引起的健康与环境问题
- ESG可追溯性成本
- 波特五力模型
- 供应商的议价能力
- 买方的议价能力
- 新进入者的威胁
- 替代品的威胁
- 竞争程度
- 技术概述/生产分析
- 价格趋势
第五章 市场规模与成长预测
- 按发生状态
- 碳酸岩及相关矿物
- 铌钽铁矿
- 按类型
- 铌铁
- 氧化铌市场
- 铌市场金属
- 用于真空的铌合金
- 透过使用
- 钢
- 超合金
- 超导磁铁和电容器
- 电池
- 其他用途
- 按最终用户行业划分
- 建造
- 汽车和造船
- 航太/国防
- 石油和天然气
- 其他最终用户
- 按地区
- 亚太地区
- 中国
- 印度
- 日本
- 韩国
- 亚太其他地区
- 北美洲
- 美国
- 加拿大
- 墨西哥
- 欧洲
- 德国
- 英国
- 俄罗斯
- 义大利
- 其他欧洲地区
- 南美洲
- 巴西
- 阿根廷
- 南美洲其他地区
- 中东和非洲
- 沙乌地阿拉伯
- 南非
- 其他中东和非洲地区
- 亚太地区
第六章 竞争情势
- 市场集中度
- 策略趋势
- 市占率(%)/排名分析
- 公司简介
- Admat Inc.
- American Elements
- Australian Strategic Materials Ltd
- CBMM
- Changsha South Tantalum Niobium Co. Ltd
- CMOC
- Grandview Materials
- Magris Performance Materials
- NioCorp Development Ltd
- Titanex GmbH
第七章 市场机会与未来展望
The Niobium market is expected to grow from 79.68 kilotons in 2025 to 83.19 kilotons in 2026 and is forecast to reach 103.18 kilotons by 2031 at 4.4% CAGR over 2026-2031.
Sustained demand for high-strength low-alloy (HSLA) steel in construction and automotive manufacturing anchors this expansion because micro-additions of the element raise tensile strength by up to 30% while preserving weldability. Price stability between USD 45-50 per kilogram, maintained by a concentrated supply base led by Brazil, encourages long-term offtake agreements that lower procurement risk for large infrastructure projects. Rising interest in niobium-doped battery anodes, quantum-grade superconductors, and hydrogen-ready pipeline steels is broadening end-market diversity, cushioning the niobium market against potential slowdowns in the steel cycle. Supply-side diversification efforts in Canada and the United States aim to mitigate geopolitical risk tied to Brazil's dominance and to reinforce domestic critical-minerals strategies.
Global Niobium Market Trends and Insights
Rising HSLA Steel Adoption in Construction
Building-code revisions now mandate higher strength-to-weight ratios for seismic resilience, and HSLA steels containing 0.02-0.05% niobium deliver 20-30% strength gains over conventional grades while cutting tonnage requirements. China's 2024 seismic standards explicitly cite niobium-microalloyed steels for high-rise projects, and similar updates are under review in Indonesia and Mexico. Because material cost premiums remain 5-8% yet structural steel volumes fall by up to 20%, engineering firms are embedding niobium specifications across long-term infrastructure plans. As new urbanization waves in Asia and Africa accelerate, construction demand anchors more than 49% of overall niobium consumption, reinforcing a stable baseline for the niobium market. Regulatory momentum makes HSLA adoption essentially irreversible within a decade horizon.
Lightweighting Push in Automotive and Shipbuilding
Stricter fuel-economy targets and maritime emission limits foster aggressive mass-reduction strategies. Advanced high-strength steels incorporating niobium now appear in over 60% of premium-segment vehicles and are migrating into mass-market platforms as OEMs balance crashworthiness with battery-induced weight penalties. In shipbuilding, cryogenic-grade HSLA plate with niobium additions satisfies LNG-carrier requirements for fracture toughness at -162 °C, supporting fleet renewal across South Korea and Qatar. Commercial trucking and railcar builders likewise gravitate toward niobium-enhanced beam and chassis components, improving payload efficiency without major design overhauls. The cross-modal adoption cycle positions the niobium market for multi-industry synergies rather than single-sector dependency.
Acute-exposure Health and Environmental Concerns
Niobium ores often coexist with thorium and uranium, necessitating strict radiological surveillance during mining. Regulatory authorities in Brazil now require groundwater baselines and isotopic mapping before license renewals, adding 15-25% to compliance costs. Indigenous-territory debates further delay greenfield approvals, and similar community-engagement hurdles appear in Canada's Ring of Fire region. While no chronic-toxicity cases have been documented at industrial exposure levels, public perception risks can influence capex decisions, tempering supply-side agility.
Other drivers and restraints analyzed in the detailed report include:
- Pipeline Build-out for Hydrogen and LNG Transmission
- Niobium-doped Li-ion Batteries Scale-up
- ESG Traceability Compliance Costs
For complete list of drivers and restraints, kindly check the Table Of Contents.
Segment Analysis
Carbonatite-hosted deposits held 95.85% of the 2025 global supply and are set to expand at a 4.43% CAGR through 2031, underpinning the niobium market size growth trajectory. Brazil's Araxa mine exemplifies low-strip ratios and coarse-grained pyrochlore that simplify beneficiation, yielding ferroniobium at competitive opex levels.
Exploration spending now targets undercover carbonatites in Greenland and Tanzania; however, no discovery approaches Araxa's scale, reinforcing existing supply concentration. Predictable mineralogy and decades of metallurgical know-how translate into steady throughput, anchoring long-term delivery contracts and reinforcing the niobium market's pricing stability. Strategic stockpilers in Japan and Germany continue to favor carbonatite feed due to consistent impurity profiles that streamline alloy-shop quality control.
Ferroniobium accounted for 92.75% of 2025 shipments and is forecast to post a 4.35% CAGR through 2031, mirroring global crude-steel demand patterns. The master alloy, usually containing 65% niobium, integrates seamlessly into basic-oxygen furnace practices, enabling melt-shop engineers to fine-tune grain size and precipitation kinetics. Niobium oxide, while representing a minor share today, is pacing up on the back of battery and dielectric-ceramic uptake; CBMM's dedicated oxide line targets 40,000 tons annual capacity by 2030.
Vacuum-grade metal and specialty alloy powders feed aerospace engines, MRI magnets, and quantum devices, commanding premium unit values in spite of small tonnages. As additive manufacturing spreads, demand for spherical C-103 powder is likely to outpace bulk plate and bar, diversifying revenue streams for converters. Consequently, ferroniobium will remain the volume anchor, but high-purity derivatives will shape margin dynamics across the niobium industry.
The Niobium Report is Segmented by Occurrence (Carbonatites and Associates and Columbite-Tantalite), Type (Ferroniobium, Niobium Oxide, and More), Application (Steel, Super-Alloys, Superconducting Magnets and Capacitors, and More), End-User Industry (Construction, Automotive and Shipbuilding, Aerospace and Defense, and More), and Geography (Asia-Pacific, North America, Europe, South America, and Middle-East and Africa).
Geography Analysis
Asia-Pacific held 60.10% of 2025 global volume and is forecast to grow at a 4.71% CAGR to 2031, securing the largest regional slice of the niobium market. China's gargantuan steel output and evolving seismic codes sustain bulk demand, while aerospace programs exploring niobium-silicon alloys extend uptake into next-generation propulsion systems.
North America's growth hinges on dual themes: decarbonization of transport fleets and defense-driven hypersonic development. Tightened EPA fuel-economy rules and state-level zero-emission mandates push OEMs toward niobium-enriched steels for chassis mass reduction, counterbalancing heavier battery systems. Canada's Niobec mine supplies roughly 8-10% of global output, but U.S. policymakers continue to view diversification via Elk Creek as a strategic imperative to curb reliance on Brazilian imports.
Europe targets net-zero targets by expanding hydrogen pipelines that demand niobium-microalloyed API X70 grades, and stringent vehicle CO2 limits sustain high-strength steel penetration in automotive stamping. Germany's auto clusters integrate ferroniobium additions to deliver lighter body-in-white assemblies, while Norway's mineral strategy lists niobium as a priority for domestic exploration under revised permitting rules. The region also supports fundamental research into niobium-tin superconductors for CERN's accelerator upgrades, sustaining a research-driven niche inside the broader niobium market.
- Admat Inc.
- American Elements
- Australian Strategic Materials Ltd
- CBMM
- Changsha South Tantalum Niobium Co. Ltd
- CMOC
- Grandview Materials
- Magris Performance Materials
- NioCorp Development Ltd
- Titanex GmbH
Additional Benefits:
- The market estimate (ME) sheet in Excel format
- 3 months of analyst support
TABLE OF CONTENTS
1 Introduction
- 1.1 Study Assumptions and Market Definition
- 1.2 Scope of the Study
2 Research Methodology
3 Executive Summary
4 Market Landscape
- 4.1 Market Overview
- 4.2 Market Drivers
- 4.2.1 Rising HSLA Steel Adoption in Construction
- 4.2.2 Lightweighting Push in Automotive and Shipbuilding
- 4.2.3 Pipeline Build-Out for Hydrogen and LNG Transmission
- 4.2.4 Niobium-Doped Li-Ion Batteries Scale-Up
- 4.2.5 Additive-Manufactured Nb Alloys for Aerospace
- 4.3 Market Restraints
- 4.3.1 Supply Concentration in Brazil and Pricing Power
- 4.3.2 Acute-Exposure Health and Environmental Concerns
- 4.3.3 ESG Traceability Compliance Costs
- 4.4 Porter's Five Forces
- 4.4.1 Bargaining Power of Suppliers
- 4.4.2 Bargaining Power of Buyers
- 4.4.3 Threat of New Entrants
- 4.4.4 Threat of Substitutes
- 4.4.5 Degree of Competition
- 4.5 Technological Snapshot/ Production Analysis
- 4.6 Price Trends
5 Market Size and Growth Forecasts (Volume)
- 5.1 By Occurrence
- 5.1.1 Carbonatites and Associates
- 5.1.2 Columbite-Tantalite
- 5.2 By Type
- 5.2.1 Ferroniobium
- 5.2.2 Niobium Oxide
- 5.2.3 Niobium Metal
- 5.2.4 Vacuum-grade Nb Alloys
- 5.3 By Application
- 5.3.1 Steel
- 5.3.2 Super-alloys
- 5.3.3 Superconducting Magnets and Capacitors
- 5.3.4 Batteries
- 5.3.5 Other Applications
- 5.4 By End-user Industry
- 5.4.1 Construction
- 5.4.2 Automotive and Shipbuilding
- 5.4.3 Aerospace and Defense
- 5.4.4 Oil and Gas
- 5.4.5 Other End-users
- 5.5 By Geography
- 5.5.1 Asia-Pacific
- 5.5.1.1 China
- 5.5.1.2 India
- 5.5.1.3 Japan
- 5.5.1.4 South Korea
- 5.5.1.5 Rest of Asia-Pacific
- 5.5.2 North America
- 5.5.2.1 United States
- 5.5.2.2 Canada
- 5.5.2.3 Mexico
- 5.5.3 Europe
- 5.5.3.1 Germany
- 5.5.3.2 United Kingdom
- 5.5.3.3 Russia
- 5.5.3.4 Italy
- 5.5.3.5 Rest of Europe
- 5.5.4 South America
- 5.5.4.1 Brazil
- 5.5.4.2 Argentina
- 5.5.4.3 Rest of South America
- 5.5.5 Middle-East and Africa
- 5.5.5.1 Saudi Arabia
- 5.5.5.2 South Africa
- 5.5.5.3 Rest of Middle-East and Africa
- 5.5.1 Asia-Pacific
6 Competitive Landscape
- 6.1 Market Concentration
- 6.2 Strategic Moves
- 6.3 Market Share (%)/Ranking Analysis
- 6.4 Company Profiles (includes Global-level Overview, Market-level Overview, Core Segments, Financials as available, Strategic Information, Market Rank/Share, Products and Services, Recent Developments)
- 6.4.1 Admat Inc.
- 6.4.2 American Elements
- 6.4.3 Australian Strategic Materials Ltd
- 6.4.4 CBMM
- 6.4.5 Changsha South Tantalum Niobium Co. Ltd
- 6.4.6 CMOC
- 6.4.7 Grandview Materials
- 6.4.8 Magris Performance Materials
- 6.4.9 NioCorp Development Ltd
- 6.4.10 Titanex GmbH
7 Market Opportunities and Future Outlook
- 7.1 White-space and Unmet-need Assessment
 五氧化二铌市场:2026-2032年全球市场预测(依应用、终端用户产业、等级、製造流程、形态及粒径划分)
 铌棒市场规模、份额和成长分析:按产品类型、形状和规格、应用领域、终端用户产业和地区划分-2026-2033年产业预测
 四甲基庚二酮铌市场规模、份额和成长分析:按产品等级/纯度、应用/製程技术、最终用途、最终用途产业和地区划分 - 产业预测,2026-2033年
 2026-2034年全球五氧化二铌市场规模、份额、趋势和成长分析报告铌及铌合金市场按类型、应用、终端用户产业、形态、等级及生产方法划分-2026-2032年全球预测
 五氧化二铌市场规模、份额及成长分析(按等级、应用和地区)-产业预测,2025-2032
 全球五氧化二铌市场
 2032 年铌市场预测:按类型、纯度等级、通路、应用、最终用户和地区进行的全球分析
 五氧化二铌-市场占有率分析、产业趋势与统计、成长预测(2025-2030)
 全球铌市场规模研究,按类型(铌铁、铌氧化物、铌金属)、按应用(结构钢、汽车钢、管道钢、不銹钢等)和区域预测 2022-2032