


 |
市场调查报告书
商品编码
1910446
预拌混凝土:市场占有率分析、产业趋势与统计、成长预测(2026-2031)Ready Mix Concrete - Market Share Analysis, Industry Trends & Statistics, Growth Forecasts (2026 - 2031) |
||||||
※ 本网页内容可能与最新版本有所差异。详细情况请与我们联繫。
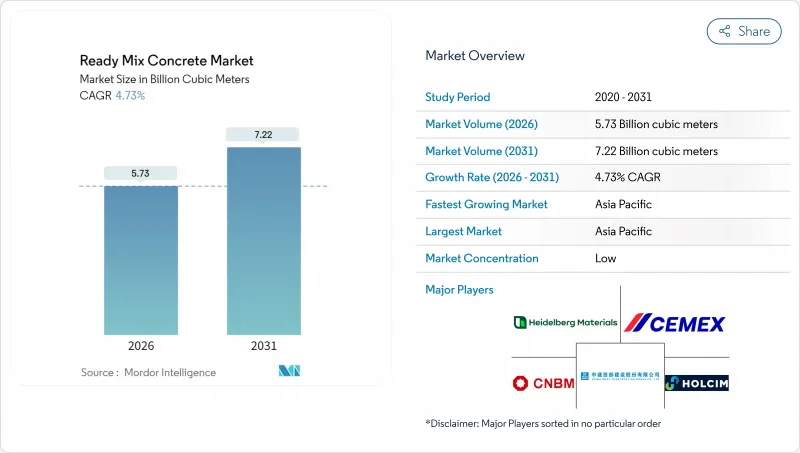
2025年预拌混凝土市场价值为54.7亿立方米,预计到2031年将达到72.2亿立方米,高于2026年的57.3亿立方米。
预计在预测期(2026-2031 年)内,复合年增长率将达到 4.73%。
亚太和北美地区强大的公共部门管线系统支撑着这项销售成长。同时,数位化调度平台和远端资讯处理技术有助于提高车辆效率,减少交付波动,并提升供应商的利润率。政府对基础设施支出的合规要求促使人们更加关注低碳混合料设计,以水泥熟料取代水泥添加剂。儘管自2019年以来原物料价格上涨挤压了生产商的利润空间,但那些对骨材和高峰会进行后向一体化并实施即时品质监控的供应商仍保持了较为健康的利润。同时,Quikrete-Summit 和 CRH 收购区域资产等併购案例表明,规模经济和地理密度仍然是预拌混凝土市场的重要因素。
全球预拌混凝土市场趋势与洞察
快速的都市化和住宅需求
印度、印尼和越南的城市人口快速成长,持续造成大规模的住宅供不应求。开发商青睐异地混凝土,因为它强度均匀、符合不断变化的建筑规范,计划更短。儘管中国房地产行业存在混凝土供应过剩的情况,但工厂建设和物流中心仍消耗大量混凝土,从而缓解了区域性波动。预计这些因素将在未来十年内持续推动预拌混凝土市场的需求成长。
大型政府基础建设项目
多年预算承诺使生产商能够更清晰地了解情况,从而核准新增产能。美国已拨款2,140亿美元用于2024年的交通基础建设,印度的国家基础设施计画涵盖7,400个计划,从高速公路到可再生能源发电。印尼和澳洲的类似计画旨在保障长期需求,并确保即使在住宅市场低迷时期,工厂运转率也能保持在盈亏平衡点以上。
原物料价格波动
自2019年以来,水泥价格上涨了38%,骨材上涨了31%,但由于合约结构压缩了利润空间,成本转嫁延迟。地缘政治和能源衝击以及卡车短缺加剧了成本的不确定性,迫使生产商实现采购多元化并采用指数挂钩定价。然而,客户越来越倾向于固定价格合同,将风险转移给供应商,从而限制了预拌混凝土市场的成长。
细分市场分析
到2025年,运输搅拌混凝土将占预拌混凝土市场72.65%的份额,主要得益于大规模的运输车队、成熟的订购系统和具竞争力的交付成本。另一方面,现场搅拌混凝土虽然在销售上占比较小,但由于建筑商面临长途运输和现场浇筑时间的限制,预计其年复合成长率将达到5.66%。在交通拥堵导致工期紧张的拉丁美洲都市区,现场搅拌混凝土的应用正在增加。集中搅拌混凝土仍然是那些需要在尖峰时段保持混凝土均匀性的项目(例如水坝和核能计划)的首选,但一旦区域性大型企划进入竞标阶段,其市场份额的增长幅度将非常有限。
由于高性能外加剂的广泛应用,可使混凝土坍落度保持长达三小时,预计到2030年,收缩混凝土市场将持续成长。生产商正投资建造双滚筒收缩混凝土搅拌站和运输搅拌站,以满足不断变化的市场需求,同时最大限度地减少停机时间。
预拌混凝土市场报告按产品类型(集中搅拌、收缩搅拌、运输搅拌)、最终用途领域(商业、工业及公共、基础设施、住宅)和地区(亚太、北美、欧洲、南美、中东和非洲)进行细分。市场预测以体积(立方米)为单位。
区域分析
预计亚太地区将在2025年占据预拌混凝土市场76.55%的份额,并在2031年之前以5.06%的复合年增长率成长。印度耗资1.4兆美元的国家基础设施计划,包括高速公路、专用货运走廊和5000万套住宅,确保了未来多年的市场需求。印尼4,120亿美元的交通网络发展计画、越南製造业的蓬勃发展以及中国持续的公共工程支出,正在抵消当地住宅市场的疲软。大型生产商正在德里-孟买高速公路等经济走廊沿线增设工厂,以缩短运输距离并实现碳排放目标。
随着联邦政府资助的桥樑建设、港口疏浚和电动车充电走廊建设计画的推进,北美预计将迎来稳步成长。美国预计2023年投资约4亿立方码(约640亿美元),预计2025-2026年将维持中等个位数的成长。加拿大正在大力发展城市交通,而墨西哥的近岸外包趋势正在推动边境沿线工业园区的发展。
在欧洲,能源衝击导致2024年产量下降,但政策奖励策略,特别是来自维修工程和陆域风电平台的刺激,支撑了基准需求。欧洲排放交易机制(CBAM)下更高的碳价正在加速向低水泥熟料混凝土的转型,使具有环保优势的供应商能够在建设产业整体萎缩的情况下获得市场份额。东欧市场正利用欧盟凝聚基金升级铁路和污水处理设施,提高长期吨位潜力,并为全部区域的预拌混凝土市场注入新的动力。
其他福利:
- Excel格式的市场预测(ME)表
- 3个月的分析师支持
目录
第一章 引言
- 研究假设和市场定义
- 调查范围
第二章调查方法
第三章执行摘要
第四章 市场情势
- 市场概览
- 市场驱动因素
- 快速的都市化和住宅需求
- 大型政府基础建设项目
- 偏好品管的异地配料
- 从环境角度促进材料效率
- 利用数位化调度和远端资讯处理优化配送
- 市场限制
- 原物料价格波动
- 工期短/物流风险
- 现场容积式搅拌机的普及
- 价值链分析
- 波特五力模型
- 供应商的议价能力
- 买方的议价能力
- 替代品的威胁
- 新进入者的威胁
- 竞争对手之间的竞争
第五章 市场规模与成长预测
- 依产品类型
- 中央混合
- 收缩混合
- 混合交通
- 按最终用途
- 商业的
- 工业和公共设施
- 基础设施
- 住宅
- 按地区
- 亚太地区
- 中国
- 印度
- 日本
- 韩国
- 澳洲
- 印尼
- 越南
- 亚太其他地区
- 北美洲
- 美国
- 加拿大
- 墨西哥
- 欧洲
- 德国
- 法国
- 英国
- 义大利
- 西班牙
- 俄罗斯
- 其他欧洲地区
- 南美洲
- 巴西
- 阿根廷
- 其他南美洲
- 中东和非洲
- 沙乌地阿拉伯
- 阿拉伯聯合大公国
- 其他中东和非洲地区
- 亚太地区
第六章 竞争情势
- 市场集中度
- 策略趋势
- 市占率(%)/排名分析
- 公司简介
- Adani Group
- BBMG Corporation
- Boral Limited
- Buzzi SpA
- CEMEX SAB de CV
- China National Building Material Group Corporation
- China West Construction Group
- CRH
- Foshan Huijiang Concrete Co., Ltd.
- Heidelberg Materials
- Holcim
- Martin Marietta Materials
- OYAK Cimento
- SAMPYO Group
- Titan Cement
- UltraTech Cement Ltd.
- Vicat SA
- Votorantim Cimentos
第七章 市场机会与未来展望
第八章:执行长面临的关键策略挑战
The Ready Mix Concrete Market was valued at 5.47 billion cubic meters in 2025 and estimated to grow from 5.73 billion cubic meters in 2026 to reach 7.22 billion cubic meters by 2031, at a CAGR of 4.73% during the forecast period (2026-2031).
Robust public-sector pipelines in Asia-Pacific and North America underpin this volume growth, while digital dispatch platforms and telematics improve fleet productivity, lower delivery variability, and strengthen supplier margins. Low-carbon mix designs that replace clinker with supplementary cementitious materials gain traction because governments attach compliance requirements to infrastructure spending. Raw-material price spikes since 2019 have narrowed producer spreads, yet suppliers that backward-integrate into aggregates and cement-and adopt real-time quality monitoring-sustain healthier earnings. At the same time, mergers such as Quikrete-Summit and CRH's regional asset buys indicate that scale economies and geographic density remain critical levers in the ready mix concrete market.
Global Ready Mix Concrete Market Trends and Insights
Rapid Urbanization and Housing Demand
Fast-growing urban populations in India, Indonesia, and Vietnam continue to translate into large housing backlogs. Developers favor off-site batched concrete for its strength uniformity, compliance with evolving building codes, and shorter project cycles. Despite an overhang in China's property segment, factory construction and logistics hubs still consume sizeable volumes, cushioning regional volatility. Combined, these forces extend the demand runway for the ready mix concrete market well into the next decade.
Government Mega-Infrastructure Pipelines
Multi-year budget commitments provide visibility that allows producers to green-light capacity additions. The United States allocated USD 214 billion for transportation construction in 2024, while India's National Infrastructure Pipeline covers 7,400 projects ranging from highways to renewable power. Similar agendas in Indonesia and Australia lock in long-cycle demand, ensuring that plant utilizations remain above breakeven even during residential downturns.
Raw-Material Price Volatility
Cement prices have risen 38% and aggregates 31% since 2019, squeezing spreads when contract structures delay pass-through. Geopolitical energy shocks and trucking shortages amplify cost unpredictability, compelling producers to diversify sourcing and adopt index-linked pricing. Customers, however, increasingly demand fixed-price contracts, transferring risk back to suppliers and tempering growth in the ready mix concrete market.
Other drivers and restraints analyzed in the detailed report include:
- Preference for Quality-Controlled Off-Site Batching
- Environmental Push for Material Efficiency
- Short Workable Life and Logistics Risk
For complete list of drivers and restraints, kindly check the Table Of Contents.
Segment Analysis
Transit mixed concrete accounted for 72.65% of the ready mix concrete market in 2025, supported by vast truck fleets, established orders, and competitive delivered costs. Shrink mixed concrete, while only a fraction of volume, is projected to post a 5.66% CAGR as builders tackle longer transport distances and tighter on-site pouring windows. Adoption is rising in Latin American metros where traffic congestion narrows scheduling buffers. Central mixed concrete remains preferred for dams and nuclear projects that specify peak uniformity, though its share inches forward only when regional megaprojects come to tender.
The ready mix concrete market size attributed to shrink mixed solutions is expected to grow by 2030, supported by performance admixtures that maintain slump for up to three hours. Producers invest in dual-purpose drum plants capable of both shrink and transit mixes to serve evolving demand with minimal downtime.
The Ready Mix Concrete Market Report is Segmented by Product Type (Central Mixed, Shrink Mixed, and Transit Mixed), End-Use Sector (Commercial, Industrial and Institutional, Infrastructure, and Residential), and Geography (Asia-Pacific, North America, Europe, South America, and Middle-East and Africa). The Market Forecasts are Provided in Terms of Volume (Cubic Meters).
Geography Analysis
Asia-Pacific dominates the ready mix concrete market with 76.55% share in 2025 and a forecast 5.06% CAGR to 2031. India's USD 1.4 trillion National Infrastructure Pipeline encompasses highways, dedicated freight corridors, and 50 million affordable homes, ensuring multi-year demand visibility. Indonesia's USD 412 billion connectivity blueprint, Vietnam's manufacturing boom, and continued Chinese public-works spending offset softness in the mainland residential sector. High-volume producers install additional plants along economic corridors such as the Delhi-Mumbai Expressway to cut haulage distances and meet carbon targets.
North America contributes stable growth as federal funding lines disburse for bridges, port dredging, and electric vehicle charging corridors. The United States poured roughly 400 million yd3 (USD 64 billion) in 2023 and expects mid-single-digit volume increases in 2025-2026. Canada advances urban transit, while Mexico's near-shoring wave fuels industrial parks along the border.
Europe's energy shock trimmed 2024 output, yet policy stimuli centered on renovation and on-shore wind platforms sustain baseline demand. Carbon price escalation under CBAM accelerates the migration to low-clinker mixes, allowing environmentally differentiated suppliers to expand shares despite broader construction contraction. Eastern European markets tap EU cohesion funds for rail and wastewater upgrades, lifting long-term tonnage potential and giving the ready mix concrete market renewed momentum region-wide.
- Adani Group
- BBMG Corporation
- Boral Limited
- Buzzi S.p.A
- CEMEX SAB de CV
- China National Building Material Group Corporation
- China West Construction Group
- CRH
- Foshan Huijiang Concrete Co., Ltd.
- Heidelberg Materials
- Holcim
- Martin Marietta Materials
- OYAK Cimento
- SAMPYO Group
- Titan Cement
- UltraTech Cement Ltd.
- Vicat SA
- Votorantim Cimentos
Additional Benefits:
- The market estimate (ME) sheet in Excel format
- 3 months of analyst support
TABLE OF CONTENTS
1 Introduction
- 1.1 Study Assumptions and Market Definition
- 1.2 Scope of the Study
2 Research Methodology
3 Executive Summary
4 Market Landscape
- 4.1 Market Overview
- 4.2 Market Drivers
- 4.2.1 Rapid urbanization and housing demand
- 4.2.2 Government mega-infrastructure pipelines
- 4.2.3 Preference for quality-controlled off-site batching
- 4.2.4 Environmental push for material efficiency
- 4.2.5 Digital dispatch and telematics optimise delivery
- 4.3 Market Restraints
- 4.3.1 Raw-material price volatility
- 4.3.2 Short workable life/logistics risk
- 4.3.3 Proliferation of on-site volumetric mixers
- 4.4 Value Chain Analysis
- 4.5 Porter's Five Forces
- 4.5.1 Bargaining Power of Suppliers
- 4.5.2 Bargaining Power of Buyers
- 4.5.3 Threat of Substitutes
- 4.5.4 Threat of New Entrants
- 4.5.5 Competitive Rivalry
5 Market Size and Growth Forecasts (Volume)
- 5.1 By Product Type
- 5.1.1 Central Mixed
- 5.1.2 Shrink Mixed
- 5.1.3 Transit Mixed
- 5.2 By End-use Sector
- 5.2.1 Commercial
- 5.2.2 Industrial and Institutional
- 5.2.3 Infrastructure
- 5.2.4 Residential
- 5.3 By Geography
- 5.3.1 Asia-Pacific
- 5.3.1.1 China
- 5.3.1.2 India
- 5.3.1.3 Japan
- 5.3.1.4 South Korea
- 5.3.1.5 Australia
- 5.3.1.6 Indonesia
- 5.3.1.7 Vietnam
- 5.3.1.8 Rest of Asia-Pacific
- 5.3.2 North America
- 5.3.2.1 United States
- 5.3.2.2 Canada
- 5.3.2.3 Mexico
- 5.3.3 Europe
- 5.3.3.1 Germany
- 5.3.3.2 France
- 5.3.3.3 United Kingdom
- 5.3.3.4 Italy
- 5.3.3.5 Spain
- 5.3.3.6 Russia
- 5.3.3.7 Rest of Europe
- 5.3.4 South America
- 5.3.4.1 Brazil
- 5.3.4.2 Argentina
- 5.3.4.3 Rest of South America
- 5.3.5 Middle-East and Africa
- 5.3.5.1 Saudi Arabia
- 5.3.5.2 United Arab Emirates
- 5.3.5.3 Rest of Middle-East and Africa
- 5.3.1 Asia-Pacific
6 Competitive Landscape
- 6.1 Market Concentration
- 6.2 Strategic Moves
- 6.3 Market Share (%)/Ranking Analysis
- 6.4 Company Profiles (includes Global level Overview, Market level overview, Core Segments, Financials as available, Strategic Information, Market Rank/Share, Products and Services, Recent Developments)
- 6.4.1 Adani Group
- 6.4.2 BBMG Corporation
- 6.4.3 Boral Limited
- 6.4.4 Buzzi S.p.A
- 6.4.5 CEMEX SAB de CV
- 6.4.6 China National Building Material Group Corporation
- 6.4.7 China West Construction Group
- 6.4.8 CRH
- 6.4.9 Foshan Huijiang Concrete Co., Ltd.
- 6.4.10 Heidelberg Materials
- 6.4.11 Holcim
- 6.4.12 Martin Marietta Materials
- 6.4.13 OYAK Cimento
- 6.4.14 SAMPYO Group
- 6.4.15 Titan Cement
- 6.4.16 UltraTech Cement Ltd.
- 6.4.17 Vicat SA
- 6.4.18 Votorantim Cimentos
7 Market Opportunities and Future Outlook
- 7.1 White-space and Unmet-Need Assessment
8 Key Strategic Questions for CEOs
 2026年全球混凝土搅拌站市场报告2026年全球混凝土搅拌站搅拌机市场报告2026年全球预拌混凝土市场报告
 预拌混凝土市场:依混凝土类型、製造方法、强度等级、应用、最终用途及通路划分-2026-2032年全球预测
 混凝土搅拌站市场分析及预测(至2035年):依类型、产品类型、服务、技术、组件、应用、材料类型、製程、最终用户、功能划分预拌混凝土市场分析及预测(至2035年):类型、产品类型、应用、技术、组成成分、最终用户、製程、安装类型、设备、解决方案
 全球预拌混凝土市场规模、份额、趋势和成长分析报告(2026-2034)
 日本预拌混凝土市场规模、份额、趋势和预测:按产品、最终用途和地区划分,2026-2034年
 预拌混凝土市场规模、份额和成长分析(按产量、类型、搅拌机类型和地区划分)-2026-2033年产业预测
 2025-2029年全球预拌混凝土市场