


 |
市场调查报告书
商品编码
1910473
工业尿素:市场占有率分析、产业趋势与统计、成长预测(2026-2031)Industrial Grade Urea - Market Share Analysis, Industry Trends & Statistics, Growth Forecasts (2026 - 2031) |
||||||
※ 本网页内容可能与最新版本有所差异。详细情况请与我们联繫。
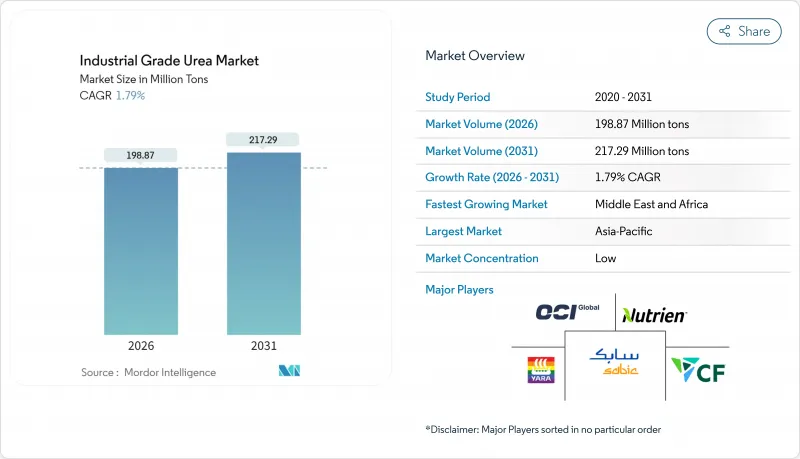
2025 年工业尿素市场价值为 1.9537 亿吨,预计从 2026 年的 1.9887 亿吨增长到 2031 年的 2.1729 亿吨,在预测期(2026-2031 年)内复合年增长率为 1.79%。
市场温和成长的趋势反映出市场格局日趋成熟,成本主导生产经济效益与日益增长的永续性期望之间已达到平衡。需求成长主要由农业部门推动,而柴油引擎废气处理液 (DEF) 和工程木树脂的新增需求则使收入来源更加多元化。能源价格波动、主要生产商之间的整合以及更严格的排放目标主导着战略讨论,而旨在整合绿色氨的工艺创新有望确保企业的长期竞争力。
全球工业尿素市场趋势与洞察
柴油引擎废气处理液(DEF)的日益普及正在改变对技术级DEF的需求。
商用车排放气体法规正大力推动柴油引擎废气处理液(DEF)的普及,光是中国国六排放标准就预计到2025年DEF消费量将达到2,500万吨。欧洲企业正将DEF生产线整合到现有的氨和尿素生产联合装置中,例如CF Industries的Blue Point计划(该计画将于2029年起每年额外生产140万吨低碳氨)。这为应对化肥需求的季节性波动提供了防御性保障,并支撑了DEF的溢价。北美车队将遵守美国环保署(EPA)2027年的相关法规,将进一步支撑中期需求。同时,建筑和采矿业的非道路设备也将扩大其潜在市场。整体而言,DEF的兴起将促使部分工业尿素市场转向高纯度产品,从而间接提高利润率并鼓励对精炼基础设施的投资。
绿色氨的整合重塑生产经济格局
欧盟RED III指令要求在2030年可再生氢的占比达到42%,这将加速低碳氨的普及应用,并透过电解槽成本和再生能源创造新的收入来源。 Stamikabon公司的NX Stami绿色氨模组在日产量50-500吨的规模下,可将资本支出(CAPEX)降低25-30%,有助于建立区域供应基地,缩短运输距离并减少范围3排放。中东的先导计画旨在将太阳能电解与尿素合成相结合,这标誌着尿素生产模式正从单一地点的巨型工厂转向其他模式。早期采用者可以在受碳排放监管的出口市场中获得合规优势,并与寻求低碳供应链的食品饮料公司签订销售合约。长远来看,这些进展可望降低工业尿素市场受天然气价格飙升和碳排放成本衝击的风险。
天然气价格波动威胁生产获利能力。
现货天然气价格从2022年的每百万英热单位6.54美元波动至2023年的每百万英热单位2.66美元,对原料成本占现金成本70%至90%的生产商造成了影响。在2022年能源危机期间,欧洲工厂将运转率限制在75%,并将贸易流向中东供应商。以页岩气为基础的美国业者享有结构性成本优势,而净进口地区在价格飙升期间则面临负利润。避险策略、双燃料能力以及对绿色氨的投资已成为新的应对措施,但这需要大量的资金和政策支持。
细分市场分析
2025年,肥料级尿素占工业尿素市场的84.65%,预计到2031年将以1.83%的复合年增长率成长。技术级尿素的市占率较小,但由于柴油引擎废气处理液(DEF)需求不断增长,预计其成长速度将加快,在预测期内将成长130个基点。饲料级尿素满足反刍动物的营养需求,并对纯度有严格的要求。池式冷凝反应器等製程创新可将资本支出(CAPEX)降低高达30%,并实现产品组合多元化,从而快速适应利润率的波动。
柔软性至关重要,因为它使柴油引擎废气处理液 (DEF) 和三聚氰胺的需求与作物生长週期脱钩,从而平抑收入的季节性波动。获得汽车级尿素认证的生产商符合 ISO 22241 品质标准,并享有持续的溢价。另一方面,化肥生产商由于补贴和环境因素,仍受到应用限制。这种差异解释了为什么在整个预测期内,技术级尿素将成为工业尿素市场规模中成长最快的部分。
工业尿素市场报告按等级(肥料级、技术级、饲料级)、终端用户行业(农业、化学、汽车、医疗及其他终端用户行业)和地区(亚太地区、北美、欧洲、南美以及中东和非洲)进行细分。市场预测以吨为单位。
区域分析
亚太地区在工业尿素市场规模中占据主导地位,预计到2025年将达到66.10%的市场份额,这主要得益于作物投入品的需求以及印度和中国对尿素水溶液(DEF)的日益普及。印度计划在2025年实现尿素自给自足,预计随着印度本地生产规模的扩大,其进口依赖度将降低。
中东和非洲地区将以2.33%的复合年增长率实现最快成长,直至2031年。这主要得益于沙乌地阿拉伯、埃及和阿尔及利亚低成本的天然气原料以及面向出口的产能扩张。新建的氢气生产综合体正在整合绿色氢气试点生产线,以确保未来的碳排放竞争力。由于天然气价格上涨和脱碳政策的影响,欧洲的市场份额正在萎缩,迫使一些工厂实施季节性调整或减产,增加了对北非和美国进口氢气的依赖。
北美地区需求稳定,这主要得益于丰富的页岩气资源以及重型车辆广泛使用柴油废气处理剂(DEF)。贸易格局持续变化,政策限制导致中国2024年上半年出口下降90%,造成东南亚和拉丁美洲现货供不应求。中东产油国迅速填补了这一缺口,巩固了其作为摇摆供应商的地位。长期来看,亚太地区仍将维持主导地位,但随着永续性和国内供应优先政策重塑对外贸易格局,其成长速度将会放缓。
其他福利:
- Excel格式的市场预测(ME)表
- 3个月的分析师支持
目录
第一章 引言
- 研究假设和市场定义
- 调查范围
第二章调查方法
第三章执行摘要
第四章 市场情势
- 市场概览
- 市场驱动因素
- 技术级尿素具有很高的适用性
- 扩大柴油引擎废气处理液(DEF/AdBlue)在公路和非公路车辆的应用
- 亚洲新兴国家化肥消费量不断增加
- 工程木材用三聚氰胺和树脂产量增加
- 向低碳氢化合物绿色氨基尿素过渡
- 市场限制
- 在地下水资源紧张的地区不加选择地过度施肥。
- 天然气价格波动对生产成本的影响
- 主要消费国收紧化肥补贴制度
- 价值链分析
- 监理政策分析
- 技术展望
- 生产过程
- 专利分析
- 波特五力模型
- 供应商的议价能力
- 买方的议价能力
- 新进入者的威胁
- 替代品的威胁
- 竞争程度
- 原料分析
- 进出口趋势
第五章 市场规模与成长预测
- 按年级
- 肥料等级
- 技术级
- 饲料级
- 按最终用户行业划分
- 农业
- 化学
- 车
- 医疗保健
- 其他终端用户产业
- 按地区
- 亚太地区
- 中国
- 印度
- 日本
- 韩国
- ASEAN
- 亚太其他地区
- 北美洲
- 美国
- 加拿大
- 墨西哥
- 欧洲
- 德国
- 法国
- 英国
- 义大利
- 俄罗斯
- 其他欧洲地区
- 南美洲
- 巴西
- 阿根廷
- 其他南美洲
- 中东和非洲
- 沙乌地阿拉伯
- 南非
- 其他中东和非洲地区
- 亚太地区
第六章 竞争情势
- 市场集中度
- 策略趋势
- 市占率(%)/排名分析
- 公司简介
- Acron
- BASF
- CF Industries Holdings Inc.
- Chambal Fertilisers & Chemicals Ltd
- China National Petroleum Corporation(CNPC)
- EuroChem Group
- Genesis Fertilizers
- IFFCO
- Industries Qatar
- Koch Fertilizer LLC
- National Fertilizers Limited
- Notore Chemical Industries PLC
- Nutrien Ltd
- OCI
- Paradeep Phosphates Ltd
- Petrobras
- PT Pupuk Kalimantan Timur(PKT)
- SABIC
- The Chemical Company(TCC)
- Uralchem JSC
- Yara
第七章 市场机会与未来展望
The Industrial Grade Urea Market was valued at 195.37 Million tons in 2025 and estimated to grow from 198.87 Million tons in 2026 to reach 217.29 Million tons by 2031, at a CAGR of 1.79% during the forecast period (2026-2031).
The market's modest trajectory reflects a mature landscape balancing cost-driven production economics with rising sustainability expectations. Demand growth flows mainly from agriculture, yet a new pull from diesel exhaust fluid (DEF) and engineered-wood resins diversifies the revenue base. Energy-price volatility, consolidation among large producers, and stricter emissions targets dominate strategic conversations, while process innovations aimed at green ammonia integration promise longer-term competitiveness.
Global Industrial Grade Urea Market Trends and Insights
Rising Diesel Exhaust Fluid Adoption Transforms Technical Grade Demand
Commercial vehicle emission standards underpin a robust uptake of DEF, with China's National VI regulations alone expected to lift DEF consumption to 25 million tons in 2025. European players are integrating DEF lines into existing ammonia-urea complexes, illustrated by CF Industries' Blue Point project that will add 1.4 million tpy low-carbon ammonia from 2029. This defensively hedges against seasonal fertilizer swings and supports premium pricing. North American fleets following EPA 2027 rules further reinforce a medium-term demand floor, while off-road machinery in construction and mining extends the addressable market. Overall, DEF's rise shifts a portion of the industrial-grade urea market toward higher-purity products, indirectly raising margins and encouraging investments in purification infrastructure.
Green Ammonia Integration Reshapes Production Economics
The European Union's RED III requirement for 42% renewable hydrogen by 2030 accelerates low-carbon ammonia adoption, turning electrolyzer costs and renewable power availability into new profit levers. Stamicarbon's NX Stami Green Ammonia modules slash CAPEX 25-30% at 50-500 t per day scale, enabling regional supply hubs that shorten freight routes and curb scope 3 emissions. Pilot projects in the Middle East aim to couple solar-powered electrolysis with urea synthesis, signaling a shift away from single-site mega-plants. Early adopters gain compliance advantages in carbon-regulated export markets and secure offtake agreements from food and beverage firms seeking lower-footprint supply chains. Over the long term, these developments could moderate the industrial-grade urea market's exposure to natural-gas price spikes and carbon costs.
Natural Gas Price Volatility Threatens Production Viability
Spot gas swung from USD 6.54/MMBtu in 2022 to USD 2.66/MMBtu in 2023, exposing producers whose feedstock can constitute 70-90% of cash costs. European plants curtailed utilization to 75% amid the 2022 energy crisis, redirecting trade flows toward Middle Eastern suppliers. U.S. operators with shale-based gas benefit from structural cost advantages, whereas net-importing areas confront negative margins during price spikes. Hedging strategies, dual-fuel capabilities, and green ammonia investments are emerging defenses but require substantial capital and policy support.
Other drivers and restraints analyzed in the detailed report include:
- Technical Grade Applications Drive Premium Segment Growth
- Emerging Asia Fertilizer Demand Sustains Long-term Growth
- Environmental Regulations Constrain Application Growth
For complete list of drivers and restraints, kindly check the Table Of Contents.
Segment Analysis
Fertilizer grade accounted for 84.65% of the industrial grade urea market in 2025 and is forecast to expand at a 1.83% CAGR to 2031. The technical grade slice, while smaller, accelerates on DEF demand, potentially lifting its share by 130 basis points within the outlook period. Feed grade addresses ruminant nutrition niches with stringent purity needs. Process innovations such as pool-condenser reactors lower CAPEX by up to 30%, enabling multiproduct configurations that respond swiftly to shifting margins.
Flexibility matters because DEF and melamine demand decouple from crop cycles, smoothing revenue seasonality. Producers certified for automotive-grade urea meet ISO 22241 quality thresholds, commanding sustained premiums. In contrast, fertilizer producers remain exposed to subsidy regimes and environmentally driven application caps. This divergence underlines why technical grade is the fastest growing component of the industrial grade urea market size across the forecast.
The Industrial Grade Urea Market Report is Segmented by Grade (Fertilizer Grade, Technical Grade, and Feed Grade), End-User Industry (Agriculture, Chemical, Automotive, Medical, and Other End-User Industries), and Geography (Asia-Pacific, North America, Europe, South America, and Middle-East and Africa). The Market Forecasts are Provided in Terms of Volume (Tons)
Geography Analysis
Asia-Pacific dominated the industrial-grade urea market size with a 66.10% share in 2025, driven by India's and China's crop inputs and rising DEF uptake. Local production expansion in India aims for self-sufficiency by 2025, potentially trimming import reliance.
The Middle East and Africa region posts the fastest 2.33% CAGR through 2031, fueled by low-cost gas feedstock and export-oriented capacity additions in Saudi Arabia, Egypt, and Algeria. New complexes integrate green-hydrogen pilot lines to future-proof carbon competitiveness. Europe's share contracts amid high gas costs and decarbonization policies; several plants operate seasonally or under curtailment, increasing import reliance on North Africa and the United States.
North America maintains steady demand, benefiting from abundant shale gas and ongoing DEF adoption in heavy-duty fleets. Trade patterns continue shifting: China's H1 2024 export volumes fell 90% following policy restrictions, creating spot shortages in Southeast Asia and Latin America. Middle Eastern producers quickly captured these gaps, affirming their swing-supplier status. Over the long term, Asia-Pacific retains leadership, yet its growth moderates as sustainability policies and domestic supply priorities reshape external trade.
- Acron
- BASF
- CF Industries Holdings Inc.
- Chambal Fertilisers & Chemicals Ltd
- China National Petroleum Corporation (CNPC)
- EuroChem Group
- Genesis Fertilizers
- IFFCO
- Industries Qatar
- Koch Fertilizer LLC
- National Fertilizers Limited
- Notore Chemical Industries PLC
- Nutrien Ltd
- OCI
- Paradeep Phosphates Ltd
- Petrobras
- PT Pupuk Kalimantan Timur (PKT)
- SABIC
- The Chemical Company (TCC)
- Uralchem JSC
- Yara
Additional Benefits:
- The market estimate (ME) sheet in Excel format
- 3 months of analyst support
TABLE OF CONTENTS
1 Introduction
- 1.1 Study Assumptions and Market Definition
- 1.2 Scope of the Study
2 Research Methodology
3 Executive Summary
4 Market Landscape
- 4.1 Market Overview
- 4.2 Market Drivers
- 4.2.1 High applicability of technical-grade urea
- 4.2.2 Rising diesel exhaust fluid (DEF/AdBlue) adoption in on-road and off-road vehicles
- 4.2.3 Expanding fertilizer consumption in emerging Asia
- 4.2.4 Increased melamine and resin production for engineered wood
- 4.2.5 Shift toward green ammonia-based urea via low-carbon hydrogen
- 4.3 Market Restraints
- 4.3.1 Indiscriminate over-application in groundwater-stressed regions
- 4.3.2 Volatile natural-gas pricing impacting production cost
- 4.3.3 Stricter fertilizer subsidy reforms in major consuming countries
- 4.4 Value Chain Analysis
- 4.5 Regulatory Policy Analysis
- 4.6 Technological Outlook
- 4.6.1 Production Process
- 4.6.2 Patent Analysis
- 4.7 Porter's Five Forces
- 4.7.1 Bargaining Power of Suppliers
- 4.7.2 Bargaining Power of Buyers
- 4.7.3 Threat of New Entrants
- 4.7.4 Threat of Substitutes
- 4.7.5 Degree of Competition
- 4.8 Feedstock Analysis
- 4.9 Import-Export Trends
5 Market Size and Growth Forecasts (Volume)
- 5.1 By Grade
- 5.1.1 Fertilizer Grade
- 5.1.2 Technical Grade
- 5.1.3 Feed Grade
- 5.2 By End-user Industry
- 5.2.1 Agriculture
- 5.2.2 Chemical
- 5.2.3 Automotive
- 5.2.4 Medical
- 5.2.5 Other End-user Industries
- 5.3 By Geography
- 5.3.1 Asia-Pacific
- 5.3.1.1 China
- 5.3.1.2 India
- 5.3.1.3 Japan
- 5.3.1.4 South Korea
- 5.3.1.5 ASEAN
- 5.3.1.6 Rest of Asia-Pacific
- 5.3.2 North America
- 5.3.2.1 United States
- 5.3.2.2 Canada
- 5.3.2.3 Mexico
- 5.3.3 Europe
- 5.3.3.1 Germany
- 5.3.3.2 France
- 5.3.3.3 United Kingdom
- 5.3.3.4 Italy
- 5.3.3.5 Russia
- 5.3.3.6 Rest of Europe
- 5.3.4 South America
- 5.3.4.1 Brazil
- 5.3.4.2 Argentina
- 5.3.4.3 Rest of South America
- 5.3.5 Middle-East and Africa
- 5.3.5.1 Saudi Arabia
- 5.3.5.2 South Africa
- 5.3.5.3 Rest of Middle-East and Africa
- 5.3.1 Asia-Pacific
6 Competitive Landscape
- 6.1 Market Concentration
- 6.2 Strategic Moves
- 6.3 Market Share (%)/Ranking Analysis
- 6.4 Company Profiles (includes Global level Overview, Market level overview, Core Segments, Financials as available, Strategic Information, Market Rank/Share for key companies, Products and Services, and Recent Developments)
- 6.4.1 Acron
- 6.4.2 BASF
- 6.4.3 CF Industries Holdings Inc.
- 6.4.4 Chambal Fertilisers & Chemicals Ltd
- 6.4.5 China National Petroleum Corporation (CNPC)
- 6.4.6 EuroChem Group
- 6.4.7 Genesis Fertilizers
- 6.4.8 IFFCO
- 6.4.9 Industries Qatar
- 6.4.10 Koch Fertilizer LLC
- 6.4.11 National Fertilizers Limited
- 6.4.12 Notore Chemical Industries PLC
- 6.4.13 Nutrien Ltd
- 6.4.14 OCI
- 6.4.15 Paradeep Phosphates Ltd
- 6.4.16 Petrobras
- 6.4.17 PT Pupuk Kalimantan Timur (PKT)
- 6.4.18 SABIC
- 6.4.19 The Chemical Company (TCC)
- 6.4.20 Uralchem JSC
- 6.4.21 Yara
7 Market Opportunities and Future Outlook
- 7.1 White-space and Unmet-Need Assessment
 尿素市场分析及预测(至2035年):类型、产品、应用、最终用户、形态、技术、製程、材料类型、安装类型
 全球硫包覆尿素市场规模、份额、趋势及成长分析报告(2026-2034)
 尿素市场规模、份额、趋势及预测(依等级、应用、最终用途产业及地区划分),2026-2034年
 2026年全球尿素市场报告
 尿素:市占率分析、产业趋势与统计、成长预测(2026-2031)日本尿素市场报告(依等级、应用、最终用途产业及地区划分,2026-2034年)全球尿素市场:市场规模、占有率、成长率、产业分析、按类型、应用和地区划分的考量、未来预测(2026-2034)
 尿素市场规模、份额和成长分析(按等级、类型、应用和地区划分)-2026-2033年产业预测
 尿素市场按形态、等级、纯度、分销管道(间接和直接)和地区划分
 全球奈米脲市场