


 |
市场调查报告书
商品编码
1911711
尿素:市占率分析、产业趋势与统计、成长预测(2026-2031)Urea - Market Share Analysis, Industry Trends & Statistics, Growth Forecasts (2026 - 2031) |
||||||
※ 本网页内容可能与最新版本有所差异。详细情况请与我们联繫。
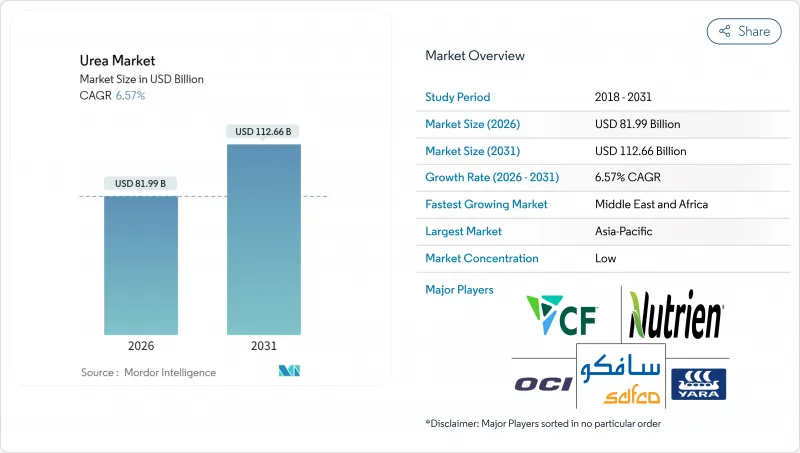
2025年尿素市值为769.5亿美元,预计到2031年将达到1126.6亿美元,而2026年为819.9亿美元。
预计在预测期(2026-2031 年)内,复合年增长率将达到 6.57%。
需求持续上升,同时粮食面积的快速扩张和首批商业规模的绿氢能计划正在重塑生产经济格局。拥有长期天然气合约的生产商能够在价格上涨期间保障利润,而分散式港口设施和可再生氨生产设施正开始改变区域成本曲线。同时,政府日益严格的溢油限制措施推动了对平均售价更高的包覆和稳定剂产品的需求。这些协同效应正在推动原料采购的策略性避险、与物流资产的更深层整合,以及高效能肥料配方研发的加速发展。
全球尿素市场趋势及展望
全球粮食种植面积扩大
随着全球谷物种植面积的扩大,农民力争2030年将产量提高28%,氮肥需求也随之稳定成长。印度、中国和非洲部分地区的高产小麦、稻米和玉米计画正在大量消耗与GPS导航喷雾器相容的颗粒尿素。奈米尿素在印度的引入表明,优化施肥量可以在不减少养分供应的情况下降低对环境的影响。撒哈拉以南非洲地区的政府投入补贴进一步提高了化肥施用量,并促进了小规模农户使用缓释氮肥包膜产品。巴西国家肥料计画正在支持大豆和玉米面积的扩大,同时提升国内产能以减少对进口的依赖。有利的商品价格正在维持面积的成长,并巩固尿素市场的长期消费基础。
氮在肥料中的重要性
在全球范围内,玉米、油菜、棉花、高粱、水稻、小麦和大豆等作物是必需营养元素的主要消耗者。这些主要作物对营养元素的需求各不相同,预计到2024年,大量元素的平均施用量将在120.97公斤/公顷至255.75公斤/公顷之间。这些营养元素对于维持植物代谢过程以及细胞、细胞膜和叶绿素等重要组织的生长和发育至关重要。氮肥仍是施用最广泛的营养元素,平均施用量为224.6公斤/公顷。随着田间作物种植面积的不断扩大,尤其是在南美洲和亚太地区,欧洲和北美等面临营养元素缺乏的地区也越来越多地采用尿素专用肥料,因为其具有较高的肥效。
天然气价格波动会推高生产成本。
原料成本占尿素出厂价格的80%之多。 2022年,当欧洲基准天然气价格超过每兆瓦时300欧元(324美元)时,一些工厂为了避免亏损选择停产。沙乌地阿拉伯基础工业公司(SABIC)等一体化上游生产商透过自有天然气供应维持了盈利。其他企业虽然制定了避险计划,但如果现货价格飙升超过其避险期限,仍将面临资金外流。这种波动性正在加速向天然气供应稳定的地区转移,推动模组化工厂采用氨进口,并随着电价下降重新激发人们对可再生氢的兴趣。
细分市场分析
水溶性尿素肥料预计将成为特种尿素肥料市场的主导细分市场,到2025年将占40.35%的市场份额。尿素具有高氮含量和优异的水溶性,能够显着提高植物根係对氮的吸收,进而促进植物生长。此细分市场的主导地位主要归因于土壤中氮含量的下降,而土壤氮含量下降的主要原因是气候变迁的影响,例如全球干旱、热浪和水资源短缺的加剧。农民越来越倾向于使用水溶性尿素肥料,因为它既能确保稳定的氮供应,又能降低氮流失和挥发的风险,从而减少环境和地下水污染。缓释尿素是成长最快的细分市场,预计从2026年到2031年将以7.28%的复合年增长率成长,因为农民和农业相关企业越来越多地采用提高效率的材料来减少氮流失并满足永续性标准。聚合物包膜和聚合物硫包膜製剂能够增强养分释放,最大限度地减少养分淋溶和挥发,并透过减少施肥频率来提高劳动效率。养分管理方面的监管要求以及谷物、油籽和特种作物中控释肥料使用量的增加,进一步推动了这一增长。受种植者提高产量和减少环境影响的需求驱动,控释尿素的需求逐年加速成长。
本尿素市场报告将产业细分为以下几个部分:特种类型(控释尿素肥、液体肥料、控释颗粒尿素、水溶性尿素)、作物类型(田间作物、园艺作物、草坪和观赏植物)、形态(常规型和特种型)以及地区(亚太地区、欧洲、中东和非洲、北美、南美)。市场规模以价值(美元)和数量(公吨)表示。
区域分析
到2025年,亚太地区将占总收入的44.92%,这主要得益于中国和印度粮食种植的密集化。越南、印尼和菲律宾耕地面积的扩大以及机械化施肥设备的普及将进一步推动成长。在中国,化肥减量政策推动了奈米尿素和包膜肥料的使用,导致每公顷投入增加,但养分总量保持稳定。在印度,补贴改革促进了养分均衡管理,提高了对高价值复合肥料的需求,使其超过通用颗粒肥料。此外,东协氢能蓝图正在为低碳氨进口做准备,这有望支持未来的绿色尿素生产。
中东和非洲是成长最快的地区,预计复合年增长率将达到9.17%。这一成长主要得益于沙乌地阿拉伯、阿联酋和奈及利亚的产能扩张,以及低成本天然气带来的出口竞争力提升。当地的农业补贴计画也刺激了内陆地区的需求。尼日利亚的丹格特综合体同时服务国内市场和西非市场,降低了对外国进口的依赖。波湾合作理事会(GCC)成员国正在探索利用太阳能电解生产绿色氨的工厂,以吸引来自欧洲和亚洲的注重碳排放的买家。然而,撒哈拉以南非洲部分地区的基础设施不足和政治不稳定构成了挑战,儘管捐助者支持的农业推广计画仍在继续推动化肥的推广应用。
北美和欧洲的成长轨迹成熟而稳定。在北美,页岩气使化肥厂能够保持成本优势,位列生产商前25%,从而维持了对拉丁美洲的出口。在欧洲,更严格的农业政策(例如营养素含量上限)促使颗粒包衣化肥产品广泛使用。德国和比利时的进口码头正在拓展采购管道,在天然气价格高企时期,从北非和中东进口的氨弥补了本地产量的下降。
其他福利:
- Excel格式的市场预测(ME)表
- 3个月的分析师支持
目录
第一章 引言
- 研究假设和市场定义
- 调查范围
- 调查方法
第二章 报告
第三章执行摘要主要发现
第四章 主要产业趋势
- 主要农作物种植面积
- 田间作物
- 园艺作物
- 平均施肥量
- 微量营养素
- 田间作物
- 园艺作物
- 微量营养素
- 宏量营养素
- 田间作物
- 园艺作物
- 具有灌溉设施的农田
- 法律规范
- 价值炼和通路分析
- 市场驱动因素
- 扩大粮食作物种植面积
- 肥料中氮作为大量营养元素的依赖性
- 尿素相对于其他氮肥的成本优势
- 颗粒尿素在精密农业中越来越受欢迎
- 提高可再生氢基绿色尿素的生产能力
- 港口沿线的模组化尿素工厂可降低物流成本
- 市场限制
- 天然气价格波动导致生产成本增加
- 加强氮肥使用相关的径流和温室气体排放法规
- 硝酸铵和尿素硝铵溶液的替代威胁
- 地缘政治贸易路线中断
第五章 市场规模和成长预测(价值和数量)
- 专业类型
- CRF
- 聚合物涂层
- 聚合物和硫涂层
- 其他的
- 液体肥料
- SRF
- 水溶性
- CRF
- 作物类型
- 田间作物
- 园艺作物
- 草坪和观赏植物
- 形式
- 传统的
- 特别的
- 地区
- 亚太地区
- 澳洲
- 孟加拉
- 中国
- 印度
- 印尼
- 日本
- 巴基斯坦
- 菲律宾
- 泰国
- 越南
- 亚太其他地区
- 欧洲
- 法国
- 德国
- 义大利
- 荷兰
- 俄罗斯
- 西班牙
- 乌克兰
- 英国
- 其他欧洲地区
- 中东和非洲
- 奈及利亚
- 沙乌地阿拉伯
- 南非
- 土耳其
- 其他中东和非洲地区
- 北美洲
- 加拿大
- 墨西哥
- 美国
- 北美其他地区
- 南美洲
- 阿根廷
- 巴西
- 南美洲其他地区
- 亚太地区
第六章 竞争情势
- 关键策略倡议
- 市占率分析
- 公司简介
- 公司简介。
- CF Industries Holdings, Inc.
- Coromandel International Ltd.
- EuroChem Group
- Indian Farmers Fertiliser Cooperative Limited
- Koch Industries Inc.
- Nutrien Ltd.
- OCI NV
- SABIC Agri-Nutrients Co.
- Yara International ASA
- Qatar Fertiliser Company(QAFCO)
- PT Pupuk Kalimantan Timur
- Rashtriya Chemicals and Fertilizers Limited
- Acron Group(Acron PJSC)
- BASF SE
- URALCHEM Holding PLC
- The Mosaic Company
第七章:CEO们需要思考的关键策略问题
The urea market was valued at USD 76.95 billion in 2025 and estimated to grow from USD 81.99 billion in 2026 to reach USD 112.66 billion by 2031, at a CAGR of 6.57% during the forecast period (2026-2031).
Rapid cereal acreage expansion and the first commercial green hydrogen projects are reshaping production economics while keeping demand on an upward trajectory. Producers with long-term natural gas contracts protect margins during price spikes, yet distributed port-side plants and renewable-powered ammonia units are beginning to reset regional cost curves. In parallel, governments tighten runoff rules, which steer demand toward coated and stabilized products that command higher average selling prices. These converging forces encourage strategic hedging in feedstock sourcing, deeper integration with logistics assets, and accelerated R&D in enhanced-efficiency fertilizer formulations.
Global Urea Market Trends and Insights
Intensifying Cereal Crop Cultivation Worldwide
Escalating global cereal acreage keeps nitrogen demand on a solid climb as farmers strive to meet a 28% production increase by 2030. High-yield wheat, rice, and maize programs in India, China, and parts of Africa absorb large volumes of granular urea that are compatible with GPS-guided spreaders. India's nano urea rollout shows how dosage optimization can reduce environmental load without cutting nutrient supply. Government input subsidies in Sub-Saharan Africa further lift application rates and introduce smallholder farmers to coated products that slow nitrogen release. Brazil's Plano Nacional de Fertilizantes backs domestic capacity to curb import reliance while supporting expanding soybean and corn acreages. Favorable commodity prices sustain acreage gains, strengthening long-run consumption fundamentals for the urea market.
Fertilizers reliance on nitrogen as a key nutrient
Globally, crops such as corn, rapeseed, cotton, sorghum, rice, wheat, and soybeans are major consumers of essential nutrients. In 2024, these key crops exhibit varying nutritional requirements, with an average application rate of primary nutrients ranging from 120.97 kg/ha to 255.75 kg/ha. These nutrients are critical for supporting plant metabolic processes and the development of essential tissues, including cells, membranes, and chlorophyll. Nitrogen remains the most widely applied nutrient, with an average application rate of 224.6 kg/ha. As the cultivation area for field crops continues to expand, particularly in South America and the Asia-Pacific regions, regions such as Europe and North America, facing nutrient deficiencies, are increasingly adopting urea specialty fertilizers due to their efficiency.
Natural Gas Price Volatility Raising Production Costs
Feedstock accounts for up to 80% of ex-works urea pricing. When European benchmark gas cleared EUR 300 per MWh (USD 324 per MWh) in 2022, several plants idled rather than operate at negative margins. Producers with upstream integration, such as SABIC in Saudi Arabia, preserve profitability through captive gas. Others deploy hedging programs, yet still confront cash burn when spot spikes surpass hedge coverage. This volatility quickens the shift toward regions with stable gas supply, stimulates adoption of ammonia imports for modular plants, and rekindles interest in renewable hydrogen at declining power tariffs.
Other drivers and restraints analyzed in the detailed report include:
- Cost Advantage of Urea Versus Other Nitrogen Fertilizers
- Growing Preference for Granular Urea in Precision Farming
- Tightening Runoff and Greenhouse Gas Regulations on Nitrogen Use
For complete list of drivers and restraints, kindly check the Table Of Contents.
Segment Analysis
Water-soluble urea fertilizers have emerged as the dominant segment in the specialty urea fertilizers market, commanding 40.35% market share in 2025. Urea, being rich in nitrogen and easily soluble in water, significantly enhances nitrogen uptake by plant roots, thereby stimulating growth. The segment's dominance is primarily driven by shifting climatic patterns, including droughts, heatwaves, and escalating water scarcity worldwide, which have curtailed nitrogen availability in soils. Farmers increasingly prefer water-soluble urea fertilizers as they ensure a consistent nitrogen supply while mitigating nitrogen leaching, volatilization, and associated risks of environmental pollution and groundwater contamination.Controlled-release urea is the fastest-growing segment with a CAGR of 7.28% during the forecast period 2026-2031, as farmers and agribusinesses increasingly adopt efficiency-enhancing inputs to reduce nitrogen losses and comply with sustainability standards. Polymer-coated and polymer sulfur-coated formulations provide extended nutrient release, minimizing leaching and volatilization while improving labor efficiency through reduced application frequency. This growth is further driven by regulatory requirements for nutrient management and the rising use of controlled-release fertilizers in cereals, oilseeds, and specialty crops. The demand for controlled-release urea is accelerating year-on-year as growers aim to achieve higher productivity with reduced environmental impact.
The Urea Market Report Segments the Industry Into Speciality Type (CRF, Liquid Fertilizer, SRF, and Water Soluble), Crop Type (Field Crops, Horticultural Crops, and Turf & Ornamental), Form (Conventional and Speciality), and Region (Asia-Pacific, Europe, Middle East & Africa, North America, and South America). The Market Size is Provided in Terms of Value(USD) and Volume(Metric Tons).
Geography Analysis
Asia-Pacific accounted for 44.92% of 2025 revenue, driven by intensive cereal cultivation in China and India. Growth is further supported by expanding acreage and the adoption of mechanized fertilizing equipment in Vietnam, Indonesia, and the Philippines. In China, fertilizer reduction mandates are encouraging the use of nano urea and coated products, leading to higher spending per hectare despite stable total nutrient tonnage. In India, subsidy reforms promote balanced nutrient management, increasing demand for higher-value formulations over generic prills. Additionally, the ASEAN hydrogen roadmap is preparing the region for low-carbon ammonia imports, which could support future green urea production.
The Middle East and Africa are the fastest-growing regions, with a projected CAGR of 9.17%. Growth is driven by capacity expansions in Saudi Arabia, the UAE, and Nigeria, supported by low-cost gas that enhances export competitiveness. Local farm subsidy programs are also boosting demand in inland areas. Nigeria's Dangote complex serves both domestic and West African markets, reducing dependency on offshore imports. Gulf Cooperation Council countries are exploring solar-powered electrolyzers for green ammonia production, positioning themselves to attract carbon-conscious buyers in Europe and Asia. However, infrastructure gaps and political instability in parts of Sub-Saharan Africa pose challenges, though donor-backed agronomic extension programs continue to support fertilizer adoption.
North America and Europe exhibit mature but steady growth trajectories. In North America, shale gas ensures that fertilizer plants remain among the first-quartile cost producers, sustaining export flows to Latin America. In Europe, stricter farm policies on nutrient caps are driving the adoption of granular coated products. Import terminals in Germany and Belgium are expanding sourcing options, with ammonia imports from North Africa and the Middle East compensating for reduced local production during periods of high gas prices.
- CF Industries Holdings, Inc.
- Coromandel International Ltd.
- EuroChem Group
- Indian Farmers Fertiliser Cooperative Limited
- Koch Industries Inc.
- Nutrien Ltd.
- OCI NV
- SABIC Agri-Nutrients Co.
- Yara International ASA
- Qatar Fertiliser Company (QAFCO)
- PT Pupuk Kalimantan Timur
- Rashtriya Chemicals and Fertilizers Limited
- Acron Group (Acron PJSC)
- BASF SE
- URALCHEM Holding P.L.C.
- The Mosaic Company
Additional Benefits:
- The market estimate (ME) sheet in Excel format
- 3 months of analyst support
TABLE OF CONTENTS
1 INTRODUCTION
- 1.1 Study Assumptions & Market Definition
- 1.2 Scope of the Study
- 1.3 Research Methodology
2 REPORT OFFERS
3 EXECUTIVE SUMMARY & KEY FINDINGS
4 KEY INDUSTRY TRENDS
- 4.1 Acreage Of Major Crop Types
- 4.1.1 Field Crops
- 4.1.2 Horticultural Crops
- 4.2 Average Nutrient Application Rates
- 4.2.1 Micronutrients
- 4.2.1.1 Field Crops
- 4.2.1.2 Horticultural Crops
- 4.2.1 Micronutrients
- 4.3 Primary Nutrients
- 4.3.1 Field Crops
- 4.3.2 Horticultural Crops
- 4.4 Agricultural Land Equipped For Irrigation
- 4.5 Regulatory Framework
- 4.6 Value Chain & Distribution Channel Analysis
- 4.7 Market Drivers
- 4.7.1 Intensifying cereal crop cultivation
- 4.7.2 Fertilizers reliance on nitrogen as a key nutrient
- 4.7.3 Cost advantage of urea versus other nitrogen fertilizers
- 4.7.4 Growing preference for granular urea in precision farming
- 4.7.5 Renewable-hydrogen-based green urea capacity additions
- 4.7.6 Port-side modular urea plants lowering logistics costs
- 4.8 Market Restraints
- 4.8.1 Natural gas price volatility raising production costs
- 4.8.2 Tightening runoff and greenhouse gas regulations on nitrogen use
- 4.8.3 Substitution threat from ammonium nitrate and UAN
- 4.8.4 Geopolitical trade-route disruptions
5 MARKET SIZE AND GROWTH FORECASTS (VALUE AND VOLUME)
- 5.1 Speciality Type
- 5.1.1 CRF
- 5.1.1.1 Polymer Coated
- 5.1.1.2 Polymer-Sulfur Coated
- 5.1.1.3 Others
- 5.1.2 Liquid Fertilizer
- 5.1.3 SRF
- 5.1.4 Water Soluble
- 5.1.1 CRF
- 5.2 Crop Type
- 5.2.1 Field Crops
- 5.2.2 Horticultural Crops
- 5.2.3 Turf & Ornamental
- 5.3 Form
- 5.3.1 Conventional
- 5.3.2 Speciality
- 5.4 Region
- 5.4.1 Asia-Pacific
- 5.4.1.1 Australia
- 5.4.1.2 Bangladesh
- 5.4.1.3 China
- 5.4.1.4 India
- 5.4.1.5 Indonesia
- 5.4.1.6 Japan
- 5.4.1.7 Pakistan
- 5.4.1.8 Philippines
- 5.4.1.9 Thailand
- 5.4.1.10 Vietnam
- 5.4.1.11 Rest of Asia-Pacific
- 5.4.2 Europe
- 5.4.2.1 France
- 5.4.2.2 Germany
- 5.4.2.3 Italy
- 5.4.2.4 Netherlands
- 5.4.2.5 Russia
- 5.4.2.6 Spain
- 5.4.2.7 Ukraine
- 5.4.2.8 United Kingdom
- 5.4.2.9 Rest of Europe
- 5.4.3 Middle East & Africa
- 5.4.3.1 Nigeria
- 5.4.3.2 Saudi Arabia
- 5.4.3.3 South Africa
- 5.4.3.4 Turkey
- 5.4.3.5 Rest of Middle East & Africa
- 5.4.4 North America
- 5.4.4.1 Canada
- 5.4.4.2 Mexico
- 5.4.4.3 United States
- 5.4.4.4 Rest of North America
- 5.4.5 South America
- 5.4.5.1 Argentina
- 5.4.5.2 Brazil
- 5.4.5.3 Rest of South America
- 5.4.1 Asia-Pacific
6 COMPETITIVE LANDSCAPE
- 6.1 Key Strategic Moves
- 6.2 Market Share Analysis
- 6.3 Company Landscape
- 6.4 Company Profiles (Includes Global Level Overview, Market Level Overview, Core Business Segments, Financials, Headcount, Key Information, Market Rank, Market Share, Products and Services, and Analysis of Recent Developments).
- 6.4.1 CF Industries Holdings, Inc.
- 6.4.2 Coromandel International Ltd.
- 6.4.3 EuroChem Group
- 6.4.4 Indian Farmers Fertiliser Cooperative Limited
- 6.4.5 Koch Industries Inc.
- 6.4.6 Nutrien Ltd.
- 6.4.7 OCI NV
- 6.4.8 SABIC Agri-Nutrients Co.
- 6.4.9 Yara International ASA
- 6.4.10 Qatar Fertiliser Company (QAFCO)
- 6.4.11 PT Pupuk Kalimantan Timur
- 6.4.12 Rashtriya Chemicals and Fertilizers Limited
- 6.4.13 Acron Group (Acron PJSC)
- 6.4.14 BASF SE
- 6.4.15 URALCHEM Holding P.L.C.
- 6.4.16 The Mosaic Company
7 KEY STRATEGIC QUESTIONS FOR FERTILIZER CEOS
 尿素市场分析及预测(至2035年):类型、产品、应用、最终用户、形态、技术、製程、材料类型、安装类型
 全球硫包覆尿素市场规模、份额、趋势及成长分析报告(2026-2034)
 尿素市场规模、份额、趋势及预测(依等级、应用、最终用途产业及地区划分),2026-2034年
 2026年全球尿素市场报告
 工业尿素:市场占有率分析、产业趋势与统计、成长预测(2026-2031)日本尿素市场报告(依等级、应用、最终用途产业及地区划分,2026-2034年)全球尿素市场:市场规模、占有率、成长率、产业分析、按类型、应用和地区划分的考量、未来预测(2026-2034)
 尿素市场规模、份额和成长分析(按等级、类型、应用和地区划分)-2026-2033年产业预测
 尿素市场按形态、等级、纯度、分销管道(间接和直接)和地区划分
 全球奈米脲市场