


 |
市场调查报告书
商品编码
1910598
快速消费品物流:市场占有率分析、产业趋势与统计、成长预测(2026-2031)FMCG Logistics - Market Share Analysis, Industry Trends & Statistics, Growth Forecasts (2026 - 2031) |
||||||
※ 本网页内容可能与最新版本有所差异。详细情况请与我们联繫。
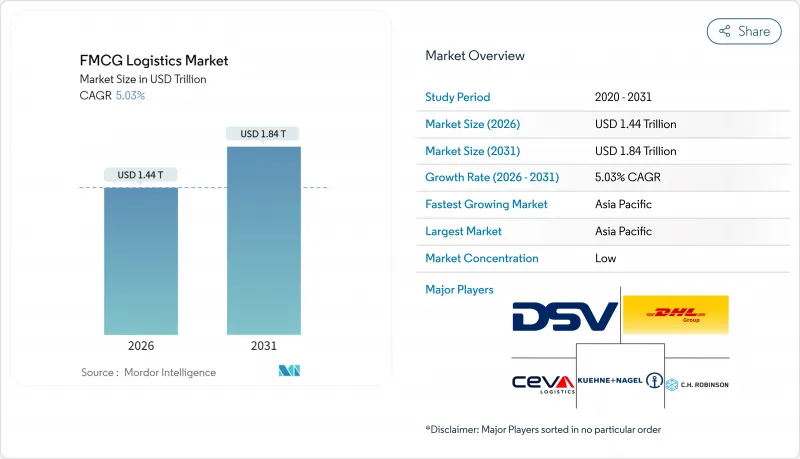
预计消费品物流市场规模将从 2025 年的 1.37 兆美元成长到 2026 年的 1.44 兆美元,到 2031 年将达到 1.84 兆美元,2026 年至 2031 年的复合年增长率为 5.03%。
电子商务的蓬勃发展、快速的都市化进程以及不断壮大的中产阶级消费者正在改变分销模式,企业正朝着以技术为驱动、以永续性发展为核心的价值链转型,以实现端到端的可视性和更快的履约速度。儘管运输服务仍然是价值创造的主导力量,但随着品牌寻求更贴近需求的客製化服务,联合包装和贴标等附加价值服务正日益受到重视。不断扩展的低温运输正在推动冷冻食品和医疗保健产业的成长,而数位化视觉性平台则支援预测性决策,从而减少废弃物和缺货。日益激烈的竞争和近期的大型併购案正在推动规模经济的实现,而专注于区域市场的公司则凭藉其本地化的「最后一公里」配送能力,在快速消费品物流市场保持着优势。
全球快速消费品物流市场趋势与洞察
电子商务加速发展及对最后一公里配送的期望
线上销售的快速成长正在缩短配送时间并改变订单模式,迫使快速消费品物流市场转向微型仓配和都市区的当日达服务。在巴西,2024年上半年快速消费品线上销售额成长了13.6%,其中健康美容产品成长了17.8%,食品成长了26.2%。随着消费者对精准性和永续性的期望不断提高,物流供应商正在部署前置物流中心、电动货车和即时追踪系统。对路线优化平台和逆向物流能力的投资也源源不断,以帮助平衡不断增长的B2B补货量和持续增长的直销需求。这些变化为依赖合作伙伴提供末端配送服务的轻资产品牌带来了竞争挑战。
第三方物流/合约物流在快速消费品产业的渗透
品牌商正越来越多地透过将固定物流成本外包给第三方物流 (3PL) 公司,将成本转化为可变成本,并利用跨区域的规模经济和专业知识。 McClain 与 Circle K 签订的 2025 年合同,充分展现了整合库存可视性和车队优化的运输和配送解决方案的吸引力。合约物流供应商透过联合包装、促销捆绑和全通路退货等方式实现差异化,从而建立牢固的长期合作关係。这种模式使快速消费品 (FMCG) 公司能够在不占用大量资金的情况下快速部署自动化、合规系统和分析工具。这种模式加速了快速消费品物流市场向服务型生态系统的演进。
燃油价格波动
柴油价格波动对运输预算造成沉重负担,燃料成本约占全球卡车运输营运成本的25%。虽然额外费用公式和避险协议可以缓解部分影响,但时间上的差异往往会导致承运人和快速消费品托运人之间的运费谈判出现摩擦。外汇波动使跨境路线的成本计算更加复杂,促使人们更多地采用路线优化软体、引入液化天然气等替代燃料,以及重新设计运输网路以减少空驶里程。因此,价格的不确定性正在抑制投资,并降低快速消费品物流市场的利润率。
细分市场分析
到2025年,运输业将占总收入的66.35%,凸显其在庞大的分销网络中运输大批量货物的关键作用。公路货运仍然是该网路的核心,连接着製造地、区域配送中心和最后一公里配送中心,而海运和铁路运输则支持跨洲的大批量货物运输。如今,竞争优势主要体现在多模态整合、永续的车队更新以及能够降低运输波动性的、数据驱动的路线规划。附加价值服务虽然规模较小,但正以4.74%的复合年增长率快速成长,因为品牌商寻求在更靠近需求点的地方进行联合包装、贴标和配套服务,以缩短前置作业时间和降低行销风险。透过将核心运输业务与客製化服务相结合,供应商有机会在快速消费品物流市场中占据更大的份额。
全通路活动的活性化导致订单类型更加复杂,从而推动了对延迟配置和退货管理的需求。仓库内自动化分类系统、协作机器人和品质保证单元的投资将提高处理速度并减少错配错误。能够在单一合约中提供运输、仓储和客製化服务的营运商将提高客户留存率并增加客户钱包份额。因此,儘管运输环节仍将是基础,但快速消费品物流市场的高收入成长正在转向能够增强客户亲密度并锁定长期需求的更高服务层级。
常温运输网路将维持其2025年价值的63.40%,这反映了在标准温度下安全运输干货、家居用品和个人保健产品的优势。统一的通讯协定和高容积利用率实现了规模经济,从而能够进行更密集的路线规划并降低单位成本。营运商优先考虑存货周转演算法和污染控制,以确保高週转率SKU的产品品质。货架设计和即时状态监控方面的同步基础设施升级,进一步提高了运转率并减少了废弃物。
同时,受消费者对加工食品和原料药(API)等需要冷藏运输的药品的需求推动,到2031年,冷藏物流的复合年增长率将达到4.45%。投资重点集中在高层冷冻库、自动化托盘穿梭车和配备远端资讯处理系统的冷藏货柜(可实现门到门-18°C的低温运输)。高效节能的冷媒和可再生能源设施将有助于降低营运成本并实现环境、社会和治理(ESG)目标。冷藏和超低温物流将分别满足乳製品、生鲜食品和生技药品等细分市场的需求,并强化多层次的服务组合,从而为快速消费品(FMCG)物流市场的供应商拓展收入来源。
区域分析
到2025年,亚太地区将占全球营收的36.20%,并维持最快的区域成长势头,到2031年年均复合成长率将达到4.63%。快速的都市化、不断壮大的中产阶级以及数位支付的广泛普及,正在推动对现代分销和电子商务的需求。高速铁路走廊、港口扩建和公路改善正在缩短运输时间、降低物流成本,刺激投资流入。雀巢马来西亚投资5,600万美元建设的巴生港枢纽,体现了现有(棕地)和新建(待开发区)设施扩容以同时服务区域出口和国内分销的趋势。
在北美,先进的基础设施、早期采用的数位化视觉化工具以及永续性试点计画正在融合发展。 Green Line为亿滋印度公司部署液化天然气卡车,与美国-加拿大路线上正在推行的类似碳减排倡议遥相呼应。在欧洲,碳边境调节机制(CBAM)和循环经济指令等法规环境正鼓励营运商升级到低排放量车辆并实现仓库电气化。密集型跨境运输需要完善的单证和即时海关整合,以避免英国脱欧后可能出现的拥塞和新制裁带来的复杂情况。
在南美洲,不断增长的线上需求推动了对保税仓库和「最后一公里」众包车辆的需求,从而绕过了拥挤的城市高速公路。巴西2024年上半年的电子商务销售额达到286.6亿美元就印证了这一点。同时,中东和非洲的物流能力也在稳步提升,这得益于自由贸易区、机场物流园区以及捐助者资助的低温运输走廊,这些设施为生鲜食品和疫苗的运输提供了支持。虽然地域多角化降低了对单一经济週期的依赖风险,但要想在快速消费品物流市场取得成功,服务模式必须柔软性,以适应当地基础设施的差异和监管环境的差异。
其他福利:
- Excel格式的市场预测(ME)表
- 3个月的分析师支持
目录
第一章 引言
- 研究假设和市场定义
- 调查范围
第二章调查方法
第三章执行摘要
第四章 市场情势
- 市场概览
- 市场驱动因素
- 电子商务加速发展及对最后一公里配送的期望
- 第三方物流/合约物流在快速消费品产业的渗透
- 建构低温运输网络
- 端到端数位视觉化平台
- 重新设计中心辐射式网路主导本地消费
- 透过碳排放税整合配送中心网络
- 市场限制
- 燃油价格波动
- 跨境监管的复杂性
- 二、三线仓库劳动力短缺
- 第三方/第四方物流业者之间的资料互通性差距
- 价值/供应链分析
- 监管环境
- 技术展望
- 波特五力模型
- 新进入者的威胁
- 买方的议价能力
- 供应商的议价能力
- 替代品的威胁
- 竞争对手之间的竞争
- 专题报导:电子商务对快速消费品物流的影响
- 亮点——合约物流和综合物流的需求趋势
第五章 市场规模与成长预测
- 透过服务
- 运输
- 路
- 铁路
- 航空
- 海
- 仓储和配送
- 附加价值服务及更多
- 运输
- 透过温度控制
- 冷藏(0-5°C)
- 冷冻(-18 至 0°C)
- 环境的
- 冷冻/超低温产品(低于-20°C)
- 按产品类型
- 食品/饮料
- 个人护理
- 家居用品
- 非处方药和医疗保健
- 其他的
- 透过分销管道
- 在线的
- 离线
- 按地区
- 北美洲
- 美国
- 加拿大
- 墨西哥
- 南美洲
- 巴西
- 秘鲁
- 智利
- 阿根廷
- 其他南美洲
- 亚太地区
- 印度
- 中国
- 日本
- 澳洲
- 韩国
- 东南亚(新加坡、马来西亚、泰国、印尼、越南、菲律宾)
- 亚太其他地区
- 欧洲
- 英国
- 德国
- 法国
- 西班牙
- 义大利
- 比荷卢经济联盟(比利时、荷兰、卢森堡)
- 北欧国家(丹麦、芬兰、冰岛、挪威、瑞典)
- 其他欧洲地区
- 中东和非洲
- 阿拉伯聯合大公国
- 沙乌地阿拉伯
- 南非
- 奈及利亚
- 其他中东和非洲地区
- 北美洲
第六章 竞争情势
- 市场集中度
- 策略趋势
- 市占率分析
- 公司简介
- DHL Group
- Kuehne+Nagel
- DSV
- CH Robinson
- Ceva Logistics
- XPO Logistics
- Rhenus Logistics
- FM Logistic
- Hellmann Worldwide Logistics
- Penske Logistics
- Kenco Logistics
- JD Logistics
- FedEx Supply Chain
- Nippon Express
- Yusen Logistics
- Geodis
- GXO Logistics
- Savino Del Bene
- ID Logistics Group
- Brimich Logistics
第七章 市场机会与未来展望
The FMCG Logistics Market is expected to grow from USD 1.37 trillion in 2025 to USD 1.44 trillion in 2026 and is forecast to reach USD 1.84 trillion by 2031 at 5.03% CAGR over 2026-2031.
Robust e-commerce uptake, rapid urbanization, and rising middle-class consumption are reshaping distribution models, pushing companies toward technology-enabled, sustainability-minded supply chains that deliver end-to-end visibility and faster fulfillment. Transportation services continue to dominate value creation, while value-added offerings such as co-packing and labeling gain momentum as brands seek customization closer to demand. Cold-chain build-outs unlock growth in frozen and healthcare categories, and digital visibility platforms foster predictive decision-making that lowers waste and stockouts. Intensifying competition and recent megamergers encourage scale economies even as regional specialists retain an edge in localized, last-mile agility within the FMCG logistics market.
Global FMCG Logistics Market Trends and Insights
E-commerce Acceleration and Last-Mile Expectations
Faster online growth compresses delivery windows and fragments order profiles, forcing the FMCG logistics market to pivot toward urban micro-fulfillment and same-day drops. Brazil's FMCG online sales rose 13.6% in H1 2024, with health & beauty up 17.8% and food up 26.2%. Providers are staging inventory in forward hubs, layering in electric vans, and rolling out real-time tracking to satisfy consumers who now expect precision and sustainability together. Investment flows into route-optimization platforms and reverse-logistics capabilities that help balance bulk B2B replenishment with escalating direct-to-consumer volumes. These shifts embed competitive stakes for asset-light brands that rely on partners for last-mile excellence within the FMCG logistics market.
3PL / Contract-Logistics Penetration in FMCG
Brands increasingly convert fixed logistics costs to variable spend by outsourcing to 3PLs, unlocking scale and specialized expertise across multiple geographies. McLane's 2025 agreement with Circle K illustrates the appeal of integrated transportation and distribution solutions that bundle inventory visibility and fleet optimization. Contract logistics players differentiate through co-packing, promotional bundling, and omnichannel returns, creating sticky, multi-year relationships. The model relieves FMCG firms from capital commitments while ensuring rapid deployment of automation, compliance systems, and analytics an arrangement that accelerates the FMCG logistics market evolution toward service-rich ecosystems.
Fuel-Price Volatility
Diesel cost swings weigh on transport budgets, with fuel accounting for roughly 25% of trucking operating expenses worldwide. Surcharge formulas and hedging contracts cushion some exposure, yet timing gaps often spark rate tensions between carriers and FMCG shippers. Currency shifts complicate cost calculations on cross-border lanes, prompting greater adoption of route-optimization software, alternative fuels such as LNG, and network redesigns that slash empty miles. Price unpredictability therefore tempers investment appetites and erodes margins across the FMCG logistics market.
Other drivers and restraints analyzed in the detailed report include:
- Cold-Chain Network Build-Out
- End-to-End Digital Visibility Platforms
- Cross-Border Regulatory Complexity
For complete list of drivers and restraints, kindly check the Table Of Contents.
Segment Analysis
Transportation generated 66.35% of 2025 revenue, underscoring its foundational role in moving high-turnover goods through sprawling distribution webs. Road freight anchors the network, bridging manufacturing hubs, regional DCs, and last-mile nodes, while sea and rail support bulk intercontinental moves. Competitive differentiation now hinges on multi-modal integration, sustainable fleet upgrades, and data-rich route planning that trims transit variance. Value-added services, though smaller, expand at a 4.74% CAGR as brands seek co-packing, labeling, and kitting near demand centers to shrink lead times and marketing risks. This blend of core haulage with tailored services positions providers to capture greater share of the FMCG logistics market.
Intensifying omnichannel activity propels order-profile complexity, boosting needs for postponed configuration and returns management. Investments in automated sortation, collaborative robots, and quality-assurance cells inside warehouses translate into faster throughput and reduced mismatch errors. Providers capable of bundling transport, storage, and customization in a single contract deepen stickiness while growing wallet share. Consequently, the transportation segment remains the backbone, but high-margin growth tilts toward service layers that raise customer intimacy and lock in long-term demand within the FMCG logistics market.
Ambient networks retained 63.40% of 2025 value, reflecting the dominance of dry groceries, household goods, and personal-care items that travel safely at standard temperatures. Scale efficiencies stem from uniform handling protocols and high cube utilization, allowing dense route planning and lower unit costs. Operators prioritize inventory rotation algorithms and contamination controls to preserve product integrity across high-velocity SKUs. Parallel infrastructure upgrades in racking design and real-time condition monitoring drive uptime gains and shrink waste.
Conversely, frozen logistics logs a 4.45% CAGR to 2031, riding consumer appetite for convenience foods and API-based pharmaceuticals requiring sub-zero transit. Investment pours into high-bay freezers, automated pallet shuttles, and telematics-equipped reefers that maintain <-18 °C thresholds door-to-door. Energy-efficient refrigerants and renewable-powered facilities help offset operating costs and meet ESG targets. Chilled and ultra-low categories sustain niche demand for dairy, fresh produce, and biologics, respectively, reinforcing a tiered service mix that broadens provider revenue channels across the FMCG logistics market.
The FMCG Logistics Market Report is Segmented by Service (Transportation, Warehousing & Distribution, Value-Added Services), Temperature Control (Chilled, Frozen, and More), Product Category (Food & Beverage, Personal Care, and More), Distribution Channel (Online, Offline), and Geography (North America, South America, Asia-Pacific, Europe, Middle East and Africa). The Market Forecasts are Provided in Terms of Value (USD).
Geography Analysis
Asia-Pacific generated 36.20% of 2025 global revenue and sustains the fastest regional momentum at a 4.63% CAGR to 2031. Rapid urbanization, burgeoning middle classes, and digital payment ubiquity accelerate demand for modern trade and e-commerce alike. High-speed rail corridors, port expansions, and highway upgrades cut transit times and reduce logistics costs, propelling investment inflows. Nestle Malaysia's USD 56 million Port Klang hub underscores the wave of brownfield and greenfield capacity designed to serve regional exports and domestic distribution simultaneously.
North America combines advanced infrastructure with early adoption of digital visibility tools and sustainability pilots. LNG-powered truck deployments such as GreenLine's fleet for Mondelez India mirror similar carbon-cutting initiatives across U.S. and Canadian lanes. Europe's regulatory environment, led by CBAM and circular-economy directives, nudges providers toward low-emission fleet renewals and warehouse electrification. Dense cross-border traffic demands impeccable documentation and real-time customs integration to avert post-Brexit congestion and emerging sanctions complexities.
South America's rising online propensity, evidenced by Brazil's USD 28.66 billion H1 2024 e-commerce haul, drives demand for bonded warehouses and last-mile crowdsourced fleets that bypass congested urban arterials. Meanwhile, Middle East & Africa witness incremental but steady capacity additions tied to free-trade zones, airport-centric logistics parks, and donor-funded cold-chain corridors supporting fresh produce and vaccines. Collectively, geographic diversification mitigates exposure to any single economic cycle, but service models must flex to local infrastructure gaps and regulatory heterogeneity to thrive in the FMCG logistics market.
- DHL Group
- Kuehne + Nagel
- DSV
- C.H. Robinson
- Ceva Logistics
- XPO Logistics
- Rhenus Logistics
- FM Logistic
- Hellmann Worldwide Logistics
- Penske Logistics
- Kenco Logistics
- JD Logistics
- FedEx Supply Chain
- Nippon Express
- Yusen Logistics
- Geodis
- GXO Logistics
- Savino Del Bene
- ID Logistics Group
- Brimich Logistics
Additional Benefits:
- The market estimate (ME) sheet in Excel format
- 3 months of analyst support
TABLE OF CONTENTS
1 Introduction
- 1.1 Study Assumptions and Market Definition
- 1.2 Scope of the Study
2 Research Methodology
3 Executive Summary
4 Market Landscape
- 4.1 Market Overview
- 4.2 Market Drivers
- 4.2.1 E-commerce acceleration and last-mile expectations
- 4.2.2 3PL / contract-logistics penetration in FMCG
- 4.2.3 Cold-chain network build-out
- 4.2.4 End-to-end digital visibility platforms
- 4.2.5 Rural consumption-led hub-and-spoke redesign
- 4.2.6 Carbon-tax-driven DC network consolidation
- 4.3 Market Restraints
- 4.3.1 Fuel-price volatility
- 4.3.2 Cross-border regulatory complexity
- 4.3.3 Tier-2/3 warehouse labour shortages
- 4.3.4 Data-interoperability gaps across 3PL/4PLs
- 4.4 Value / Supply-Chain Analysis
- 4.5 Regulatory Landscape
- 4.6 Technological Outlook
- 4.7 Porter's Five Forces
- 4.7.1 Threat of New Entrants
- 4.7.2 Bargaining Power of Buyers
- 4.7.3 Bargaining Power of Suppliers
- 4.7.4 Threat of Substitutes
- 4.7.5 Competitive Rivalry
- 4.8 Spotlight-Impact of E-commerce on FMCG Logistics
- 4.9 Spotlight-Contract and Integrated Logistics Demand
5 Market Size and Growth Forecasts
- 5.1 By Service (Value)
- 5.1.1 Transportation
- 5.1.1.1 Road
- 5.1.1.2 Rail
- 5.1.1.3 Air
- 5.1.1.4 Sea
- 5.1.2 Warehousing and Distribution
- 5.1.3 Value-added Services and Others
- 5.1.1 Transportation
- 5.2 By Temperature Control (Value)
- 5.2.1 Chilled (0-5 °C)
- 5.2.2 Frozen (-18-0°C)
- 5.2.3 Ambient
- 5.2.4 Deep-Frozen / Ultra-Low (less than-20 °C)
- 5.3 By Product Category (Value)
- 5.3.1 Food and Beverage
- 5.3.2 Personal Care
- 5.3.3 Household Care
- 5.3.4 OTC and Healthcare
- 5.3.5 Others
- 5.4 By Distribution Channel (Value)
- 5.4.1 Online
- 5.4.2 Offline
- 5.5 By Geography (Value)
- 5.5.1 North America
- 5.5.1.1 United States
- 5.5.1.2 Canada
- 5.5.1.3 Mexico
- 5.5.2 South America
- 5.5.2.1 Brazil
- 5.5.2.2 Peru
- 5.5.2.3 Chile
- 5.5.2.4 Argentina
- 5.5.2.5 Rest of South America
- 5.5.3 Asia-Pacific
- 5.5.3.1 India
- 5.5.3.2 China
- 5.5.3.3 Japan
- 5.5.3.4 Australia
- 5.5.3.5 South Korea
- 5.5.3.6 South East Asia (Singapore, Malaysia, Thailand, Indonesia, Vietnam, and Philippines)
- 5.5.3.7 Rest of Asia-Pacific
- 5.5.4 Europe
- 5.5.4.1 United Kingdom
- 5.5.4.2 Germany
- 5.5.4.3 France
- 5.5.4.4 Spain
- 5.5.4.5 Italy
- 5.5.4.6 BENELUX (Belgium, Netherlands, and Luxembourg)
- 5.5.4.7 NORDICS (Denmark, Finland, Iceland, Norway, and Sweden)
- 5.5.4.8 Rest of Europe
- 5.5.5 Middle East and Africa
- 5.5.5.1 United Arab of Emirates
- 5.5.5.2 Saudi Arabia
- 5.5.5.3 South Africa
- 5.5.5.4 Nigeria
- 5.5.5.5 Rest of Middle East And Africa
- 5.5.1 North America
6 Competitive Landscape
- 6.1 Market Concentration
- 6.2 Strategic Moves
- 6.3 Market Share Analysis
- 6.4 Company Profiles (includes Global level Overview, Market level overview, Core Segments, Financials as available, Strategic Information, Market Rank/Share for key companies, Products and Services, and Recent Developments)
- 6.4.1 DHL Group
- 6.4.2 Kuehne + Nagel
- 6.4.3 DSV
- 6.4.4 C.H. Robinson
- 6.4.5 Ceva Logistics
- 6.4.6 XPO Logistics
- 6.4.7 Rhenus Logistics
- 6.4.8 FM Logistic
- 6.4.9 Hellmann Worldwide Logistics
- 6.4.10 Penske Logistics
- 6.4.11 Kenco Logistics
- 6.4.12 JD Logistics
- 6.4.13 FedEx Supply Chain
- 6.4.14 Nippon Express
- 6.4.15 Yusen Logistics
- 6.4.16 Geodis
- 6.4.17 GXO Logistics
- 6.4.18 Savino Del Bene
- 6.4.19 ID Logistics Group
- 6.4.20 Brimich Logistics
7 Market Opportunities and Future Outlook
- 7.1 White-space and Unmet-Need Assessment


