


 |
市场调查报告书
商品编码
1910606
硬体即服务 (HaaS):市场占有率分析、产业趋势与统计、成长预测 (2026-2031)Hardware-as-a-Service (HaaS) - Market Share Analysis, Industry Trends & Statistics, Growth Forecasts (2026 - 2031) |
||||||
※ 本网页内容可能与最新版本有所差异。详细情况请与我们联繫。
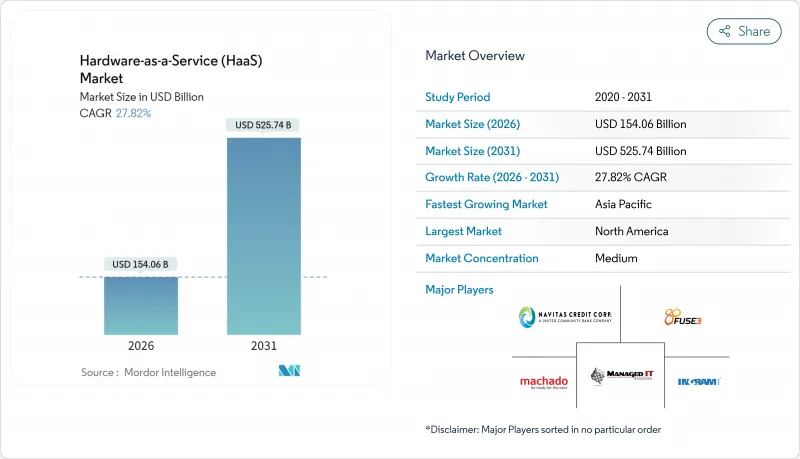
2025 年硬体即服务市场价值 1,205.4 亿美元,预计到 2031 年将达到 5,257.4 亿美元,而 2026 年为 1,540.6 亿美元。
预测期(2026-2031 年)的复合年增长率预计为 27.82%。
这种快速成长反映出企业正将资本密集硬体采购转向可预测的订阅模式,而这主要得益于混合办公模式的安全需求以及财务长对营运支出柔软性的追求。政府主导的人工智慧项目,例如加拿大为国内超级运算拨款17亿加元,正在刺激国内基础设施需求;而美国《晶片科学法案》提供的500亿美元奖励,则促使製造商转向订阅式机器人技术,以在不耗尽现金储备的情况下实现工厂现代化。资产支援证券化正在推动硬体即服务市场的发展,DLL计画于2024年发行21.5亿美元的证券,这将降低供应商的资金筹措成本,并促进价格竞争。欧盟的循环经济法规也是推动这一趋势的重要因素,因为这种模式符合强制性的耐用性和可维修性标准。
全球硬体即服务 (HaaS) 市场趋势与洞察
订阅模式允许公司将资本支出(CapEx)转换为营运支出(OpEx)。
到 2024 年,美国54% 的设备采购将采用租赁方式,而非购买,这表明租赁模式正显着转向营运支出。订阅协议能够释放资金用于战略计划,并保护买家免受设备快速折旧免税额。戴尔 APEX 客户报告称,其服务台工作量减少了 50%,支援成本降低了 30%,这表明以结果为导向的伙伴关係正在取代一次性销售。在设备快速更新换代的产业,这种优势更为显着,使得硬体即服务 (HaaS) 市场成为抵御技术风险的策略性避险工具。
混合办公安全法规正在缩短设备的使用寿命。
分散式办公模式增加了终端安全威胁的风险,并将更新週期缩短至四年以内。惠普推出抗量子攻击韧体,以应对未来的解密风险,并强调装置更新内建的安全保障[HP.COM]。 70%的中小型企业计划长期推行远距办公政策,增加了对託管更新服务的需求。
中小企业对HaaS的整体成本效益缺乏认识。
经合组织指出,数位落差依然存在,原因是中小企业缺乏评估订阅提案所需的资金筹措技能和人力资源。这种错配减缓了成本敏感地区的普及速度,但供应商提供的评估工具和政府补贴正在缩小知识差距。
细分市场分析
截至2025年,设备即服务(DaaS)将占据硬体即服务(HaaS)市场份额的31.74%。同时,受小规模工厂自动化兴起和低成本协作机器人广泛应用的推动,机器人即服务(RaaS)预计将以29.35%的复合年增长率(CAGR)实现最快成长。 GPU即服务(GPU as a Service)的硬体即服务市场规模正随着人工智慧(AI)工作负载的扩展而成长,GPU订阅市场预计将从2025年的43.1亿美元成长到2031年的498.4亿美元。专业服务透过部署、监控和优化等功能为该硬体产品提供全面支持,从而提高运转率。
订阅模式的创新也延伸到了平台级服务领域。西门子Senseye每分钟可处理超过一百万个感测器资料点,展现了预测分析如何将原始硬体转化为工业性能保障。这种架构转变将价值从所有权转移到使用权,使硬体即服务(HaaS)市场扎根于以结果为导向的经济模式,并将竞争优势向兼具分析和财务专业知识的供应商倾斜。
到 2025 年,本地部署将占据 44.85% 的市场份额,这凸显了金融和医疗保健等行业对合规性和延迟的敏感度。然而,结合了本地控制和云端弹性的混合/网路即服务 (NaaS) 模型将继续以 25.9% 的复合年增长率成长。联想 ThinkAgile MX455 V3 展示了工作负载可移植性如何定义现代采购:它将 AI 推理部署在边缘,同时将训练工作负载扩展到 Azure。
云端管理的硬体服务对于应对容量激增和简化更新仍然至关重要,但资料主权法律规定某些工作负载必须保留在本地。 IBM 的 Power Virtual Server 本机部署 pod 表明,即使是公共云端供应商也提供在地化订阅以满足资料主权要求。因此,硬体即服务 (HaaS) 市场正从非此即彼的思维模式转向资产可以动态迁移的连续模式。
区域分析
到2025年,北美将维持41.72%的硬体即服务(HaaS)市场份额,这得益于其完善的租赁生态系统和鼓励国内製造业发展的联邦奖励。目前,美国超过一半的设备采购已透过租赁方式完成,订阅模式也日趋成熟。政府对半导体和先进製造业的补贴正在推动对柔性机器人和边缘设备的需求。
亚太地区是成长最快的区域,复合年增长率达19.15%。中国的资本更新计画旨在2027年将资本财支出增加25%,而印度为支持数位支付而进行的数据中心扩张,将创造强劲的订阅管道。台湾在伺服器製造领域的领先地位,为设备即服务(DaaS)集群的全球物流链提供了支持,进一步将该地区与不断扩张的全球硬体即服务(HaaS)市场联繫起来。
欧洲的发展趋势受到循环经济法规的驱动,这些法规正引导企业转向以服务为基础的所有权模式。将于2024年7月生效的《永续产品生态设计》法规要求产品具备长寿命、可维修性和备件供应能力,这与包含维护服务的服务合约直接相关。擅长管理回收循环并提供翻新产品的供应商将受益于该法规,从而使欧洲成为以永续性主导的订阅创新模式的试验场。
其他福利:
- Excel格式的市场预测(ME)表
- 3个月的分析师支持
目录
第一章 全球硬体即服务 (HaaS) 市场
第二章 引言
- 研究假设和市场定义
- 调查范围
第三章调查方法
第四章执行摘要
第五章 市场情势
- 市场概览
- 市场驱动因素
- 基于订阅的硬体采购模式将企业的支出模式从资本支出(CapEx)转变为营运支出(OpEx)。
- 混合办公模式的安全需求导致设备生命週期缩短。
- 工业HaaS领域创业投资资金筹措与资产支持证券化模式的兴起
- 政府的回流政策透过HaaS加速了自动化进程。
- 促进产品转型为服务的循环经济法规
- 利用嵌入式物联网分析实现预测性维护合约
- 市场限制
- 中小企业对HaaS的整体成本效益认识不足。
- 供应商锁定和复杂的终止条款
- 不断上涨的资本成本正在挤压供应商的利润率。
- 订阅式硬体资产的会计准则不一致
- 产业价值/价值链分析
- 监管环境
- 技术展望
- 波特五力分析
- 供应商的议价能力
- 消费者议价能力
- 新进入者的威胁
- 替代品的威胁
- 竞争对手之间的竞争
第六章 市场规模与成长预测
- 报价
- 硬体型号
- 设备即服务 (DaaS)
- 桌面/PC即服务
- 基础设施硬体即服务 (I-HaaS)
- 平台硬体即服务 (P-HaaS)
- 机器人即服务(RaaS)
- GPU 即服务 (GPUaaS)
- 专业服务
- 硬体型号
- 透过部署模式
- 本地部署
- 云端管理
- 混合/网路即服务
- 按最终用户公司规模划分
- 大公司
- 小型企业
- 按最终用户行业划分
- 零售和批发
- 教育
- 银行、金融服务和保险(BFSI)
- 製造业
- 医疗保健和生命科学
- 资讯科技/通讯
- 政府和公共部门
- 其他行业(能源、建筑等)
- 按地区
- 北美洲
- 美国
- 加拿大
- 墨西哥
- 欧洲
- 德国
- 英国
- 法国
- 俄罗斯
- 其他欧洲
- 亚太地区
- 中国
- 日本
- 印度
- 韩国
- 澳洲
- 亚太其他地区
- 中东和非洲
- 中东
- 沙乌地阿拉伯
- 阿拉伯聯合大公国
- 其他中东地区
- 非洲
- 南非
- 埃及
- 其他非洲地区
- 中东
- 南美洲
- 巴西
- 阿根廷
- 南美洲其他地区
- 北美洲
第七章 竞争情势
- 市场集中度
- 策略趋势
- 市占率分析
- 公司简介
- Dell Technologies Inc.
- HP Inc.
- Lenovo Group Limited
- Fujitsu Limited
- Microsoft Corporation
- Cisco Systems, Inc.
- Amazon.com, Inc.(AWS Devices & Services)
- Hewlett Packard Enterprise Company
- Arrow Electronics, Inc.
- Ingram Micro Inc.
- Navitas Credit Corp.
- PhoenixNAP, LLC
- FUSE3 Communications, LLC
- Design Data Systems, Inc.
- Machado Consulting, Inc.
- Managed IT Solutions, Inc.
- Formic Technologies, Inc.
- Flex Ltd.
- Zscaler, Inc.
- Google LLC(ChromeOS & DaaS alliances)
第八章:市场机会与未来趋势
- 评估差距和未满足的需求
The hardware as a service market was valued at USD 120.54 billion in 2025 and estimated to grow from USD 154.06 billion in 2026 to reach USD 525.74 billion by 2031, at a CAGR of 27.82% during the forecast period (2026-2031).
The leap reflects enterprises converting capital-intensive hardware purchases into predictable subscriptions, a shift accelerated by hybrid-work security mandates and CFO preference for operating-expense flexibility. Sovereign AI programs, such as Canada's CAD 1.7 billion allocation for domestic super-computing, are stimulating home-grown infrastructure demand, while the U.S. CHIPS and Science Act's USD 50 billion incentives are pushing manufacturers toward subscription robotics to modernize plants without depleting cash reserves. Asset-backed securitization is scaling the hardware as a service market, with DLL issuing USD 2.15 billion in notes during 2024, lowering providers' cost of funds and enabling competitive pricing. Circular-economy regulation in the EU is another catalyst because the model aligns with mandated durability and repairability standards.
Global Hardware-as-a-Service (HaaS) Market Trends and Insights
Enterprises shift CapEx to OpEx with subscriptions
Leasing overtook purchasing for 54% of U.S. equipment acquisitions in 2024, illustrating the pivot to operational expenses Subscription contracts free capital for strategic projects and shield buyers from rapid depreciation. Dell APEX customers report a 50% cut in help-desk load and 30% lower support costs, showing that outcome-oriented partnerships replace one-off sales. The benefit is amplified in sectors with fast obsolescence, making the hardware-as-a-service market a strategic hedge against technology risk.
Device lifecycle shortens under hybrid-work security rules
Distributed work raises endpoint threat exposure, compressing refresh cycles below four years. HP introduced quantum-resistant firmware to counter future decryption risks, underscoring the security premium now baked into device turnover [HP.COM]. Seventy percent of SMEs plan permanent remote-work policies that intensify the need for managed refresh services.
Limited SME awareness of HaaS total-cost benefits
OECD notes that digital gaps linger because SMEs lack the financing skills and staff capacity to evaluate subscription proposals. The mismatch slows adoption in cost-sensitive regions, though provider-run assessment tools and government grants are shrinking the knowledge gap.
Other drivers and restraints analyzed in the detailed report include:
- VC funding and securitization boost industrial HaaS
- Government on-shoring incentives accelerate automation
- Vendor lock-in and complex exit terms
For complete list of drivers and restraints, kindly check the Table Of Contents.
Segment Analysis
Device-as-a-Service captured 31.74 of of % hardware as a service market share in 2025. Robot-as-a-Service, however, posts the fastest 29.35% CAGR, powered by small-factory automation and cheaper collaborative robots. The hardware as a service market size for GPU-as-a-Service is scaling alongside AI workloads; GPU subscriptions grew from USD 4.31 billion in 2025 to projections of USD 49.84 billion by 2031. Professional services wrap these hardware offerings with deployment, monitoring, and optimization that enhance uptime.
Subscription innovation extends to platform-level services. Siemens Senseye processes more than 1 million sensor points per minute, showing how predictive analytics converts raw hardware into industrial performance guarantees. The architecture shift elevates value from ownership to usage, anchoring the hardware as a service market in outcome-based economics and tilting competitive advantage toward vendors that bundle analytics and financing expertise.
On-premises deployments held a 44.85% share in 2025, a testament to compliance and latency sensitivities in industries such as finance and healthcare. Yet the hybrid/network-as-a-service model grows at 25.9% CAGR because it fuses local control with cloud elasticity. Lenovo's ThinkAgile MX455 V3 lets customers place AI inference at the edge while bursting training workloads to Azure, demonstrating how workload portability defines modern procurement.
Cloud-managed hardware services remain crucial for burst capacity and simplified updates, but data sovereignty law keeps certain workloads local. IBM's Power Virtual Server on-premise pod shows that even public-cloud vendors are packaging localized subscriptions to satisfy sovereignty mandates. The hardware as a service market is therefore shifting from an either-or mindset to a continuum where assets can relocate dynamically.
The Hardware As A Service Market Report is Segmented by Offering (Device-As-A-Service, Desktop/PC-as-a-Service, and More), Deployment Mode (On-Premises, Cloud-Managed, Hybrid/Network-as-a-Service), End-User Enterprise Size (Large Enterprises, Smes), End-User Industry (Retail and Wholesale, Education, and More), and Geography. The Market Forecasts are Provided in Terms of Value (USD).
Geography Analysis
North America retained a 41.72% share of the hardware as a service market in 2025, sustained by sophisticated leasing ecosystems and federal incentives that reward domestic production. Over half of U.S. equipment procurement already flows through leases, reinforcing subscription maturity. Government grants supporting semiconductor and advanced manufacturing multiply demand for flexible robotics and edge devices.
Asia-Pacific is the fastest-growing region, posting a 19.15% CAGR. China's equipment renewal plan that aims for 25% growth in capital goods spending by 2027, and India's data-center expansion to support digital payments, will generate robust subscription pipelines. Taiwan's dominance in server manufacturing supplies the global logistics chain for device-as-a-service fleets, further entwining the region with global hardware as a service market expansion
Europe's trajectory hinges on circular-economy regulations that push organizations toward service-based ownership. The Ecodesign for Sustainable Products Regulation effective July 2024 requires long life, repairability, and spare-parts availability, aligning directly with service contracts that embed maintenance. Providers adept at managing take-back loops and refurbishment enjoy regulatory tailwinds, marking Europe as a laboratory for sustainability-driven subscription innovation.
- Dell Technologies Inc.
- HP Inc.
- Lenovo Group Limited
- Fujitsu Limited
- Microsoft Corporation
- Cisco Systems, Inc.
- Amazon.com, Inc. (AWS Devices & Services)
- Hewlett Packard Enterprise Company
- Arrow Electronics, Inc.
- Ingram Micro Inc.
- Navitas Credit Corp.
- PhoenixNAP, LLC
- FUSE3 Communications, LLC
- Design Data Systems, Inc.
- Machado Consulting, Inc.
- Managed IT Solutions, Inc.
- Formic Technologies, Inc.
- Flex Ltd.
- Zscaler, Inc.
- Google LLC (ChromeOS & DaaS alliances)
Additional Benefits:
- The market estimate (ME) sheet in Excel format
- 3 months of analyst support
TABLE OF CONTENTS
1 Global Hardware-as-a-Service (HaaS) Market
2 INTRODUCTION
- 2.1 Study Assumptions and Market Definition
- 2.2 Scope of the Study
3 RESEARCH METHODOLOGY
4 EXECUTIVE SUMMARY
5 MARKET LANDSCAPE
- 5.1 Market Overview
- 5.2 Market Drivers
- 5.2.1 Enterprises shifting CapEx to OpEx through subscription-based hardware procurement
- 5.2.2 Device lifecycle shortening under hybrid-work security mandates
- 5.2.3 Rising VC funding and asset-backed securitisation models for industrial HaaS
- 5.2.4 Government on-shoring incentives accelerating automation via HaaS
- 5.2.5 Circular-economy regulations favouring product-as-a-service
- 5.2.6 Embedded IoT-analytics enabling predictive-maintenance contracts
- 5.3 Market Restraints
- 5.3.1 Limited SME awareness of HaaS total-cost benefits
- 5.3.2 Vendor lock-in and complex exit terms
- 5.3.3 Rising cost of capital compressing provider margins
- 5.3.4 Non-uniform accounting rules for subscription hardware assets
- 5.4 Industry Value / Supply-Chain Analysis
- 5.5 Regulatory Landscape
- 5.6 Technological Outlook
- 5.7 Porter's Five Forces Analysis
- 5.7.1 Bargaining Power of Suppliers
- 5.7.2 Bargaining Power of Consumers
- 5.7.3 Threat of New Entrants
- 5.7.4 Threat of Substitutes
- 5.7.5 Intensity of Competitive Rivalry
6 MARKET SIZE AND GROWTH FORECASTS (VALUE)
- 6.1 By Offering
- 6.1.1 Hardware Model
- 6.1.1.1 Device-as-a-Service (DaaS)
- 6.1.1.2 Desktop/PC-as-a-Service
- 6.1.1.3 Infrastructure-Hardware-as-a-Service (I-HaaS)
- 6.1.1.4 Platform-Hardware-as-a-Service (P-HaaS)
- 6.1.1.5 Robot-as-a-Service (RaaS)
- 6.1.1.6 GPU-as-a-Service (GPUaaS)
- 6.1.2 Professional Services
- 6.1.1 Hardware Model
- 6.2 By Deployment Mode
- 6.2.1 On-premises
- 6.2.2 Cloud-managed
- 6.2.3 Hybrid / Network-as-a-Service
- 6.3 By End-user Enterprise Size
- 6.3.1 Large Enterprises
- 6.3.2 SMEs
- 6.4 By End-User Industry
- 6.4.1 Retail and Wholesale
- 6.4.2 Education
- 6.4.3 Banking, Financial Services and Insurance (BFSI)
- 6.4.4 Manufacturing
- 6.4.5 Healthcare and Life Sciences
- 6.4.6 IT and Telecommunications
- 6.4.7 Government and Public Sector
- 6.4.8 Other Industries (Energy, Construction, etc.)
- 6.5 By Geography
- 6.5.1 North America
- 6.5.1.1 United States
- 6.5.1.2 Canada
- 6.5.1.3 Mexico
- 6.5.2 Europe
- 6.5.2.1 Germany
- 6.5.2.2 United Kingdom
- 6.5.2.3 France
- 6.5.2.4 Russia
- 6.5.2.5 Rest of Europe
- 6.5.3 Asia-Pacific
- 6.5.3.1 China
- 6.5.3.2 Japan
- 6.5.3.3 India
- 6.5.3.4 South Korea
- 6.5.3.5 Australia
- 6.5.3.6 Rest of Asia-Pacific
- 6.5.4 Middle East and Africa
- 6.5.4.1 Middle East
- 6.5.4.1.1 Saudi Arabia
- 6.5.4.1.2 United Arab Emirates
- 6.5.4.1.3 Rest of Middle East
- 6.5.4.2 Africa
- 6.5.4.2.1 South Africa
- 6.5.4.2.2 Egypt
- 6.5.4.2.3 Rest of Africa
- 6.5.4.1 Middle East
- 6.5.5 South America
- 6.5.5.1 Brazil
- 6.5.5.2 Argentina
- 6.5.5.3 Rest of South America
- 6.5.1 North America
7 COMPETITIVE LANDSCAPE
- 7.1 Market Concentration
- 7.2 Strategic Moves
- 7.3 Market Share Analysis
- 7.4 Company Profiles (includes Global level Overview, Market level overview, Core Segments, Financials as available, Strategic Information, Market Rank/Share for key companies, Products and Services, and Recent Developments)
- 7.4.1 Dell Technologies Inc.
- 7.4.2 HP Inc.
- 7.4.3 Lenovo Group Limited
- 7.4.4 Fujitsu Limited
- 7.4.5 Microsoft Corporation
- 7.4.6 Cisco Systems, Inc.
- 7.4.7 Amazon.com, Inc. (AWS Devices & Services)
- 7.4.8 Hewlett Packard Enterprise Company
- 7.4.9 Arrow Electronics, Inc.
- 7.4.10 Ingram Micro Inc.
- 7.4.11 Navitas Credit Corp.
- 7.4.12 PhoenixNAP, LLC
- 7.4.13 FUSE3 Communications, LLC
- 7.4.14 Design Data Systems, Inc.
- 7.4.15 Machado Consulting, Inc.
- 7.4.16 Managed IT Solutions, Inc.
- 7.4.17 Formic Technologies, Inc.
- 7.4.18 Flex Ltd.
- 7.4.19 Zscaler, Inc.
- 7.4.20 Google LLC (ChromeOS & DaaS alliances)
8 MARKET OPPORTUNITIES AND FUTURE TRENDS
- 8.1 White-space and Unmet-need Assessment
 IaaS(基础设施即服务)市场:按服务模式、工作负载、定价模式、销售管道、部署类型、组织规模和产业划分-2026-2032年全球市场预测
 2026年全球硬体即服务市场报告2026年全球基础设施即服务(IaaS)市场报告
 全球硬体即服务市场规模、份额、趋势和成长分析报告(2026-2034年)2026年全球硬体人工智慧(AI)市场报告全球基础设施即服务(IaaS)市场:市场规模、占有率、成长率、行业分析、依类型、应用和地区划分的分析以及未来预测(2026-2034)
 基础设施即服务 (IaaS) 市场 - 全球产业规模、份额、趋势、机会及预测(按组件类型、部署模式、公司规模、垂直产业、地区和竞争格局划分,2021-2031 年)
 全球硬体即服务(HaaS)市场
 2025 年至 2033 年基础设施即服务市场报告(按部署类型、解决方案、最终用户、垂直行业和地区)
 基础设施即服务 (IaaS):市场占有率分析、产业趋势、统计数据和成长预测 (2025-2030)