


 |
市场调查报告书
商品编码
1910612
工业电脑断层扫描(CT)-市场份额分析、产业趋势与统计、成长预测(2026-2031)Industrial Computed Tomography - Market Share Analysis, Industry Trends & Statistics, Growth Forecasts (2026 - 2031) |
||||||
※ 本网页内容可能与最新版本有所差异。详细情况请与我们联繫。
2025 年工业电脑断层扫描 (CT) 市值为 5.4775 亿美元,预计到 2031 年将达到 8.9859 亿美元,高于 2026 年的 5.9486 亿美元。
预计在预测期(2026-2031 年)内,复合年增长率将达到 8.60%。
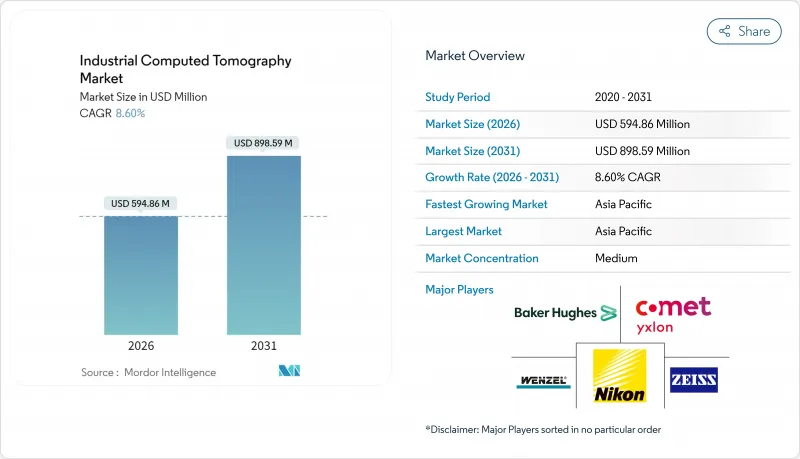
这种强劲的成长反映了CT技术从一种小众侦测工具转向航太、汽车、电子和增材製造等行业主流品质保证平台的转变。推动需求成长的因素包括:电动车供应链中日益严格的电池安全法规、积层製造技术的普及(需要体积检验)、基于人工智慧的自动化缺陷识别(可缩短週期时间)以及微型化电子产品对亚微米解析度检测的需求。系统供应商也受益于更快的检测器技术、可在单次扫描中分离材料的双能源来源以及硬体价格的下降,这些因素使得小型製造商也能采用该技术。高昂的初始投资成本和全球训练有素的CT操作员短缺限制了CT技术的普及,但租赁和X射线即服务等资金筹措模式正在扩大基本客群。目前,亚太地区在收入方面主导,其中中国、日本和韩国的成长速度最快,这得益于它们在电子和精密製造生产线中部署CT技术。
全球工业电脑断层扫描(CT)市场趋势与洞察
航太和汽车产业对无损检测的需求日益增长
民航机计画正在利用CT技术检验复合材料机翼和3D列印支架,将检测方法从辅助检测转变为首件检验和生产的关键环节。汽车製造商正在将CT技术的应用范围从引擎缸体铸件检测扩展到电池组检验,后者需要精确的内部几何图形来进行热传播分析。该技术能够检测碳纤维增强部件中亚毫米级的孔隙,有助于在满足AS9100和ISO/TS 16949品质标准的同时,实现轻量化目标。
扩大增材製造品管的应用
通用电气LEAP引擎燃油喷嘴的生产检测案例表明,工业CT是3D列印金属零件逐层缺陷检测的参考工具。即时重建和自动缺陷分类将扫描到决策的时间从8小时缩短至2小时,使CT技术能够应用于大规模积层製造生产线。 ISO/ASTM 52900标准纳入了CT验收标准,使其成为一项合规性要求,而非可选检查。
高功率CT系统的购置与营运成本高
一台解析度低于10微米的仪器造价在150万美元到300万美元之间,其中包括屏蔽、安全系统和设备维修。每年更换的电子管和100千瓦的电力消耗会增加运作成本。租赁协议可以分期付款,但会增加总拥有成本并限制日程安排的柔软性。
细分市场分析
到2025年,高压设备(300kV以上)将占据工业CT市场62.15%的份额,这主要得益于对深度渗透性的需求,例如航太钢铸件和厚壁铝製部件。中低压设备所占份额较小,但预计到2031年将以9.78%的复合年增长率成长,这主要得益于电子元件生产线中桌面系统的兴起。 Lumafield售价低于10万美元的桌上型扫描器透过降低经济门槛,扩大了潜在市场。结构化阳极技术提高了散热性能,使160kV和225kV的设备无需额外冷却即可对聚合物和铝进行成像。
高压设备的拥有者为了获得高密度元件的清晰图像,将接受面积较大的设备以及相应的屏蔽措施;而专门从事电路基板和塑料组装分析的实验室则会选择低能耗设备,因为其体积小巧且运行成本更低。这种层级构造的趋势将持续影响供应商的产品系列和资金筹措模式,直到2031年。
到2025年,缺陷检测的需求将占总需求的47.65%,这主要得益于其在铸造和复合材料检测中的重要角色。同时,随着汽车製造商和电子产品製造商转向以生产为基础的计量方式,组装分析预计将以10.05%的复合年增长率成长。电池组製造商在电池组密封前会绘製电芯位置和焊接位置的完整性图,以预防事故。微电子生产线正在将CT体素与CAD数据进行比较,以产生晶粒堆迭装置的自动化GD&T报告。
研究机构的故障分析部门虽然规模较小,但却是重要的使用者群体,他们在现场发生故障时会应用CT进行故障排查和分析。新型药物输送装置和医疗植入是另一个规模小规模但成长迅速的领域,它们也需要进行无损内部检测。
区域分析
预计到2025年,亚太地区将占全球收入的36.85%,并在2031年之前以11.76%的复合年增长率持续增长,这主要得益于中国电子和电动汽车供应链、日本精密汽车製造业以及韩国存储器代工厂的强劲发展。中国的GB38031-2025电池法规正在推动本土电动车领先企业加大对电池组检验单元的CT投资。日本OEM厂商正在利用µ-CT技术确保混合动力平台中复合材料的组装和表面光洁度,而韩国晶圆厂则利用micro-CT技术检验3D NAND快闪记忆体堆迭结构。
北美占据了相当大的市场份额,波音和洛克希德·马丁等航太巨头需要对复合材料机翼和3D列印的Ti-6Al-4V支架进行高解析度检测。美国也在人工智慧缺陷识别技术的应用方面处于领先地位,一些Start-Ups正在将基于云端的分析整合到CT工作流程中。墨西哥的电动车电池生产线以及加拿大的民用和航太丛集也进一步推动了该地区的需求。
欧洲市场正稳步成长,德国汽车製造商正在验证铝製引擎外壳和晶粒电池机壳。欧盟电池法规2023/1542要求更广泛的安全检验,通常会采用电脑断层扫描来侦测内部短路。一家法国一级航太产业供应商正在复合复合材料风扇叶片上应用双能CT技术,而英国创新署(Innovate 英国)正在资助一个公私合作实验室,以改进用于增材製造零件的在线连续CT技术。
其他福利:
- Excel格式的市场预测(ME)表
- 3个月的分析师支持
目录
第一章 引言
- 研究假设和市场定义
- 调查范围
第二章调查方法
第三章执行摘要
第四章 市场情势
- 市场概览
- 市场驱动因素
- 航太和汽车产业对无损检测的需求日益增长
- 增材製造中品管的日益普及
- 检测器解析度和影像重建技术的进步
- 随着电子设备体积越来越小,微型CT检测变得不可或缺。
- 人工智慧驱动的自动缺陷识别可缩短週期时间
- 电动车(EV)供应链电池安全法规
- 市场限制
- 高功率电流互感器系统的高安装和运作成本
- 遵守辐射安全法规和设施维修的负担
- 熟练的CT操作员和数据分析师短缺
- 与新兴的兆赫和超音波技术的竞争
- 产业供应链分析
- 监管环境
- 技术展望
- 宏观经济因素的影响
- 波特五力分析
- 供应商的议价能力
- 买方的议价能力
- 新进入者的威胁
- 替代品的威胁
- 竞争对手之间的竞争
第五章 市场规模与成长预测
- 按电压范围
- 低压和中压(低于300千伏特)
- 高压(300千伏以上)
- 透过使用
- 缺陷检测/检验
- 故障分析
- 组装分析
- 其他用途
- 透过技术/扫描技术
- 扇形束CT
- 锥状射束CT
- 其他的
- 按最终用户行业划分
- 航太与国防
- 车
- 电子和半导体
- 医疗设备
- 学术研究机构
- 其他行业
- 按地区
- 北美洲
- 美国
- 加拿大
- 墨西哥
- 南美洲
- 巴西
- 阿根廷
- 南美洲其他地区
- 欧洲
- 德国
- 英国
- 法国
- 义大利
- 西班牙
- 俄罗斯
- 其他欧洲
- 亚太地区
- 中国
- 日本
- 印度
- 韩国
- 亚太其他地区
- 中东和非洲
- 中东
- 沙乌地阿拉伯
- 阿拉伯聯合大公国
- 土耳其
- 其他中东地区
- 非洲
- 南非
- 奈及利亚
- 其他非洲地区
- 中东
- 北美洲
第六章 竞争情势
- 市场集中度
- 策略趋势
- 市占率分析
- 公司简介
- Baker Hughes Company(Waygate Technologies)
- Carl Zeiss AG
- Nikon Corporation-Nikon Metrology NV
- Comet Group-Yxlon International GmbH
- Wenzel Group GmbH and Co. KG
- North Star Imaging Inc.
- Diondo GmbH
- Werth Messtechnik GmbH
- RX Solutions SAS
- VJ Technologies Inc.
- VisiConsult X-ray Systems and Solutions GmbH
- Rigaku Corporation
- Sanying Precision Instruments Co., Ltd.
- Aolong Radiative Instrument Group Co., Ltd.
- Seamark ZM Technology Co., Ltd.
- Royma Tech(Suzhou)Precision Co., Ltd.
- Shimadzu Corporation
- Hitachi High-Tech Corporation
- Thermo Fisher Scientific Inc.
- Lumafield Inc.
第七章 市场机会与未来展望
The industrial computed tomography market was valued at USD 547.75 million in 2025 and estimated to grow from USD 594.86 million in 2026 to reach USD 898.59 million by 2031, at a CAGR of 8.60% during the forecast period (2026-2031).
Robust expansion reflects the modality's transition from a niche inspection option to a mainstream quality-assurance platform in aerospace, automotive, electronics, and additive manufacturing workflows. Demand is driven by tighter battery-safety regulations for electric-vehicle supply chains, the surge of additive manufacturing that necessitates volumetric validation, AI-based automated defect recognition that reduces cycle time, and miniaturized electronics that require sub-micron resolution inspection. System vendors are also benefiting from faster detector technology, dual-energy sources that separate materials within a single scan, and declining hardware prices that make the modality accessible to smaller manufacturers. High initial capital costs and a global shortage of trained CT operators temper adoption; however, financing models such as leasing and X-as-a-service are broadening the customer base. The Asia-Pacific region leads in revenue today and exhibits the steepest growth curve, as China, Japan, and South Korea integrate CT into their electronics and precision manufacturing lines.
Global Industrial Computed Tomography Market Trends and Insights
Rising demand for non-destructive testing in aerospace and automotive
Commercial aircraft programs rely on CT to validate composite wings and 3D-printed brackets, converting the modality from supplementary inspection to a mandatory gate in first-article and serial production workflows. Automakers extend CT beyond engine-block casting checks to battery-pack validation, where thermal propagation analysis requires precise internal geometry mapping. The technology's ability to locate sub-millimeter voids in carbon-fiber-reinforced parts supports weight-reduction goals while meeting AS9100 and ISO/TS 16949 quality standards.
Growing adoption of additive manufacturing quality control
Industrial CT is the reference tool for layer-wise defect detection in 3D-printed metal parts, as demonstrated by GE's serial production inspection of LEAP engine fuel nozzles. Real-time reconstruction and automated defect classification cut scan-to-decision time from eight hours to two, making CT viable for higher-volume AM lines. ISO/ASTM 52900 standards incorporate CT acceptance criteria, making the modality a compliance requirement rather than an optional check.
High acquisition and operating cost of high-power CT systems
Installations capable of sub-10 µm resolution cost between USD 1.5 million and USD 3 million, once shielding, safety systems, and site upgrades are factored in. Annual tube replacement and 100 kW power consumption inflate running costs. Leasing spreads payments but raises the total cost of ownership and limits schedule flexibility.
Other drivers and restraints analyzed in the detailed report include:
- Advances in detector resolution and image reconstruction
- Miniaturization of electronics necessitating µ-CT inspection
- Radiation-safety compliance burden and facility upgrades
For complete list of drivers and restraints, kindly check the Table Of Contents.
Segment Analysis
High-voltage installations of>= 300 kV held a 62.15% industrial computed tomography market share in 2025, driven by the demand for aerospace steel castings and thick aluminum parts that require deep penetration. Low- to medium-voltage units account for a smaller slice but post a 9.78% CAGR to 2031 as desktop systems gain appeal in electronic lines. Lumafield's sub-USD 100,000 desktop scanners widen the addressable base by lowering the financial hurdle. Structured anode technology improves heat removal, allowing 160 kV and 225 kV units to image polymers and aluminum without adding a cooling burden.
High-voltage owners accept larger floor space and shielding needs in exchange for image clarity on dense parts, whereas labs focused on circuit boards and plastic assemblies choose lower-energy units for compactness and reduced operating costs. This two-tier dynamic shapes vendor portfolios and financing schemes through 2031.
Flaw detection retained 47.65% of the demand in 2025, thanks to its entrenched roles in casting and composite inspection. Assembly analysis, however, is forecast to climb at a 10.05% CAGR as automakers and electronics firms switch to volume-based metrology. Battery-pack builders map cell placement and weld alignment before sealing the pack to prevent thermal runaway events. Microelectronics lines compare CT voxels to CAD in automated GD&T reports for die-stack devices.
Failure-analysis groups at research institutes remain a niche but critical user set, applying CT to forensic teardown when field failures arise. New drug-delivery devices and medical implants form another small yet growing cluster seeking non-destructive interior confirmation.
The Industrial Computed Tomography Market Report is Segmented by Voltage Range (Low-Medium Voltage and High Voltage), Application (Flaw Detection/Inspection, Failure Analysis, and More), Technology/Scanning Technique (Fan-Beam CT, and More), End-User Industry (Aerospace and Defense, Automotive, and More), and Geography. The Market Forecasts are Provided in Terms of Value (USD).
Geography Analysis
Asia-Pacific generated 36.85% of 2025 revenue and is projected to compound at 11.76% CAGR through 2031 on the back of China's electronics and EV supply chain, Japan's precision car-making, and South Korea's memory fabs. China's GB38031-2025 battery rule prompts CT to invest in pack validation cells serving local EV leaders. Japanese OEMs utilize µ-CT to ensure composite fit and finish in hybrid platforms, while South Korean fabs rely on micro-CT to verify 3D NAND stacks.
North America posts a sizable share anchored by aerospace primes such as Boeing and Lockheed Martin, who demand high-resolution inspection for composite wings and 3D-printed Ti-6Al-4V brackets. The U.S. also leads the adoption of AI-assisted defect recognition, with startups integrating cloud-based analytics into CT workflows. Mexico's EV battery lines and Canada's civil and aerospace clusters further underpin regional demand.
Europe maintains steady growth as Germany's automakers verify aluminum engine housings and die-cast battery enclosures. The EU Battery Regulation 2023/1542 requires more extensive safety testing, often conducted via CT scans to detect internal shorts. France's aerospace tier-ones deploy dual-energy CT for composite fan blades, and the U.K.'s Innovate UK funding supports public-private labs refining in-line CT for additive manufacturing components.
- Baker Hughes Company (Waygate Technologies)
- Carl Zeiss AG
- Nikon Corporation - Nikon Metrology NV
- Comet Group - Yxlon International GmbH
- Wenzel Group GmbH and Co. KG
- North Star Imaging Inc.
- Diondo GmbH
- Werth Messtechnik GmbH
- RX Solutions SAS
- VJ Technologies Inc.
- VisiConsult X-ray Systems and Solutions GmbH
- Rigaku Corporation
- Sanying Precision Instruments Co., Ltd.
- Aolong Radiative Instrument Group Co., Ltd.
- Seamark ZM Technology Co., Ltd.
- Royma Tech (Suzhou) Precision Co., Ltd.
- Shimadzu Corporation
- Hitachi High-Tech Corporation
- Thermo Fisher Scientific Inc.
- Lumafield Inc.
Additional Benefits:
- The market estimate (ME) sheet in Excel format
- 3 months of analyst support
TABLE OF CONTENTS
1 INTRODUCTION
- 1.1 Study Assumptions and Market Definition
- 1.2 Scope of the Study
2 RESEARCH METHODOLOGY
3 EXECUTIVE SUMMARY
4 MARKET LANDSCAPE
- 4.1 Market Overview
- 4.2 Market Drivers
- 4.2.1 Rising demand for non-destructive testing in aerospace and automotive
- 4.2.2 Growing adoption of additive manufacturing quality control
- 4.2.3 Advances in detector resolution and image reconstruction
- 4.2.4 Miniaturisation of electronics necessitating µ-CT inspection
- 4.2.5 AI-driven automated defect recognition reducing cycle time
- 4.2.6 Battery-safety regulations for EV supply chains
- 4.3 Market Restraints
- 4.3.1 High acquisition and operating cost of high-power CT systems
- 4.3.2 Radiation-safety compliance burden and facility upgrades
- 4.3.3 Scarcity of skilled CT operators and data analysts
- 4.3.4 Competition from emerging terahertz and ultrasound modalities
- 4.4 Industry Supply Chain Analysis
- 4.5 Regulatory Landscape
- 4.6 Technological Outlook
- 4.7 Impact of Macroeconomic Factors
- 4.8 Porter's Five Forces Analysis
- 4.8.1 Bargaining Power of Suppliers
- 4.8.2 Bargaining Power of Buyers
- 4.8.3 Threat of New Entrants
- 4.8.4 Threat of Substitutes
- 4.8.5 Intensity of Competitive Rivalry
5 MARKET SIZE AND GROWTH FORECASTS (VALUE)
- 5.1 By Voltage Range
- 5.1.1 Low-Medium Voltage (Less than 300 kV)
- 5.1.2 High Voltage (Greater thann or Equal to 300 kV)
- 5.2 By Application
- 5.2.1 Flaw Detection / Inspection
- 5.2.2 Failure Analysis
- 5.2.3 Assembly Analysis
- 5.2.4 Other Applications
- 5.3 By Technology/Scanning Technique
- 5.3.1 Fan-Beam CT
- 5.3.2 Cone-Beam CT
- 5.3.3 Others
- 5.4 By End-user Industry
- 5.4.1 Aerospace and Defense
- 5.4.2 Automotive
- 5.4.3 Electronics and Semiconductors
- 5.4.4 Medical Devices
- 5.4.5 Academic and Research Institutes
- 5.4.6 Other Industries
- 5.5 By Geography
- 5.5.1 North America
- 5.5.1.1 United States
- 5.5.1.2 Canada
- 5.5.1.3 Mexico
- 5.5.2 South America
- 5.5.2.1 Brazil
- 5.5.2.2 Argentina
- 5.5.2.3 Rest of South America
- 5.5.3 Europe
- 5.5.3.1 Germany
- 5.5.3.2 United Kingdom
- 5.5.3.3 France
- 5.5.3.4 Italy
- 5.5.3.5 Spain
- 5.5.3.6 Russia
- 5.5.3.7 Rest of Europe
- 5.5.4 Asia-Pacific
- 5.5.4.1 China
- 5.5.4.2 Japan
- 5.5.4.3 India
- 5.5.4.4 South Korea
- 5.5.4.5 Rest of Asia-Pacific
- 5.5.5 Middle East and Africa
- 5.5.5.1 Middle East
- 5.5.5.1.1 Saudi Arabia
- 5.5.5.1.2 United Arab Emirates
- 5.5.5.1.3 Turkey
- 5.5.5.1.4 Rest of Middle East
- 5.5.5.2 Africa
- 5.5.5.2.1 South Africa
- 5.5.5.2.2 Nigeria
- 5.5.5.2.3 Rest of Africa
- 5.5.5.1 Middle East
- 5.5.1 North America
6 COMPETITIVE LANDSCAPE
- 6.1 Market Concentration
- 6.2 Strategic Moves
- 6.3 Market Share Analysis
- 6.4 Company Profiles (includes Global level Overview, Market level overview, Core Segments, Financials, Strategic Information, Market Rank/Share, Products and Services, Recent Developments)
- 6.4.1 Baker Hughes Company (Waygate Technologies)
- 6.4.2 Carl Zeiss AG
- 6.4.3 Nikon Corporation - Nikon Metrology NV
- 6.4.4 Comet Group - Yxlon International GmbH
- 6.4.5 Wenzel Group GmbH and Co. KG
- 6.4.6 North Star Imaging Inc.
- 6.4.7 Diondo GmbH
- 6.4.8 Werth Messtechnik GmbH
- 6.4.9 RX Solutions SAS
- 6.4.10 VJ Technologies Inc.
- 6.4.11 VisiConsult X-ray Systems and Solutions GmbH
- 6.4.12 Rigaku Corporation
- 6.4.13 Sanying Precision Instruments Co., Ltd.
- 6.4.14 Aolong Radiative Instrument Group Co., Ltd.
- 6.4.15 Seamark ZM Technology Co., Ltd.
- 6.4.16 Royma Tech (Suzhou) Precision Co., Ltd.
- 6.4.17 Shimadzu Corporation
- 6.4.18 Hitachi High-Tech Corporation
- 6.4.19 Thermo Fisher Scientific Inc.
- 6.4.20 Lumafield Inc.
7 MARKET OPPORTUNITIES AND FUTURE OUTLOOK
- 7.1 White-space and Unmet-need Assessment
 工业电脑断层扫描(CT)市场:按扫描技术、设备类型、服务、应用和最终用户产业划分-2026-2032年全球市场预测台式X射线电脑断层扫描系统市场:按组件、系统配置、技术、应用和分销管道划分-2026年至2032年全球预测汽车工业CT扫描市场:按设备类型、服务、解析度、应用和最终用途划分-2026-2032年全球市场预测工业电脑断层扫描和X射线成像市场:按产品、组件、服务、技术、应用和最终用户产业划分,全球预测,2026-2032年
 工业电脑断层扫描(CT)全球市场规模、份额、趋势和成长分析报告(2026-2034)
 工业电脑断层扫描市场-全球产业规模、份额、趋势、机会与预测:产品、类型、扫描技术、应用、垂直产业、地区和竞争格局(2021-2031)工业电脑断层扫描和检测服务市场(按服务类型、成像技术、建筑材料、产业细分、应用和部署模式划分),全球预测(2026-2032年)
 2025-2029年全球工业电脑断层扫描市场
 亚太地区工业电脑断层扫描 (CT):市场占有率分析、产业趋势与统计、成长预测(2025-2030 年)
 工业电脑断层扫描市场规模、份额、成长分析,按产品、按类型、按扫描技术、按应用、按最终用途、按地区 - 行业预测,2025-2032 年