


 |
市场调查报告书
商品编码
1910629
工业标籤:市场占有率分析、产业趋势与统计、成长预测(2026-2031)Industrial Labels - Market Share Analysis, Industry Trends & Statistics, Growth Forecasts (2026 - 2031) |
||||||
※ 本网页内容可能与最新版本有所差异。详细情况请与我们联繫。
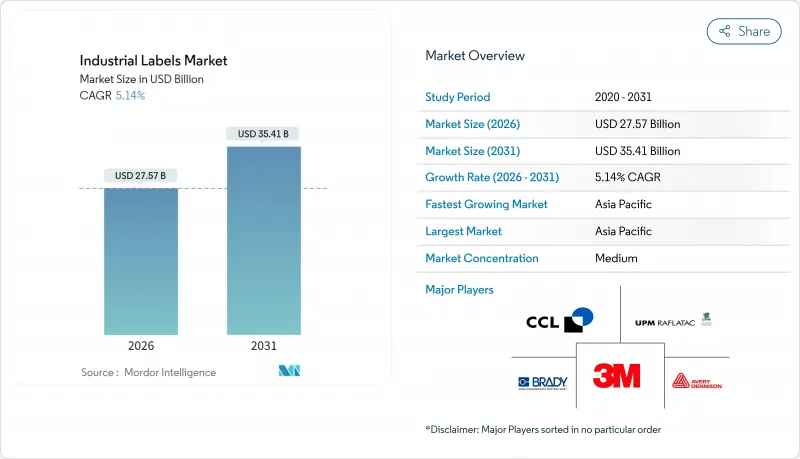
预计到 2025 年,工业标籤市场价值将达到 262.2 亿美元,到 2026 年将达到 275.7 亿美元,到 2031 年将达到 354.1 亿美元,预测期(2026-2031 年)的复合年增长率为 5.14%。
这一成长动能凸显了市场对可靠的产品识别、可追溯性和安全沟通的持续需求,而这种需求的驱动力来自日益严格的法规和数位化製造的扩张。新的合规要求、快速的电商物流以及数位和智慧印刷技术的加速应用,正在重塑加工商、原材料供应商和设备製造商的成本结构和竞争策略。工业标籤市场受益于工厂自动化和物流可视化投资的增加,但聚合物和黏合剂价格的波动以及日益严格的VOC法规持续对利润率构成压力。总体而言,该行业呈现出成熟的终端用户需求和新兴创新领域均衡的组合,预计未来五年将共同支撑其保持个位数的温和成长。
全球工业标籤市场趋势与洞察
对食品和饮料合规标籤的需求日益增长
为遵守美国食品药物管理局 (FDA) 将于 2026 年 1 月生效的食品可追溯性规则,製造商迫切需要使用能够显示二维条码和序列化追溯批号的标籤。新的食品标籤法规将于 2028 年统一实施,这促使市场对能够适应不断变化的资料栏位的列印系统提出了更高的要求。市场对耐用、耐候且在整个低温运输中都能保持清晰可读的基材的需求也不断增长。二维条码的普及性提高了印表机的解析度要求,而早期零售试点项目使用嵌入式 RFID 烘焙标籤,则展示了合规性和供应链优化之间的完美结合。随着品牌对其生产线维修,工业标籤市场正迎来高规格食品级产品的激增。
电子商务和物流标籤的加速成长
自动化履约中心正在大规模应用ERP系统产生的可变资料标籤,这些标籤在机器人驱动的仓库中穿梭,推动物流标籤市场以9.98%的复合年增长率成长。沃尔玛的RFID扩展政策要求上游供应商在每个产品上嵌入编码嵌体。具备即时定位功能的BLE标籤的广泛应用,标誌着被动条码正向支援人工智慧库存管理演算法的物联网标籤转变。亚太地区跨境电商的快速成长进一步刺激了对能够实现机器可读且无误识别的工业标籤的需求。
原料和黏合剂价格波动
聚乙烯醇价格的下跌趋势与运费溢价交替出现,阻碍了亚太地区加工商的利润规划。黏合剂原料和硅胶衬纸的价格受石油和能源市场的影响而快速波动,导致合约频繁重新谈判。 2024年第四季采购报告指出,特种涂料供应不稳定,迫使加工商持有缓衝库存,加剧了营运资金压力。儘管需求强劲,但上述因素共同导致工业标籤市场整体成长略有放缓。
细分市场分析
由于其优异的耐化学性,聚合物标籤到 2025 年将保持 51.98% 的工业标籤市场份额,但预计纸基环保基材将以 9.38% 的复合年增长率超越它们,到 2031 年扩大其在工业标籤市场的份额。 PP 和 PET 薄膜由于其耐磨性,仍用于汽车、农药和润滑剂应用,但结合金属和聚合物层的混合层压材料正被用于恶劣环境。
对永续性的追求正在推动材料快速替代。 Carbon Action 的纸製品系列和麻纤维标籤纸可大幅减少环境影响。由水果废弃物和坚果壳製成的纸製品实现了农产品的再利用,并受到高端食品品牌的青睐。一些先驱者在报价中加入了“生产过程开始前的排放”,这在工业标籤市场尚属首例,以此来凸显自身优势。
到2025年,受日常消费品(FMCG)和製药厂快速且灵活的标籤生产线的推动,压敏胶标籤将占据工业标籤市场43.05%的份额。同时,随着吹塑成型和射出成型机在初级成型阶段整合装饰工艺,套模和热转印标籤的复合年增长率将达到8.78%。
无底纸标籤技术兼俱生产效率和永续性优势,每卷标籤数量增加 80%,停机时间减少。 OptiCut WashOff 无底纸标籤在回收槽中可完全剥离,有助于建构闭合迴路PET 回收系统。相容机器人的贴标机进一步将这些技术整合到工业 4.0 生产线中,加速工业标籤市场的发展。
工业标籤市场报告按材料(聚合物/塑胶、金属等)、机制(压敏、黏合剂等)、产品类型(警告/安全标籤、资产标籤等)、印刷技术(类比、数位、混合、网版印刷等)、识别技术(条码、RFID等)、电子用户产业(食品饮料、电子终端等)和地区进行细分。市场预测以美元以金额为准。
区域分析
预计到2025年,亚太地区将占据工业标籤市场38.10%的份额,并在2031年之前以8.52%的复合年增长率成长,这主要得益于电子、汽车和电子商务中心的扩张。中国和印度在产能扩张方面处于主导,而东南亚国协的优惠政策则促进了本地采购。政府主导的工业4.0计画正在加速待开发区工厂采用智慧标籤,巩固了该地区在全球工业标籤市场成长中的关键地位。
北美受益于完善的法规结构和大型零售商的强制性要求。艾利丹尼森位于克雷塔罗的RFID工厂表明,墨西哥已崛起为美国加工商的低成本供应合作伙伴。加拿大的VOC法规和美国对供应链安全的重视,推动了消费品和战略性产业对标籤的强劲需求,增强了该地区工业标籤市场的稳定性。
在欧洲,严格的生态设计和废弃物指令抑制了成熟市场的需求。随着品牌所有者积极响应欧洲绿色交易的目标,可回收标籤创新技术正被儘早采用。德国在自动化领域的领先地位支撑着先进的生产设施,而英国脱欧后监管政策的差异则促使多语言和多格式标籤策略的出现。中东、非洲和南美洲的新兴产业丛集发展轨迹不平衡,但对于那些寻求在新兴工业标籤市场获得先发优势的加工商而言,这些地区仍然具有吸引力。
其他福利:
- Excel格式的市场预测(ME)表
- 3个月的分析师支持
目录
第一章 引言
- 研究假设和市场定义
- 调查范围
第二章调查方法
第三章执行摘要
第四章 市场情势
- 市场概览
- 市场驱动因素
- 食品和饮料行业对合规标籤的需求日益增长
- 电子商务和物流标籤的加速成长
- 数位和混合印刷技术的快速普及
- 可追溯性和安全性方面的监理要求
- 工业4.0:智慧标籤与物联网的融合
- 混合列印技术可实现大规模客製化
- 市场限制
- 原料和黏合剂价格波动;
- 针对塑胶和挥发性有机化合物(VOCs)的严格环境法规
- 数位色彩管理领域技术纯熟劳工短缺
- 特种油墨和衬纸供应链中断
- 供应链分析
- 监管环境
- 技术展望
- 波特五力分析
- 供应商的议价能力
- 买方的议价能力
- 新进入者的威胁
- 替代品的威胁
- 竞争对手之间的竞争
第五章 市场规模与成长预测
- 按原料
- 聚合物/塑胶标籤
- 金属标籤
- 纸基环保基材
- 混合层压板及其他
- 按组织
- 感压标籤
- 黏合剂标籤
- 收缩套标
- 套模和热转印标籤
- 无底纸标籤
- 依产品类型
- 警告/安全标籤
- 资产和库存标籤
- 品牌和促销标籤
- 耐候耐用标籤
- 追踪溯源(智慧/RFID)标籤
- 透过印刷技术
- 类比印刷
- 数位印刷
- 混合印刷
- 网版印刷
- 透过识别技术
- 条码
- RFID
- NFC
- QR码与二维码
- 其他识别技术
- 按最终用户行业划分
- 食品/饮料
- 电子设备和电器
- 汽车和运输设备
- 医疗和药品
- 化学品和危险材料
- 建筑和重型设备
- 物流和仓储管理
- 其他终端用户产业
- 按地区
- 北美洲
- 美国
- 加拿大
- 墨西哥
- 欧洲
- 德国
- 英国
- 法国
- 义大利
- 西班牙
- 俄罗斯
- 其他欧洲地区
- 亚太地区
- 中国
- 印度
- 日本
- 韩国
- 澳洲和纽西兰
- 亚太其他地区
- 中东和非洲
- 中东
- 阿拉伯聯合大公国
- 沙乌地阿拉伯
- 土耳其
- 其他中东地区
- 非洲
- 南非
- 奈及利亚
- 埃及
- 其他非洲地区
- 中东
- 南美洲
- 巴西
- 阿根廷
- 其他南美洲
- 北美洲
第六章 竞争情势
- 市场集中度
- 策略倡议与发展
- 市占率分析
- 公司简介
- Avery Dennison Corporation
- CCL Industries Inc.
- 3M Company
- Brady Corporation
- UPM Raflatac
- DuPont de Nemours Inc.
- Brook+Whittle Ltd
- Multi-Color Corporation
- Fuji Seal International
- Honeywell International Inc.
- SATO Holdings Corporation
- Zebra Technologies Corporation
- Lintec Corporation
- TSC Auto ID Technology
- Checkpoint Systems Inc.
- DIC Corporation
- Skanem Group
- Weber Packaging Solutions
- Resource Label Group
- Smartrac Technology GmbH
第七章 市场机会与未来展望
The industrial labels market was valued at USD 26.22 billion in 2025 and estimated to grow from USD 27.57 billion in 2026 to reach USD 35.41 billion by 2031, at a CAGR of 5.14% during the forecast period (2026-2031).
This growth momentum underscores sustained demand for reliable product identification, traceability, and safety communication as regulations tighten and digital manufacturing expands. New compliance mandates, rapid e-commerce fulfillment, and accelerating adoption of digital and smart printing technologies are reshaping cost structures and competitive strategies across converters, raw-material suppliers, and equipment manufacturers. The industrial labels market benefits from rising investment in factory automation and logistics visibility, yet pricing volatility for polymers and adhesives and stricter VOC limits continue to pressure margins. Overall, the sector demonstrates a balanced mix of mature end-use demand and emerging innovation pockets that collectively support mid-single-digit growth over the next five years.
Global Industrial Labels Market Trends and Insights
Rising demand from food and beverage compliance labelling
Manufacturers face imminent January 2026 enforcement of the FDA Food Traceability Rule, forcing adoption of labels capable of carrying 2D codes and serialized Traceability Lot Codes.Uniform compliance dates set for new food labeling rules in 2028 heighten the need for print systems that flex with evolving data fields. Demand is rising for durable, weather-resistant substrates that stay legible across cold chains. The push toward 2D barcodes is increasing printer resolution requirements, and early retail pilots with RFID-embedded bakery labels illustrate how compliance intersects with supply-chain optimization. As brands retrofit lines, the industrial labels market records a surge in high-specification food-grade products.
Accelerating e-commerce and logistics labelling growth
Automated fulfillment centers are scaling variable-data labels that originate in ERP systems and travel through robotics-driven warehouses, aligning with a 9.98% CAGR in logistics labeling. Walmart's expanded RFID directive compels upstream suppliers to embed encoded inlays at item level. Real-time location sensing printed BLE labels show how IoT-ready tags are replacing passive barcodes to meet AI-powered inventory algorithms. APAC's booming cross-border e-commerce further accelerates industrial labels market demand for machine-readable, error-free identification.
Volatile raw-material and adhesive pricing
Downward swings in polyvinyl alcohol costs, interspersed with freight surcharges, hamper profit planning in Asia-Pacific converting hubs. Contract renegotiations become frequent as adhesive feedstocks and silicone liners move sharply with oil and energy markets. Q4 2024 sourcing reports flag erratic availability of specialty coatings, prompting converters to hold buffer inventories that erode working capital. Combined, these shocks slightly temper overall industrial labels market expansion despite healthy demand.
Other drivers and restraints analyzed in the detailed report include:
- Rapid adoption of digital and hybrid printing technologies
- Regulatory mandates for traceability and safety
- Stringent environmental regulations on plastics and VOCs
For complete list of drivers and restraints, kindly check the Table Of Contents.
Segment Analysis
Polymer labels retained 51.98% industrial labels market share in 2025 due to superior chemical resistance, yet paper-based eco substrates are set to outpace with a 9.38% CAGR, lifting their slice of industrial labels market size through 2031. Automotive, agrochemical, and lubricants applications still rely on PP and PET films for abrasion resistance, while hybrid laminates combine metal and polymer layers for extreme environments.
Sustainability imperatives are catalyzing rapid material substitution. Carbon-action paper lines and hemp-fiber label stocks demonstrate measurable footprint reductions. Fruit-waste and nut-shell papers repurpose agricultural by-products, appealing to premium food brands. Early adopters differentiate by reporting cradle-to-gate emissions in quotations, a first in the industrial labels market.
Pressure-sensitive constructions led with 43.05% industrial labels market share in 2025 on the strength of fast, flexible application lines across FMCG and pharma plants. Concurrently, in-mold and heat-transfer labels present an 8.78% CAGR as blow-molders and injection molders integrate decoration into primary forming.
Linerless technology illustrates dual gains in productivity and sustainability, providing 80% more labels per roll and reducing downtime. OptiCut WashOff linerless labels detach cleanly in recycling baths, aiding closed-loop PET systems. Robotics-ready applicators further integrate these mechanisms into Industry 4.0 lines, enhancing industrial labels market adoption.
The Industrial Labels Market Report is Segmented by Raw Material (Polymer/Plastic, Metal, and More), Mechanism (Pressure-Sensitive, Glue-Applied, and More), Product Type (Warning/Security, Asset Tags, and More), Printing Technology (Analog, Digital, Hybrid, Screen), Identification Technology (Barcode, RFID, and More), End-User Industry (Food/Beverage, Electronics, and More), and Geography. Market Forecasts in Value (USD).
Geography Analysis
Asia-Pacific dominated with 38.10% industrial labels market share in 2025 and is projected to compound at 8.52% through 2031 thanks to expanding electronics, automotive, and e-commerce hubs. China and India spearhead capacity additions, while ASEAN incentives attract near-shoring. Government Industry 4.0 programs accelerate smart-label adoption inside new greenfield plants, cementing the region's pivotal role in global industrial labels market growth.
North America benefits from entrenched regulatory frameworks and big-box retail mandates. Avery Dennison's Queretaro RFID plant underscores Mexico's ascent as a low-cost supply partner for U.S. converters Averydennison. Canadian VOC controls and the U.S. emphasis on supply-chain security keep label demand resilient across consumer and strategic industries, reinforcing regional industrial labels market stability.
Europe exhibits mature demand moderated by strict eco-design and waste directives. Recyclable label innovations enjoy early adoption as brand owners align with European Green Deal goals. Germany's automation leadership sustains high-spec production tools, while UK regulatory divergence post-Brexit prompts multi-language, multi-format label strategies. Emerging clusters in the Middle East & Africa and South America show variable trajectories but remain attractive for converters seeking first-mover gains in developing industrial labels markets.
- Avery Dennison Corporation
- CCL Industries Inc.
- 3M Company
- Brady Corporation
- UPM Raflatac
- DuPont de Nemours Inc.
- Brook + Whittle Ltd
- Multi-Color Corporation
- Fuji Seal International
- Honeywell International Inc.
- SATO Holdings Corporation
- Zebra Technologies Corporation
- Lintec Corporation
- TSC Auto ID Technology
- Checkpoint Systems Inc.
- DIC Corporation
- Skanem Group
- Weber Packaging Solutions
- Resource Label Group
- Smartrac Technology GmbH
Additional Benefits:
- The market estimate (ME) sheet in Excel format
- 3 months of analyst support
TABLE OF CONTENTS
1 INTRODUCTION
- 1.1 Study Assumptions and Market Definition
- 1.2 Scope of the Study
2 RESEARCH METHODOLOGY
3 EXECUTIVE SUMMARY
4 MARKET LANDSCAPE
- 4.1 Market Overview
- 4.2 Market Drivers
- 4.2.1 Rising demand from food and beverage compliance labelling
- 4.2.2 Accelerating e-commerce and logistics labelling growth
- 4.2.3 Rapid adoption of digital and hybrid printing technologies
- 4.2.4 Regulatory mandates for traceability and safety
- 4.2.5 Industry 4.0 integration of smart labels and IoT
- 4.2.6 Hybrid printing enabling mass-customisation
- 4.3 Market Restraints
- 4.3.1 Volatile raw-material and adhesive pricing
- 4.3.2 Stringent environmental regulations on plastics and VOCs
- 4.3.3 Skilled-labour shortage in digital colour management
- 4.3.4 Supply-chain disruptions for specialty inks and liners
- 4.4 Supply-Chain Analysis
- 4.5 Regulatory Landscape
- 4.6 Technological Outlook
- 4.7 Porter's Five Forces Analysis
- 4.7.1 Bargaining Power of Suppliers
- 4.7.2 Bargaining Power of Buyers
- 4.7.3 Threat of New Entrants
- 4.7.4 Threat of Substitutes
- 4.7.5 Intensity of Competitive Rivalry
5 MARKET SIZE AND GROWTH FORECASTS (VALUE)
- 5.1 By Raw Material
- 5.1.1 Polymer / Plastic Labels
- 5.1.2 Metal Labels
- 5.1.3 Paper-based Eco Substrates
- 5.1.4 Hybrid Laminates and Others
- 5.2 By Mechanism
- 5.2.1 Pressure-Sensitive Labeling
- 5.2.2 Glue-Applied Labeling
- 5.2.3 Shrink-Sleeve Labeling
- 5.2.4 In-Mold and Heat-Transfer Labeling
- 5.2.5 Liner-less Labeling
- 5.3 By Product Type
- 5.3.1 Warning / Security Labels
- 5.3.2 Asset and Inventory Tags
- 5.3.3 Branding and Promotional Labels
- 5.3.4 Weather-proof and Durable Labels
- 5.3.5 Track-and-Trace (Smart / RFID) Labels
- 5.4 By Printing Technology
- 5.4.1 Analog Printing
- 5.4.2 Digital Printing
- 5.4.3 Hybrid Printing
- 5.4.4 Screen Printing
- 5.5 By Identification Technology
- 5.5.1 Barcode
- 5.5.2 RFID
- 5.5.3 NFC
- 5.5.4 QR and 2-D Codes
- 5.5.5 Other Identification Technology
- 5.6 By End-user Industry
- 5.6.1 Food and Beverage
- 5.6.2 Electronics and Electricals
- 5.6.3 Automotive and Transportation
- 5.6.4 Healthcare and Pharmaceuticals
- 5.6.5 Chemicals and Hazardous Goods
- 5.6.6 Construction and Heavy Equipment
- 5.6.7 Logistics and Warehousing
- 5.6.8 Other End-user Industry
- 5.7 By Geography
- 5.7.1 North America
- 5.7.1.1 United States
- 5.7.1.2 Canada
- 5.7.1.3 Mexico
- 5.7.2 Europe
- 5.7.2.1 Germany
- 5.7.2.2 United Kingdom
- 5.7.2.3 France
- 5.7.2.4 Italy
- 5.7.2.5 Spain
- 5.7.2.6 Russia
- 5.7.2.7 Rest of Europe
- 5.7.3 Asia-Pacific
- 5.7.3.1 China
- 5.7.3.2 India
- 5.7.3.3 Japan
- 5.7.3.4 South Korea
- 5.7.3.5 Australia and New Zealand
- 5.7.3.6 Rest of Asia-Pacific
- 5.7.4 Middle East and Africa
- 5.7.4.1 Middle East
- 5.7.4.1.1 United Arab Emirates
- 5.7.4.1.2 Saudi Arabia
- 5.7.4.1.3 Turkey
- 5.7.4.1.4 Rest of Middle East
- 5.7.4.2 Africa
- 5.7.4.2.1 South Africa
- 5.7.4.2.2 Nigeria
- 5.7.4.2.3 Egypt
- 5.7.4.2.4 Rest of Africa
- 5.7.4.1 Middle East
- 5.7.5 South America
- 5.7.5.1 Brazil
- 5.7.5.2 Argentina
- 5.7.5.3 Rest of South America
- 5.7.1 North America
6 COMPETITIVE LANDSCAPE
- 6.1 Market Concentration
- 6.2 Strategic Moves and Developments
- 6.3 Market Share Analysis
- 6.4 Company Profiles (includes Global level Overview, Market level overview, Core Segments, Financials as available, Strategic Information, Market Rank/Share for key companies, Products and Services, and Recent Developments)
- 6.4.1 Avery Dennison Corporation
- 6.4.2 CCL Industries Inc.
- 6.4.3 3M Company
- 6.4.4 Brady Corporation
- 6.4.5 UPM Raflatac
- 6.4.6 DuPont de Nemours Inc.
- 6.4.7 Brook + Whittle Ltd
- 6.4.8 Multi-Color Corporation
- 6.4.9 Fuji Seal International
- 6.4.10 Honeywell International Inc.
- 6.4.11 SATO Holdings Corporation
- 6.4.12 Zebra Technologies Corporation
- 6.4.13 Lintec Corporation
- 6.4.14 TSC Auto ID Technology
- 6.4.15 Checkpoint Systems Inc.
- 6.4.16 DIC Corporation
- 6.4.17 Skanem Group
- 6.4.18 Weber Packaging Solutions
- 6.4.19 Resource Label Group
- 6.4.20 Smartrac Technology GmbH
7 MARKET OPPORTUNITIES AND FUTURE OUTLOOK
- 7.1 White-space and Unmet-need Assessment


