


 |
市场调查报告书
商品编码
1910641
工程服务:市场占有率分析、产业趋势与统计、成长预测(2026-2031)Engineering Services - Market Share Analysis, Industry Trends & Statistics, Growth Forecasts (2026 - 2031) |
||||||
※ 本网页内容可能与最新版本有所差异。详细情况请与我们联繫。
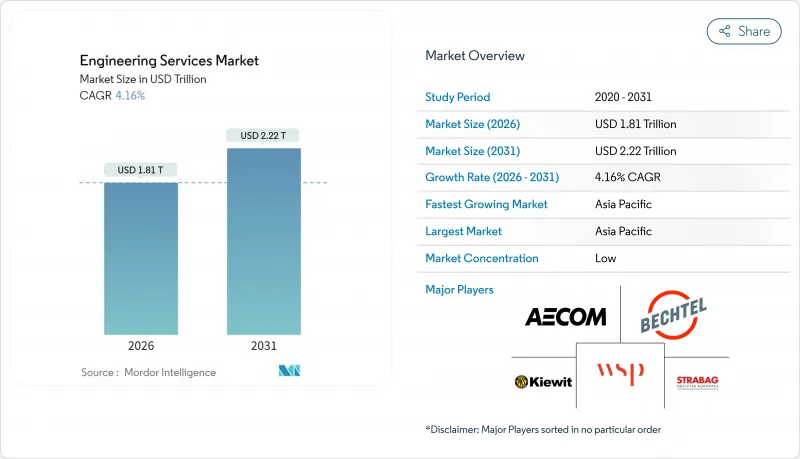
预计到 2026 年,工程服务市场规模将达到 1.81 兆美元,从 2025 年的 1.74 兆美元成长到 2031 年的 2.22 兆美元,2026 年至 2031 年的年复合成长率(CAGR)为 4.16%。
公共部门基础设施规划的增加、私人资本涌入能源转型资产以及数位双胞胎技术的加速应用,是推动这一成长的关键因素。土木工程和电气工程专业共同支撑着大多数合同,混合式现场-海上交付模式使供应商能够在计划复杂性和成本优化之间取得平衡。中型企业透过专注于氢能、碳捕获和小型模组化反应器(SMR)等业务,不断扩大市场份额,政府奖励也增强了市场需求。儘管亚太地区仍然是最大的区域机会,但随着联邦清洁能源资金流入电网现代化和国防项目,北美市场也呈现出强劲的成长动能。
全球工程服务市场趋势与洞察
工业IoT与数位双胞胎实施的演变
製造商正在扩展数位双胞胎,以减少停机时间并优化资产利用率,从而催生了对多学科工程支援的高需求。预测性维护能够稳定运营,通常可节省 15% 至 25% 的成本。兼具机械实力和分析能力的供应商可以获得更高的收费,但此类混合技能的短缺导致利润空间有限。随着操作技术网路与企业 IT 系统的连接,网路安全加固设计已成为一项必备要素,进一步提升了计划的价值和复杂性。这一趋势在半导体工厂、电池工厂和海上生产平台尤为明显,因为这些场所对计划外停机的接受度极低。从中长期来看,跨领域专业知识将决定竞争优势,使专家超越通才。
快速的都市化推动了对民用基础设施的需求。
到2025年,世界主要城市每年需要9兆美元的投资,以缓解交通拥堵和应对气候变迁。亚洲城市人口正以每年2.3%的速度成长,推动了公共交通线路、防洪系统和智慧电网建设方面创纪录的支出。工程顾问公司正在帮助市政当局建立资金筹措的公私合营(PPP)项目,这种能力正在吸引机构资本。在美国,光是联邦水利基础设施拨款每年就能产生60亿美元的工程需求。强制性的环境合规要求,特别是针对污水处理和灾害应变计划的要求,正在延长规划週期,并增加对经验丰富的土木工程公司的需求。因此,长期成长将始终根植于城市发展需求与日益严格的永续性标准的交汇点。
政治不稳定和技术纯熟劳工严重短缺
在政治不稳定的地区,跨国计划的风险溢价不断攀升,导致保险成本增加,核准流程延长。同时,退休潮导致经验丰富的技术人员供应短缺,而此时市场需求却正处于高峰期。企业报告称,关键的网实整合职位职位高达40%,迫使企业支付25%至35%的薪资溢价。过度依赖分包商降低了利润率,并招致品质审查,而签证和认证方面的瓶颈限制了人员的快速调配。目前,企业正在投资内部培训机构和国际轮调项目,以稳定人才储备,但短期产能限制阻碍了市场的发展速度。
细分市场分析
到2025年,土木工程将占总收入的37.86%,因为各国政府将继续优先发展交通走廊和韧性水系统。同时,在欧盟绿色交易资金以及美国3,690亿美元清洁能源激励措施的推动下,电气工程预计将以4.93%的复合年增长率快速成长。机械设备产业的需求成长主要得益于工厂自动化和机器人维修,而结构和管道工程的成长则与整体建设週期一致。电气工程师越来越多地将软体编码、网路安全和IEC-61850电网通讯协定的专业知识融入传统的工程设计工作中,从而推高了平均售价。随着分散式能源的普及,公用事业公司正在签署涵盖变电站数位化和储能係统整合研究的多年合约。这些趋势正在推动工程服务市场朝向电气化方向发展。
学科界线的模糊化正在重塑人才策略,企业在招募资料科学家的同时,也聘请持有专业工程师(PE)认证的工程师,以支援数位双胞胎专案的交付。 IEEE 和 ISO-55000 等认证在竞标评估中日益受到重视,这使得拥有良好合规记录的企业更具优势。因此,即使在对价格敏感的新兴市场,高单价计费率也得以维持。预计到 2031 年,电气工程合约收入将接近土木工程业,从而加剧竞争。为了脱颖而出,企业将越来越专注于车辆到电网(V2G)系统和高压直流(HVDC)连接等细分领域。
由于受监管计划需要面对面协调,到2025年,本地项目将占市场份额的66.83%,但离岸项目执行正以5.05%的复合年增长率成长。云端原生CAD/CAM平台透过将交付成果外包给位于印度、菲律宾和东欧的中心,实现了24小时不间断的设计週期。对于常规绘图工作,与本地团队相比,40-60%的成本差异仍然具有吸引力,这使得现场人员能够专注于相关人员管理和现场监督。混合工作规范(规定交付成果而非人员数量)正在工程服务市场中逐渐成为主流,从而缓解了客户对传统远端品管的担忧。
供应商的选择标准正从单纯的工时费率转向网路安全态势和资料隔离能力。 ISO-27001 和 SOC-2 认证如今已成为强制性要求。为了遵守出口管制法规,政府计画甚至设立了完全由盟国国民组成的无尘室式离岸部门。随着文件和模型检验自动化程度的提高,高阶架构师的日薪预计将保持稳定,而生产效率的提升可望逐步提高利润率。这一趋势表明,离岸外包正从简单的成本节约措施演变为一种策略性资源放大器。
区域分析
亚太地区预计到2025年将占全球收入的39.52%,这主要得益于每年1.7兆美元的基础建设支出。中国的「一带一路」倡议和印度的地铁系统推动了强劲的土木工程订单,而製造业回流亚太地区也带动了工厂自动化和电网升级的订单。区域各国政府正将气候变迁调适津贴用于海岸防护工程,进而推动了沿海土木工程产业的发展。因此,在主权财富基金涌入大型企划的推动下,该地区的工程服务市场预计将实现5.13%的最高区域复合年增长率。
北美占据第二大市场份额,这得益于3,690亿美国的清洁能源激励措施和1.2兆美元的基础设施现代化建设资金。国防费用和小型模组化反应器(SMR)试验进一步推动了对高技能工程人才的需求。加拿大的液化天然气和核能计画以及墨西哥的近岸工厂建设正在扩大北美大陆的计划储备。供应商的机会涵盖电网互联研究、氢能枢纽前端工程设计(FEED)合约以及关键矿物加工厂等。
在欧洲,欧盟绿色交易的资金重点用于净零排放维修和离岸风电扩建。德国5000亿欧元(5,500亿美元)的基础设施基金和英国的塞兹韦尔C核能计划是大型计画的典型例子。严格的分类规则确保资金流向经认证的永续计划,并奖励那些在环境、社会和治理(ESG)报告方面表现出色的公司。同时,中东和非洲正致力于能源多元化,包括在沿岸地区绿色氨出口中心,以及在北非发展公用事业规模的太阳能发电。然而,政治稳定性问题和劳动力短缺减缓了中东和北非部分市场的成长。
其他福利:
- Excel格式的市场预测(ME)表
- 3个月的分析师支持
目录
第一章 引言
- 研究假设和市场定义
- 调查范围
第二章调查方法
第三章执行摘要
第四章 市场情势
- 市场概览
- 市场驱动因素
- 工业IoT与数位双胞胎技术的发展
- 快速的都市化推动了对民用基础设施的需求。
- 加速的产品生命週期推动研发外包
- 能源转型大型企划(氢能、碳捕获、利用与封存)对工程、采购、施工和管理(EPCM)专业知识的需求
- 经合组织国家的净零排放建筑维修规定
- 国防无人机和高超音速工程的特殊工程需求
- 市场限制
- 政治不稳定和技术纯熟劳工严重短缺
- 投入成本和供应链波动性
- 由于智慧财产权安全方面的担忧,国防领域的外包受到限制。
- 大型可再生能源发电审批程序延误
- 产业价值链分析
- 监管环境
- 技术展望
- 波特五力分析
- 供应商的议价能力
- 买方的议价能力
- 新进入者的威胁
- 替代品的威胁
- 竞争对手之间的竞争
- 对宏观经济趋势的市场评估
第五章 市场规模与成长预测
- 按技术领域
- 土木工程
- 机器
- 电
- 管道和结构
- 以规定形式
- 离岸
- 当地的
- 透过服务
- 产品工程
- 程式工程
- 自动化相关服务
- 资产管理相关服务
- 按最终用户行业划分
- 航太与国防
- 车
- 化工/石油化工
- 发电
- 市政公共产业计划
- 矿业
- 石油和天然气
- 製药
- 运输
- 电讯
- 核能计划
- 其他终端用户产业
- 按地区
- 北美洲
- 美国
- 加拿大
- 墨西哥
- 南美洲
- 巴西
- 阿根廷
- 其他南美洲
- 欧洲
- 德国
- 英国
- 法国
- 义大利
- 西班牙
- 其他欧洲地区
- 亚太地区
- 中国
- 日本
- 印度
- 新加坡
- 澳洲
- 马来西亚
- 亚太其他地区
- 中东和非洲
- 中东
- 沙乌地阿拉伯
- 阿拉伯聯合大公国
- 其他中东地区
- 非洲
- 南非
- 埃及
- 其他非洲地区
- 中东
- 北美洲
第六章 竞争情势
- 市场集中度
- 策略趋势
- 市占率分析
- 公司简介
- AECOM Engineering company
- Bechtel Corporation
- Kiewit Corporation
- WSP Global Inc.
- STRABAG SE
- Fluor Corporation
- Tetra Tech, Inc.
- Arcadis NV
- Stantec Inc.
- AtkinsRealis Inc.
- NV5 Global, Inc.
- Black & Veatch Holding Co.
- Balfour Beatty plc
- HDR, Inc.
- Wood PLC
- China Communications Construction Co. Ltd.
- Gilbane Building Company
- Brasfield & Gorrie LLC
- Jacobs Solutions Inc.
- Barton Malow Inc.
第七章 市场机会与未来展望
The engineering services market size in 2026 is estimated at USD 1.81 trillion, growing from 2025 value of USD 1.74 trillion with 2031 projections showing USD 2.22 trillion, growing at 4.16% CAGR over 2026-2031.
Rising public-sector infrastructure programs, private capital pouring into energy-transition assets, and accelerating digital-twin adoption are the primary vectors supporting that expansion. Civil and electrical disciplines jointly underpin most contracts, while hybrid onsite, offshore delivery helps vendors balance project complexity with cost optimization. Mid-sized firms continue to gain share by specializing in hydrogen, carbon-capture, and small modular reactor (SMR) work, where government incentives strengthen demand visibility. Asia Pacific sustains the largest regional opportunity set, yet North America posts resilient growth as federal clean-energy funds flow into grid-modernization and defense programs.
Global Engineering Services Market Trends and Insights
Evolution of Industrial IoT and Digital-Twin Adoption
Manufacturers are scaling digital twins to cut downtime and fine-tune asset utilization, triggering premium demand for multidisciplinary engineering support. Engagements commonly promise 15-25% cost reductions once predictive maintenance stabilizes operations. Vendors that couple mechanical strength with analytics talent win higher bill rates, yet the scarcity of such hybrid skills keeps margins firm. As operational-technology networks connect to enterprise IT, cyber-hardening design has become a mandatory scope element, further widening project value and complexity. The trend is most visible in semiconductor fabs, battery-cell plants, and offshore production platforms, where tolerance for unplanned outages is minimal. Over the medium term, cross-domain expertise will define competitive advantage, giving specialist firms room to outpace generalists.
Rapid Urbanization Spurring Civil-Infrastructure Demand
Global cities require USD 9 trillion annually through 2025 to relieve congestion and climate stress. Asia's 2.3% yearly urban-population increment forces record spending on mass-transit corridors, flood-control systems, and smart-utility grids. Engineering consultancies help municipalities structure bankable public-private partnership (PPP) deals, a capability that attracts institutional capital. In the United States, federal water infrastructure grants alone create a USD 6 billion annual engineering opportunity. Environmental-compliance mandates, particularly for wastewater and storm-resilience projects, lengthen scoping phases and raise demand for experienced civil firms. Long-term growth, therefore, remains anchored in the intersection of urban build-out needs and stricter sustainability codes.
Political Instability and Acute Skilled-Labor Shortage
Cross-border project risk premiums widen in politically volatile regions, inflating insurance costs and elongating approval cycles. Concurrently, retirements reduce the available experienced-engineer pool just as demand peaks. Firms report up to 40% vacancy rates for critical cyber-physical roles, forcing salary premiums of 25-35%. Over-reliance on subcontractors erodes margin and invites quality scrutiny, while visa and certification bottlenecks limit rapid redeployment of personnel. Companies now invest in internal academies and international rotation programs to stabilize workforce pipelines, but near-term capacity constraints remain a drag on market velocity.
Other drivers and restraints analyzed in the detailed report include:
- Accelerated Product Life-Cycle Driving Outsourced Research and Development
- Energy-Transition Mega-Projects Requiring EPCM Expertise
- IP-Security Concerns Limiting Defense Outsourcing
For complete list of drivers and restraints, kindly check the Table Of Contents.
Segment Analysis
Civil engineering retained 37.86% of 2025 revenue as governments continued to prioritize transportation corridors and resilient water systems. Electrical work, however, is forecast to grow at a 4.93% CAGR, the fastest among disciplines, propelled by USD 369 billion in U.S. clean-energy incentives and parallel EU Green Deal funding. Mechanical services gain traction through factory automation and robotics retrofits, while structural and piping segments trace the broader construction cycle. Electrical practitioners increasingly bundle software coding, cybersecurity, and IEC-61850 grid-protocol expertise with traditional design scopes, a convergence that maintains high average selling prices. As distributed energy resources proliferate, utilities award multi-year frameworks covering substation digitalization and storage-integration studies. These developments keep the engineering services market on an electrification-tilted growth arc.
The blurring of disciplinary boundaries also reshapes talent strategies; firms now recruit data scientists alongside PE-licensed engineers to satisfy digital-twin deliverables. Certification regimes such as IEEE and ISO-55000 factor heavily into bid evaluations, elevating firms with proven compliance track records. Consequently, premium billing rates remain sticky even in price-sensitive emerging markets. By 2031, electrical contracts are expected to approach civil's revenue scale, tightening competition and prompting niche specialization, such as vehicle-to-grid systems and high-voltage direct-current interconnects, to preserve differentiation.
On-site work held a 66.83% share in 2025 due to the need for face-to-face coordination on regulated projects, yet offshore execution is expanding at a 5.05% CAGR. Cloud-native CAD/CAM platforms enable 24-hour design cycles by handing deliverables to centers in India, the Philippines, and Eastern Europe. Cost arbitrage of 40-60% versus local teams remains compelling for routine drafting, freeing onsite staff for stakeholder management and field supervision. The engineering services market increasingly coalesces around hybrid statements of work that specify deliverables, not headcount, thereby defusing earlier client concerns about remote quality control.
Vendor selection now pivots on cybersecurity posture and data-segmentation capabilities rather than solely on hourly rates. ISO-27001 and SOC-2 attestations have become table stakes. For government-sensitive scopes, clients sometimes carve out clean-room offshore pods staffed exclusively by citizens of allied nations to comply with export-control regulations. With automation in documentation and model-checking advancing, firms expect incremental margin lift from productivity gains, even as daily rates for senior architects remain flat. The trend confirms offshore's evolution from tactical cost lever to strategic resource multiplier.
The Engineering Services Market Report is Segmented by Engineering Disciplines (Civil, Mechanical, and More), Delivery Model (Offshore, and Onsite), Services (Product Engineering, Process Engineering, and More), End-User Industry (Aerospace and Defense, Automotive, and More), and Geography (North America, South America, Europe, Asia-Pacific, and Middle East and Africa). The Market Forecasts are Provided in Terms of Value (USD).
Geography Analysis
Asia Pacific retained 39.52% of 2025 revenue, anchored by USD 1.7 trillion in annual infrastructure spending. China's Belt and Road initiatives and India's mass rapid-transit build-outs secure a robust civil-work backlog, while Asia-Pacific manufacturing-reshoring funnels orders into factory-automation and utility-grid upgrades. Regional governments allocate climate-adaptation grants toward coastal-protection engineering, propelling coastal-civil sub-disciplines. As a result, the engineering services market registers its fastest 5.13% regional CAGR here, sustained by sovereign wealth deployment into mega-projects.
North America holds the second-largest share, buoyed by USD 369 billion in U.S. clean-energy incentives and USD 1.2 trillion for broader infrastructure modernization. Defense spending and SMR pilots further sharpen demand for high-clearance engineering talent. Canada's LNG and nuclear programs, along with Mexico's near-shoring-induced factory builds, enlarge the continental project funnel. Vendor opportunities span grid-interconnect studies, hydrogen-hub FEED contracts, and critical-mineral processing plants.
Europe pivots on net-zero retrofits and offshore-wind expansion financed by the EU Green Deal.Germany's EUR 500 billion (USD 550 billion) infrastructure fund and the U.K.'s Sizewell C nuclear project typify large pipeline items. Strict taxonomy rules steer capital toward certified sustainable projects, rewarding firms adept at ESG reporting. Meanwhile, the Middle East and Africa focus on energy diversification, such as green-ammonia export hubs in the Gulf and utility-scale solar in North Africa. Political stability issues and labor shortages, however, temper growth velocity in selected Middle East and Africa markets.
- AECOM Engineering company
- Bechtel Corporation
- Kiewit Corporation
- WSP Global Inc.
- STRABAG SE
- Fluor Corporation
- Tetra Tech, Inc.
- Arcadis NV
- Stantec Inc.
- AtkinsRealis Inc.
- NV5 Global, Inc.
- Black & Veatch Holding Co.
- Balfour Beatty plc
- HDR, Inc.
- Wood PLC
- China Communications Construction Co. Ltd.
- Gilbane Building Company
- Brasfield & Gorrie LLC
- Jacobs Solutions Inc.
- Barton Malow Inc.
Additional Benefits:
- The market estimate (ME) sheet in Excel format
- 3 months of analyst support
TABLE OF CONTENTS
1 INTRODUCTION
- 1.1 Study Assumptions and Market Definition
- 1.2 Scope of the Study
2 RESEARCH METHODOLOGY
3 EXECUTIVE SUMMARY
4 MARKET LANDSCAPE
- 4.1 Market Overview
- 4.2 Market Drivers
- 4.2.1 Evolution of Industrial IoT and Digital Twin Adoption
- 4.2.2 Rapid Urbanization Spurring Civil Infrastructure Demand
- 4.2.3 Accelerated Product Life-Cycle Driving Outsourced Research and Development
- 4.2.4 Energy-Transition Mega-Projects (Hydrogen, CCUS) Requiring EPCM Expertise
- 4.2.5 Net-Zero Building Retrofit Mandates in OECD Economies
- 4.2.6 Defense Drone and Hypersonic Programs Needing Specialized Engineering
- 4.3 Market Restraints
- 4.3.1 Political Instability and Acute Skilled Labor Shortage
- 4.3.2 Input Cost and Supply-Chain Volatility
- 4.3.3 IP Security Concerns Limiting Defense Outsourcing
- 4.3.4 Slow Permitting for Utility-Scale Renewables
- 4.4 Industry Value Chain Analysis
- 4.5 Regulatory Landscape
- 4.6 Technological Outlook
- 4.7 Porter's Five Forces Analysis
- 4.7.1 Bargaining Power of Suppliers
- 4.7.2 Bargaining Power of Buyers
- 4.7.3 Threat of New Entrants
- 4.7.4 Threat of Substitutes
- 4.7.5 Intensity of Competitive Rivalry
- 4.8 Assessment of Macro-economic Trends on the Market
5 MARKET SIZE AND GROWTH FORECASTS (VALUE)
- 5.1 By Engineering Disciplines
- 5.1.1 Civil
- 5.1.2 Mechanical
- 5.1.3 Electrical
- 5.1.4 Piping and Structural
- 5.2 By Delivery Model
- 5.2.1 Offshore
- 5.2.2 Onsite
- 5.3 By Services
- 5.3.1 Product Engineering
- 5.3.2 Process Engineering
- 5.3.3 Automation Related Services
- 5.3.4 Asset Management Related Services
- 5.4 By End-user Industry
- 5.4.1 Aerospace and Defense
- 5.4.2 Automotive
- 5.4.3 Chemical and Petrochemical
- 5.4.4 Electric Power Generation
- 5.4.5 Municipal Utility Projects
- 5.4.6 Mining
- 5.4.7 Oil and Gas
- 5.4.8 Pharmaceuticals
- 5.4.9 Transportation
- 5.4.10 Telecommunications
- 5.4.11 Nuclear Projects
- 5.4.12 Other End-user Industries
- 5.5 By Geography
- 5.5.1 North America
- 5.5.1.1 United States
- 5.5.1.2 Canada
- 5.5.1.3 Mexico
- 5.5.2 South America
- 5.5.2.1 Brazil
- 5.5.2.2 Argentina
- 5.5.2.3 Rest of South America
- 5.5.3 Europe
- 5.5.3.1 Germany
- 5.5.3.2 United Kingdom
- 5.5.3.3 France
- 5.5.3.4 Italy
- 5.5.3.5 Spain
- 5.5.3.6 Rest of Europe
- 5.5.4 Asia-Pacific
- 5.5.4.1 China
- 5.5.4.2 Japan
- 5.5.4.3 India
- 5.5.4.4 Singapore
- 5.5.4.5 Australia
- 5.5.4.6 Malaysia
- 5.5.4.7 Rest of Asia-Pacific
- 5.5.5 Middle East and Africa
- 5.5.5.1 Middle East
- 5.5.5.1.1 Saudi Arabia
- 5.5.5.1.2 United Arab Emirates
- 5.5.5.1.3 Rest of Middle East
- 5.5.5.2 Africa
- 5.5.5.2.1 South Africa
- 5.5.5.2.2 Egypt
- 5.5.5.2.3 Rest of Africa
- 5.5.5.1 Middle East
- 5.5.1 North America
6 COMPETITIVE LANDSCAPE
- 6.1 Market Concentration
- 6.2 Strategic Moves
- 6.3 Market Share Analysis
- 6.4 Company Profiles (includes Global level Overview, Market level overview, Core Segments, Financials as available, Strategic Information, Market Rank/Share for key companies, Products and Services, and Recent Developments)
- 6.4.1 AECOM Engineering company
- 6.4.2 Bechtel Corporation
- 6.4.3 Kiewit Corporation
- 6.4.4 WSP Global Inc.
- 6.4.5 STRABAG SE
- 6.4.6 Fluor Corporation
- 6.4.7 Tetra Tech, Inc.
- 6.4.8 Arcadis NV
- 6.4.9 Stantec Inc.
- 6.4.10 AtkinsRealis Inc.
- 6.4.11 NV5 Global, Inc.
- 6.4.12 Black & Veatch Holding Co.
- 6.4.13 Balfour Beatty plc
- 6.4.14 HDR, Inc.
- 6.4.15 Wood PLC
- 6.4.16 China Communications Construction Co. Ltd.
- 6.4.17 Gilbane Building Company
- 6.4.18 Brasfield & Gorrie LLC
- 6.4.19 Jacobs Solutions Inc.
- 6.4.20 Barton Malow Inc.
7 MARKET OPPORTUNITIES AND FUTURE OUTLOOK
- 7.1 White-space and Unmet-Need Assessment
 绘图服务市场:全球市场按产品类型、价格范围、应用和最终用户分類的预测 - 2026-2032 年
 2026年全球人工智慧(AI)工程市场报告2026年全球工程服务市场报告2026年全球工程研发外包市场报告2026年全球物理、工程与生命科学市场报告
 2026-2030年全球工程服务市场
 美国工程服务:市场份额分析、行业趋势和统计数据、成长预测(2026-2031 年)冷弯型钢工程服务市场按服务类型、型材类型、最终用途、通路和应用划分,全球预测(2026-2032年)水族馆工程服务市场按产品类型、服务类型、水质和应用划分-2026-2032年全球预测重型起重工程计划服务市场(按服务、技术、计划规模和最终用途产业划分),全球预测(2026-2032)