


 |
市场调查报告书
商品编码
1910718
地理资讯系统(GIS):市场占有率分析、产业趋势与统计资料、成长预测(2026-2031)Geographic Information System - Market Share Analysis, Industry Trends & Statistics, Growth Forecasts (2026 - 2031) |
||||||
※ 本网页内容可能与最新版本有所差异。详细情况请与我们联繫。
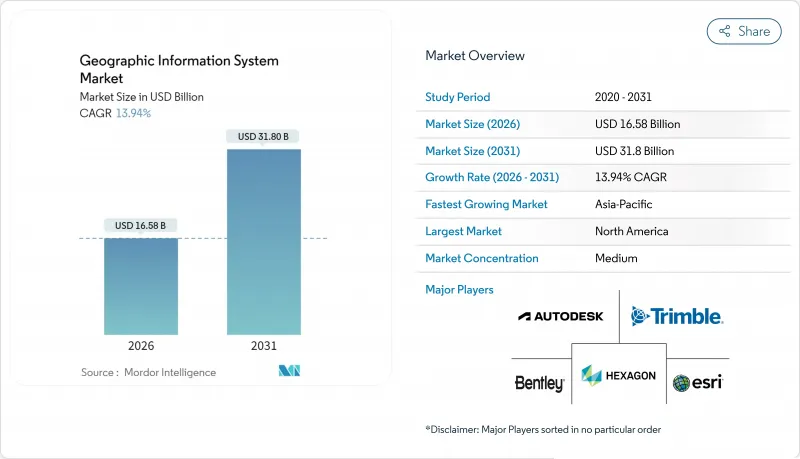
预计到 2025 年,地理资讯系统 (GIS) 市场价值将达到 145.6 亿美元,从 2026 年的 165.8 亿美元成长到 2031 年的 318 亿美元。
预测期(2026-2031 年)的复合年增长率预计为 13.94%。
由于智慧城市的快速部署、国家开放资料政策的推行以及云端原生技术的普及,市场需求持续成长。从解析度低于30公分的影像中自动提取特征并进行即时空间分析,可将决策延迟从数週缩短至数分钟,从而推动交通运输、石油天然气和公共等行业的应用。随着企业将营运网路的扩充性和网路安全置于优先地位,提供整合人工智慧、边缘处理和託管服务的供应商的市场份额持续成长。
全球地理资讯系统市场趋势与洞察
即时地理空间基础设施对于智慧城市的广泛部署至关重要。
城市机构正在将地理资讯系统市场平台与5G、物联网和边缘运算相结合,以协调城市服务。新加坡的开放式数位平台透过串流地理空间资料同步区域供冷、废弃物和能源供应,从而提升事件回应速度和基础设施运转率。洛杉矶利用即时仪錶板指导紧急应变团队,其情境察觉地图的峰值浏览量高达350万次。随着市政当局将数位双胞胎纳入累计,提供可扩展3D视觉化、感测器API和增强型网路安全解决方案的供应商正在公共部门IT支出中占据越来越大的份额。
云端原生GIS可降低整体拥有成本并加快企业整合。
贝尔加拿大公司透过迁移到云端原生地理空间资料平台,将基础设施支出减少了 40% 至 60%,这充分体现了容器化微服务和託管升级如何缩短引进週期。基于 Kubernetes 的 ArcGIS Enterprise 及类似解决方案将 GIS 作业与 DevOps 管线集成,在灾难时实现动态扩展,避免采购延迟。云端资料仓储中的下推分析消除了 ETL 瓶颈,并将地理资讯系统 (GIS) 的市场覆盖范围扩展到传统地图绘製团队之外。
将传统IT系统与OT和SCADA系统整合的复杂性
将现代地理资讯系统 (GIS) 与沿用数十年的 SCADA 系统整合的公共产业面临资料模型不匹配、通讯协定缺陷以及新兴网路威胁等问题。由于需要进行迭代测试和中介软体开发,Liberty Utilities 的迁移计画延长了 18 个月。这种延误导致支出转向专业服务,并减缓了地理资讯系统市场的软体转型进程。
细分市场分析
2026年,地理资讯系统(GIS)市场的业务收益大幅成长,复合年增长率(CAGR)达到15.45%,主要得益于企业云端迁移、人工智慧模型调优以及外包生命週期支援的推动。託管服务包现已涵盖资料品质审核、安全性修补程式和全天候监控,从而将支出从资本支出转向营运预算。软体仍将占2025年营收的53.60%,其核心产品组合包括ArcGIS、Hexagon NetWorks和Trimble Cityworks。 Esri持续的更新週期使其能够将约28%的年收入再投资于研发,以保持其在功能开发方面的领先优势。同时,其开放的API框架也鼓励采用第三方扩充功能。虽然接收器、雷射雷达扫描器和抗震平板电脑等硬体仍然必不可少,但随着功能越来越多地转移到软体层面,其利润率正在下降。因此,儘管感测器数量不断增加,但以纯硬体出货量衡量的地理资讯系统市场成长速度较为温和。
产业负责人更青睐能够提供以结果为导向的服务等级协议的供应商。例如,Hexagon 决定在 2025 年剥离非核心资产,从而释放资金以加强其订阅支援服务。培训机构、DevOps 工具链和认证合作伙伴网路如今已成为重要的选择标准,这标誌着 GIS 市场正在从关注授权数量转向关注客户成功指标。
到2025年,地图测绘将占据34.10%的市场份额,为所有下游工作流程提供空间背景资讯。然而,分析子领域将以15.70%的复合年增长率实现最快成长,这主要得益于边缘推理、基础模型和资料湖架构的推动。企业正在将预测性地理围栏技术整合到企业资源计画(ERP)系统中,政府部门正在利用频谱资料堆迭实施城市热岛模型。测绘产业将保持稳定,无人机摄影测量技术将推动创新,把传统的地形资料收集週期从一週缩短到当日交货。
车载资讯系统在电动车路线优化和低温运输监控方面取得了成功,并专门整合了电动车的续航里程计算功能。定位服务正透过高度个人化的零售应用程式不断发展,这些应用程式可以触发店内促销活动,但与智慧型手机作业系统原生API的衝突限制了供应商的利润空间。整体而言,地理资讯系统市场正围绕着整体资料架构原则调整其功能蓝图,将资料收集、编目和人工智慧管道统一到一个统一的管治框架下。
区域分析
北美地区在2025年仍将维持37.80%的支出份额,这主要得益于成熟的云端基础设施、雄厚的研发资金以及政府的强制性规定,例如美国《地理空间资料法案》(该法案旨在规范互通性和元资料) 。联邦计画已拨出多年资金用于野火建模、宽频公平性测绘和关键基础设施韧性建设。像Trimble这样的公司每年在创新方面投入超过6.6亿美元,其获得的专利进一步巩固了该地区的技术优势。然而,不断上涨的云端储存费用为Petabyte级影像分析带来了成本挑战,促使人们开始讨论建构区域主权云。
亚太地区预计将实现15.95%的最高复合年增长率,主要得益于特大城市现代化和基础设施奖励策略。新加坡正在扩展三维地下测绘技术以缓解空间限制,而印度的数位双胞胎计画将把物流走廊与综合的包裹级地籍资讯连接起来。沙乌地阿拉伯与Naver公司斥资10亿美元开展的数位双胞胎合作项目,凸显了海湾地区主导智慧城市产业的雄心壮志。该地区面临的挑战包括资料居住规则分散和出口管制法规不一,但国内卫星发射和主权云区的建设正在降低对外部的依赖性。
在《INSPIRE指令》的支持下,欧洲的成长保持稳定,该指令旨在促进高价值资料集的民主化。开放取用催生了专注于气候风险评估和可再生能源位置分析的Start-Ups。 GDPR影响了架构设计,推动了隐私增强型运算和区域内处理。儘管南美洲和中东/非洲的规模通常较小,但在矿产探勘、精密农业和基础设施安全等领域,地理资讯系统(GIS)的应用正在加速发展。这些市场往往直接跳过传统系统,从一开始就采用云端原生GIS,透过新的需求推动了地理资讯系统市场的扩张。
其他福利:
- Excel格式的市场预测(ME)表
- 3个月的分析师支持
目录
第一章 引言
- 研究假设和市场定义
- 调查范围
第二章调查方法
第三章执行摘要
第四章 市场情势
- 市场概览
- 市场驱动因素
- 即时地理空间基础设施对于智慧城市的广泛部署至关重要。
- 云端原生GIS降低了整体拥有成本,并加速了企业整合。
- 行动优先的现场数据采集平台扩大了覆盖范围
- 人工智慧自动分类技术可加速卫星影像分析
- 30公分以下商用微型卫星卫星星系实现全新高精度应用场景
- 国家开放资料指令(例如欧盟的 INSPIRE 2.0、美国的GDA)将推动其应用。
- 市场限制
- 将传统IT系统与OT/SCADA系统整合的复杂性
- 众包层中持续存在的资料品质和血缘关係缺陷
- Petabyte级影像归檔推高了云端资料传输成本
- 加强对高解析度地理空间资料的出口限制
- 价值链分析
- 监管环境
- 技术展望
- 产业吸引力-波特五力分析
- 供应商的议价能力
- 买方的议价能力
- 新进入者的威胁
- 替代品的威胁
- 竞争对手之间的竞争
- 宏观经济因素如何影响市场
第五章 市场规模与成长预测
- 按组件
- 硬体
- 软体
- 服务
- 按功能
- 地图
- 测量
- 车载资讯系统和导航
- 定位服务
- 地理空间资料管理与分析
- 透过部署模式
- 本地部署
- 云
- 按最终用户行业划分
- 农业
- 公共产业
- 矿业
- 建造
- 运输/物流
- 石油和天然气
- 政府/国防
- 沟通
- 其他终端用户产业
- 按地区
- 北美洲
- 美国
- 加拿大
- 墨西哥
- 南美洲
- 巴西
- 阿根廷
- 智利
- 南美洲其他地区
- 欧洲
- 德国
- 英国
- 法国
- 义大利
- 西班牙
- 其他欧洲地区
- 亚太地区
- 中国
- 印度
- 日本
- 韩国
- 马来西亚
- 新加坡
- 澳洲
- 亚太其他地区
- 中东和非洲
- 中东
- 阿拉伯聯合大公国
- 沙乌地阿拉伯
- 土耳其
- 其他中东地区
- 非洲
- 南非
- 奈及利亚
- 其他非洲地区
- 中东
- 北美洲
第六章 竞争情势
- 市场集中度
- 策略趋势
- 市占率分析
- 公司简介
- Environmental Systems Research Institute, Inc.(Esri)
- Hexagon AB
- Trimble Inc.
- Autodesk, Inc.
- Bentley Systems, Incorporated
- Topcon Positioning Systems, Inc.
- Pitney Bowes, Inc.(Precisely)
- Caliper Corporation
- Mapbox, Inc.
- Maxar Technologies Inc.
- Fugro NV
- SuperMap Software Co., Ltd.
- CARTO(CartoDB Inc.)
- Blue Marble Geographics, LLC
- GIS Cloud Ltd.
- TomTom NV
- Seequent Limited
- Spatialworks, Inc.
- Geosoft Inc.
- Woolpert, Inc.
- NV5 Geospatial Solutions, Inc.
- BlackSky Technology Inc.
第七章 市场机会与未来展望
The Geographic Information System market was valued at USD 14.56 billion in 2025 and estimated to grow from USD 16.58 billion in 2026 to reach USD 31.8 billion by 2031, at a CAGR of 13.94% during the forecast period (2026-2031).
Rapid smart-city roll-outs, national open-data mandates, and cloud-native deployments keep demand on an upward slope. Automated feature extraction from sub-30 cm imagery and real-time spatial analytics now reduce decision latency from weeks to minutes, pushing adoption in transportation, oil and gas, and public safety applications. Vendors that bundle AI, edge processing, and managed services continue to gain share as enterprises prioritize scalability and cyber-secure integration with operational networks.
Global Geographic Information System Market Trends and Insights
Widespread Smart-City Roll-Outs Require Real-Time Geospatial Infrastructure
City agencies are integrating the Geographic information system market platforms with 5G, IoT, and edge compute to orchestrate urban services. Singapore's Open Digital Platform synchronizes district cooling, waste, and energy through streaming geospatial feeds, improving incident response and infrastructure uptime. Los Angeles uses real-time dashboards to route emergency crews, drawing 3.5 million situational-awareness map views during peak events. As municipalities budget for digital twins, vendors that deliver scalable 3D visualization, sensor APIs, and cybersecurity hardening capture a growing portion of public-sector IT spend.
Cloud-Native GIS Lowers TCO and Speeds Enterprise Integration
Bell Canada saved 40-60% in infrastructure outlay by shifting to a cloud-native geospatial data platform, illustrating how containerized micro-services and managed upgrades shorten deployment cycles. ArcGIS Enterprise on Kubernetes and similar offerings align GIS operations with DevOps pipelines, allowing dynamic scaling during disaster events without procurement delays. Push-down analytics in cloud data warehouses eliminate ETL bottlenecks, widening the Geographic information system market addressable base beyond traditional mapping teams.
Legacy IT Integration Complexity with OT and SCADA Systems
Utilities merging modern GIS with decades-old SCADA confront data-model mismatches, protocol gaps, and new cyber-threat surfaces. Liberty Utilities extended its migration timeline by 18 months due to iterative testing and middleware development. These overruns shift spending toward professional services, slowing software conversions in the Geographic information system market.
Other drivers and restraints analyzed in the detailed report include:
- Mobile-First Field-Data-Collection Platforms Expand Addressable User Base
- AI-Powered Auto-Classification of Satellite Imagery Accelerates Analytics
- Persistent Data-Quality / Lineage Gaps in Crowdsourced Layers
For complete list of drivers and restraints, kindly check the Table Of Contents.
Segment Analysis
Services revenue in the Geographic information system market rose sharply in 2026, advancing at a 15.45% CAGR as enterprises outsourced cloud migration, AI model tuning, and lifecycle support. Managed-service bundles now cover data-quality audits, security patching, and 24/7 monitoring, shifting spending from capital to operating budgets. Software still accounts for 53.60% of 2025 sales, anchored by the ArcGIS, Hexagon NetWorks, and Trimble Cityworks portfolios. Their continuous update cadence, Esri reinvests roughly 28% of annual turnover into R&D, keeping feature velocity high, while open-API frameworks welcome third-party extensions. Hardware remains essential for GNSS receivers, lidar scanners, and rugged tablets, yet margins compress as more functions migrate into the software layer. The geographic information system market size tied to pure hardware shipments therefore grows more slowly, even as sensor count climbs.
Industry buyers favor vendors that can deliver outcome-oriented service-level agreements; for example, Hexagon's 2025 decision to divest non-core assets freed capital to bolster subscription support offerings. Training academies, DevOps toolchains, and certified partner networks now form critical selection criteria, signaling a pivot from license counts to customer success metrics across the Geographic information system market.
Mapping held a 34.10% share in 2025, furnishing the spatial context for every downstream workflow. Yet the analytics sub-segment is expanding fastest at 15.70% CAGR, powered by edge inference, foundation models, and data-lakehouse architectures. Enterprises embed predictive geofencing into ERPs, while authorities model urban heat islands through multi-spectral stacks. Surveying remains steady, reinvented through drone photogrammetry that compresses week-long terrain captures into same-day deliverables.
Telematics gains from electric-vehicle routing and cold-chain monitoring, integrating EV-specific range calculations. Location-based services flourish via hyper-personalized retail apps that trigger in-store promotions, though competition from native smartphone OS APIs keeps vendor margins in check. Overall, the Geographic information system market aligns functional roadmaps around holistic data-fabric principles, merging ingestion, cataloging, and AI pipelines under a single governance umbrella.
The Geographic Information System (GIS) Market Report is Segmented by Component (Hardware, Software, and Services), Function (Mapping, Surveying, and More), Deployment Mode (On-Premise and Cloud), End-User Industry (Agriculture, Utilities, Mining, Construction, and More), and Geography. The Market Forecasts are Provided in Terms of Value (USD).
Geography Analysis
North America preserved 37.80% of 2025 spending, thanks to mature cloud infrastructure, robust R&D funding, and agency mandates like the U.S. Geospatial Data Act that standardize interoperability and metadata. Federal programs secure multi-year budgets for wildfire modeling, broadband equity mapping, and critical-infrastructure resilience. Enterprises such as Trimble invest more than USD 660 million annually in innovation, generating patents that reinforce the region's technological edge. Yet rising cloud-de-storage fees pose cost challenges for petabyte-class imagery analytics, motivating negotiations for localized sovereign clouds.
Asia-Pacific is on track for the highest 15.95% regional CAGR, fuelled by megacity modernization and infrastructure stimulus. Singapore scales 3D underground mapping to mitigate space constraints, while India's Digital Twin Mission links logistics corridors with unified parcel-level cadasters. Saudi Arabia's USD 1 billion digital-twin collaboration with Naver underscores Gulf ambitions for smart-city leadership. Regional hurdles include fragmented data-residency rules and varying export controls, yet domestic satellite launches and sovereign cloud zones are mitigating dependencies.
Europe's growth remains steady, anchored by the INSPIRE directive that democratizes high-value datasets. Open access spawns start-ups specializing in climate-risk scoring and renewable-siting analytics. GDPR influences architecture design, spurring privacy-enhancing computation and in-region processing. South America, the Middle East, and Africa together represent a smaller base but display accelerated adoption in mineral exploration, precision agriculture, and infrastructure security. These markets often leapfrog legacy systems, adopting cloud-native GIS from inception, thereby enlarging the Geographic information system market size through greenfield demand.
- Environmental Systems Research Institute, Inc. (Esri)
- Hexagon AB
- Trimble Inc.
- Autodesk, Inc.
- Bentley Systems, Incorporated
- Topcon Positioning Systems, Inc.
- Pitney Bowes, Inc. (Precisely)
- Caliper Corporation
- Mapbox, Inc.
- Maxar Technologies Inc.
- Fugro N.V.
- SuperMap Software Co., Ltd.
- CARTO (CartoDB Inc.)
- Blue Marble Geographics, LLC
- GIS Cloud Ltd.
- TomTom N.V.
- Seequent Limited
- Spatialworks, Inc.
- Geosoft Inc.
- Woolpert, Inc.
- NV5 Geospatial Solutions, Inc.
- BlackSky Technology Inc.
Additional Benefits:
- The market estimate (ME) sheet in Excel format
- 3 months of analyst support
TABLE OF CONTENTS
1 INTRODUCTION
- 1.1 Study Assumptions and Market Definition
- 1.2 Scope of the Study
2 RESEARCH METHODOLOGY
3 EXECUTIVE SUMMARY
4 MARKET LANDSCAPE
- 4.1 Market Overview
- 4.2 Market Drivers
- 4.2.1 Widespread smart-city roll-outs require real-time geospatial infrastructure
- 4.2.2 Cloud-native GIS lowers TCO and speeds enterprise integration
- 4.2.3 Mobile-first field-data-collection platforms expand addressable user base
- 4.2.4 AI-powered auto-classification of satellite imagery accelerates analytics
- 4.2.5 Sub-30 cm commercial microsatellite constellations unlock new precision use-cases
- 4.2.6 National open-data mandates (EU INSPIRE 2.0, US GDA, etc.) drive adoption
- 4.3 Market Restraints
- 4.3.1 Legacy IT integration complexity with OT and SCADA systems
- 4.3.2 Persistent data-quality/lineage gaps in crowdsourced layers
- 4.3.3 Rising cloud-egress fees for petabyte-scale imagery archives
- 4.3.4 Export-control tightening on high-resolution geospatial data
- 4.4 Value Chain Analysis
- 4.5 Regulatory Landscape
- 4.6 Technological Outlook
- 4.7 Industry Attractiveness - Porter's Five Forces Analysis
- 4.7.1 Bargaining Power of Suppliers
- 4.7.2 Bargaining Power of Buyers
- 4.7.3 Threat of New Entrants
- 4.7.4 Threat of Substitutes
- 4.7.5 Intensity of Competitive Rivalry
- 4.8 Impact of Macroeconomic Factors on the Market
5 MARKET SIZE AND GROWTH FORECASTS (VALUES)
- 5.1 By Component
- 5.1.1 Hardware
- 5.1.2 Software
- 5.1.3 Services
- 5.2 By Function
- 5.2.1 Mapping
- 5.2.2 Surveying
- 5.2.3 Telematics and Navigation
- 5.2.4 Location-based Services
- 5.2.5 Geospatial Data Management and Analysis
- 5.3 By Deployment Mode
- 5.3.1 On-premise
- 5.3.2 Cloud
- 5.4 By End-user Industry
- 5.4.1 Agriculture
- 5.4.2 Utilities
- 5.4.3 Mining
- 5.4.4 Construction
- 5.4.5 Transportation and Logistics
- 5.4.6 Oil and Gas
- 5.4.7 Government and Defence
- 5.4.8 Telecommunications
- 5.4.9 Other End-user Industries
- 5.5 By Geography
- 5.5.1 North America
- 5.5.1.1 United States
- 5.5.1.2 Canada
- 5.5.1.3 Mexico
- 5.5.2 South America
- 5.5.2.1 Brazil
- 5.5.2.2 Argentina
- 5.5.2.3 Chile
- 5.5.2.4 Rest of South America
- 5.5.3 Europe
- 5.5.3.1 Germany
- 5.5.3.2 United Kingdom
- 5.5.3.3 France
- 5.5.3.4 Italy
- 5.5.3.5 Spain
- 5.5.3.6 Rest of Europe
- 5.5.4 Asia-Pacific
- 5.5.4.1 China
- 5.5.4.2 India
- 5.5.4.3 Japan
- 5.5.4.4 South Korea
- 5.5.4.5 Malaysia
- 5.5.4.6 Singapore
- 5.5.4.7 Australia
- 5.5.4.8 Rest of Asia-Pacific
- 5.5.5 Middle East and Africa
- 5.5.5.1 Middle East
- 5.5.5.1.1 United Arab Emirates
- 5.5.5.1.2 Saudi Arabia
- 5.5.5.1.3 Turkey
- 5.5.5.1.4 Rest of Middle East
- 5.5.5.2 Africa
- 5.5.5.2.1 South Africa
- 5.5.5.2.2 Nigeria
- 5.5.5.2.3 Rest of Africa
- 5.5.5.1 Middle East
- 5.5.1 North America
6 COMPETITIVE LANDSCAPE
- 6.1 Market Concentration
- 6.2 Strategic Moves
- 6.3 Market Share Analysis
- 6.4 Company Profiles (includes Global level Overview, Market level overview, Core Segments, Financials as available, Strategic Information, Market Rank/Share for key companies, Products and Services, and Recent Developments)
- 6.4.1 Environmental Systems Research Institute, Inc. (Esri)
- 6.4.2 Hexagon AB
- 6.4.3 Trimble Inc.
- 6.4.4 Autodesk, Inc.
- 6.4.5 Bentley Systems, Incorporated
- 6.4.6 Topcon Positioning Systems, Inc.
- 6.4.7 Pitney Bowes, Inc. (Precisely)
- 6.4.8 Caliper Corporation
- 6.4.9 Mapbox, Inc.
- 6.4.10 Maxar Technologies Inc.
- 6.4.11 Fugro N.V.
- 6.4.12 SuperMap Software Co., Ltd.
- 6.4.13 CARTO (CartoDB Inc.)
- 6.4.14 Blue Marble Geographics, LLC
- 6.4.15 GIS Cloud Ltd.
- 6.4.16 TomTom N.V.
- 6.4.17 Seequent Limited
- 6.4.18 Spatialworks, Inc.
- 6.4.19 Geosoft Inc.
- 6.4.20 Woolpert, Inc.
- 6.4.21 NV5 Geospatial Solutions, Inc.
- 6.4.22 BlackSky Technology Inc.
7 MARKET OPPORTUNITIES AND FUTURE OUTLOOK
- 7.1 White-space and Unmet-Need Assessment
 2026年全球国防地空市场报告2026年全球云端地理资讯系统(GIS)市场报告2026年全球地理资讯系统市场报告
 云端GIS市场规模、份额和成长分析:按最终用户、云端服务类型、市场洞察和地区划分-2026-2033年产业预测
 GIS控制器市场-全球产业规模、份额、趋势、机会、预测:按组件、设备、应用、地区和竞争对手划分,2021-2031年三维地质建模市场-全球产业规模、份额、趋势、机会与预测:按技术、部署模式、产品、地区和竞争格局划分,2021-2031年地理资讯系统市场-全球产业规模、份额、趋势、机会和预测:按组件、功能、最终用户产业、地区和竞争格局划分,2021-2031年
 地质建模软体市场:按技术、授权类型、部署模式、组织规模、应用程式和最终用户划分-2026-2032年全球预测
 地理资讯系统(GIS)市场规模、份额和成长分析(按类型、功能、产业和地区划分)-2026-2033年产业预测自然灾害管理市场:按解决方案类型、按灾害阶段、按灾害类型、按部署模式、按最终用户 - 全球预测,2025-2030 年