


 |
市场调查报告书
商品编码
1910808
热解油:市场占有率分析、产业趋势与统计、成长预测(2026-2031)Pyrolysis Oil - Market Share Analysis, Industry Trends & Statistics, Growth Forecasts (2026 - 2031) |
||||||
※ 本网页内容可能与最新版本有所差异。详细情况请与我们联繫。
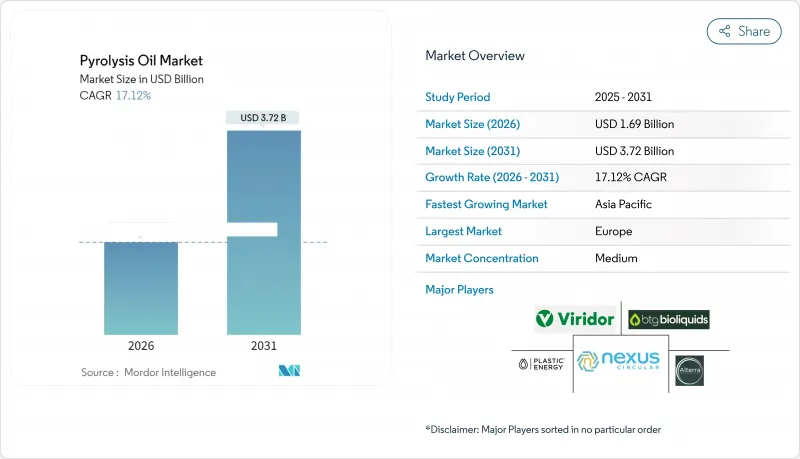
2025 年热解油市场价值为 14.4 亿美元,预计从 2026 年的 16.9 亿美元成长到 2031 年的 37.2 亿美元,在预测期(2026-2031 年)内复合年增长率为 17.12%。
更严格的塑胶废弃物法规、循环经济政策以及炼油厂共加工技术的进步正在加速需求成长,而慷慨的碳信用计画则改善了工厂的经济效益。来自欧洲创新基金和日本新能源产业技术综合开发机构(NEDO)的策略性资金支持产能扩张,使竞争格局向政策环境有利的地区倾斜。生产商正寻求与炼油厂进行垂直整合,以降低资本支出并确保销售保障。同时,技术授权公司正竞相将微波辅助和超临界製程等能够提高产量和减少排放的製程商业化。然而,随着以规格为导向的客户收紧容差限值,污染物控制,特别是多环芳烃(PAHs)的控制,仍然是一项重大的营运挑战。
全球热解油市场趋势与洞察
对可再生和循环燃料替代品的需求不断增长
加州的低碳燃料标准(LCFS)旨在2030年将碳排放强度降低30%,并颁发高价值的碳信用额度,使废弃物衍生的热解油能够与石油原料竞争。加拿大的无污染燃料法规设定了15%的减排目标,并提供15亿美元的资金用于国内生产,提振了北美市场的需求。同时,日本的塑胶资源循环策略和美国的永续航空燃料税额扣抵热解油定位为一种具有直接经济效益的合格原料。这些措施正在将废弃油从环境负担转变为一种合规的脱碳商品。
加强全球对塑胶废弃物的监管和禁令
欧洲到2030年实现包装100%回收的强制性要求,以及中国到2025年回收40亿吨固态废弃物的目标,正以指数级速度推动对机械回收以外加工方式的需求增长。加拿大将于2025年9月生效的联邦塑胶登记制度,将为原料建立透明的追踪系统,有利于具备品质认证能力的先进设施。印尼30%的废弃物减量目标也将进一步拓宽原料来源。这些监管趋势将确保原材料供应的长期稳定,并鼓励对高效热解技术的投资。
储存和运输过程中的腐蚀性和不稳定性
轮胎衍生油通常含有10%或以上的多环芳烃,例如苯并[a]芘,因此需要使用不锈钢或内衬储罐,并进行惰性气体吹扫,从而推高了物流成本。混合塑胶油的硫、氧和氯化物含量较高,如果不进行预处理,会污染炼油催化剂。生产后的持续反应会导致其在长途运输过程中黏度和酸度发生变化,因此需要添加稳定剂并进行温度控制。这些技术难题限制了跨境贸易,阻碍了标准化进程,延缓了其在全球的推广应用。
细分市场分析
到2025年,废弃塑胶将占热解油市场份额的55.02%,预计到2031年,该细分市场将以18.92%的复合年增长率成长。由于全球塑胶废弃物每年超过3.8亿吨,而机械回收率却停滞在10%以下,因此,以废弃塑胶为原料的热解油市场规模预计也将扩大。
混合塑胶加工技术的进步,例如Resonac公司60%以上的产率技术以及聚丙烯与生物质的协同共热解技术,简化了原料製备流程并降低了分类成本。废旧轮胎作为第二大主要原料,虽然受益于有序的收集,但其多环芳烃(PAH)污染程度较高,导致价格折扣。生物质原料在脱氧方面面临挑战,且需要高成本的加氢处理,限制了即时扩大生产规模。精炼原料中氯化物和硫含量的严格监管推动了对高纯度塑胶油的需求,从而在整个原料市场中催生了一个高端细分市场。
《热解油报告》按原料(废弃塑胶、废轮胎、生物质及其他)、应用(燃料和化学品)以及地区(亚太地区、北美地区、欧洲地区、南美地区以及中东和非洲地区)进行细分。市场预测以美元以金额为准。
区域分析
在政策明确和专案资金筹措来源的支持下,欧洲在 2025 年占全球销售量的 35.74%。该地区拥有利安德巴塞尔公司年产能 5 万吨的韦瑟林工厂和 OMV 公司年产能 16,000 吨的 ReOil 工厂,这两家工厂都提供可扩展的生产能力,并且与焚烧相比,碳足迹更低。
亚太地区是成长最快的市场,复合年增长率高达22.98%,这主要得益于日本新能源产业技术综合开发机构(NEDO)的资金支持、中国40亿吨废弃物利用目标,以及诸如茨城县ENEOS-三菱化学水热发电厂等开创性计划。东南亚地区也紧跟其后,印尼合作伙伴JGC和丸红株式会社正在评估模组化的Pyro-Blue系统,以应对日益严重的海洋塑胶污染问题。
在北美,长期供应协议和健全的低碳燃料标准(LCFS)积分系统正在推动潜在成长。陶氏化学与Freepoint的供应协议为其位于亚利桑那州的年产能18万吨的生产基地提供支持;而Nova Chemicals正在安大略省采用Plastic Energy的Tacoil工艺,新增年产能6.6万吨,这有助于该公司实现到2030年产品中再生材料含量达到30%的目标。
其他福利:
- Excel格式的市场预测(ME)表
- 分析师支持(3个月)
目录
第一章 引言
- 研究假设和市场定义
- 调查范围
第二章调查方法
第三章执行摘要
第四章 市场情势
- 市场概览
- 市场驱动因素
- 对可再生和循环燃料替代品的需求不断增长
- 加强全球塑胶废弃物的监管和禁令
- 化学回收投资项目正在增加
- FCC/加氢处理联合供应可降低炼油厂资本支出
- 低碳热解油的排碳权货币化
- 市场限制
- 储存和运输过程中的腐蚀性和不稳定性
- 高额资本投入与规模扩张风险
- 对多环芳烃(PAHs)和污染物的担忧导致监管延误
- 价值链分析
- 波特五力模型
- 供应商的议价能力
- 买方的议价能力
- 新进入者的威胁
- 替代产品和服务的威胁
- 竞争程度
第五章 市场规模与成长预测
- 按原料
- 废弃塑胶
- 废轮胎
- 生物质
- 其他的
- 透过使用
- 燃料
- 化学品
- 按地区
- 亚太地区
- 中国
- 印度
- 日本
- 韩国
- 马来西亚
- 泰国
- 印尼
- 越南
- 亚太其他地区
- 北美洲
- 美国
- 加拿大
- 墨西哥
- 欧洲
- 德国
- 英国
- 法国
- 义大利
- 西班牙
- 北欧国家
- 土耳其
- 俄罗斯
- 其他欧洲地区
- 南美洲
- 巴西
- 阿根廷
- 哥伦比亚
- 南美洲其他地区
- 中东和非洲
- 沙乌地阿拉伯
- 南非
- 奈及利亚
- 卡达
- 埃及
- 阿拉伯聯合大公国
- 摩洛哥
- 其他中东和非洲地区
- 亚太地区
第六章 竞争情势
- 市场集中度
- 策略趋势
- 市占率(%)/排名分析
- 公司简介
- Agilyx
- Alterra Energy, LLC
- Arbios Biotech
- Bioenergy AE Cote-Nord
- BTG Bioliquids(Green Fuel Nordic Oy)
- Kerry Group plc
- New Energy Kft.
- New Hope Energy
- Nexus Circular
- Plastic Energy
- Pyrocell(Setra)
- Scandinavian Enviro Systems AB
- Trident Fuels pty ltd
- Twence
- Viridor Limited
第七章 市场机会与未来展望
The Pyrolysis Oil Market was valued at USD 1.44 billion in 2025 and estimated to grow from USD 1.69 billion in 2026 to reach USD 3.72 billion by 2031, at a CAGR of 17.12% during the forecast period (2026-2031).
Heightened plastic-waste regulations, circular-economy mandates and refinery co-processing breakthroughs together accelerate demand, while generous carbon-credit schemes improve plant economics. Strategic funding from Europe's Innovation Fund and Japan's NEDO program underpins capacity additions that shift the competitive balance toward regions with supportive policy ecosystems. Producers pursue vertical integration with refiners to reduce capital outlays and secure guaranteed offtake, and technology licensors are racing to commercialize microwave-assisted or supercritical routes that improve yield and cut emissions. At the same time, contaminant management, particularly for polycyclic aromatic hydrocarbons, remains the key operational hurdle as specification-driven customers tighten acceptance limits.
Global Pyrolysis Oil Market Trends and Insights
Rising Demand for Renewable and Circular Fuel Substitutes
California's Low Carbon Fuel Standard now targets a 30% carbon-intensity cut by 2030, issuing high-value credits that make waste-derived pyrolysis oil competitive with petroleum inputs. Canada's Clean Fuel Regulations set a 15% reduction goal and earmark USD 1.5 billion for domestic production, reinforcing North American demand. In parallel, Japan's plastics resource-circulation strategy and U.S. sustainable aviation-fuel tax credits position pyrolysis oil as a qualifying feedstock with direct financial upside. Together these measures transform waste oil from an environmental liability into a compliance-grade decarbonization commodity.
Stricter Plastic-Waste Regulations and Bans Worldwide
Europe's mandate for 100% recyclable packaging by 2030 and China's push to recycle 4 billion tons of bulk solid waste by 2025 sharply raise demand for processing routes beyond mechanical recycling. Canada's Federal Plastics Registry, effective September 2025, adds transparent feedstock tracking that favors advanced facilities capable of quality certification. Indonesia's 30% waste-reduction target further broadens the raw-material pool. These regulatory forces provide predictable long-term feedstock streams and catalyze investments in high-efficiency thermal decomposition.
Corrosivity and Instability During Storage/Transport
Tire-derived oils often contain more than 10% polycyclic aromatic hydrocarbons such as benzo[a]pyrene, requiring stainless or lined tanks and inert-gas blanketing, which inflate logistics costs. Mixed-plastic oils exhibit elevated sulfur, oxygen and chloride levels that foul refinery catalysts unless pre-treated. Ongoing post-production reactions alter viscosity and acidity during long-haul shipment, demanding stabilizers and temperature control. These technical complications restrict cross-border trade and limit standardization, slowing global adoption.
Other drivers and restraints analyzed in the detailed report include:
- FCC/Hydro-Processing Co-Feeding Lowers Refinery CAPEX
- Carbon-Credit Monetization for Low-Carbon Pyrolysis Oil
- PAH/Contaminant Concerns Triggering Regulatory Delays
For complete list of drivers and restraints, kindly check the Table Of Contents.
Segment Analysis
Waste plastics held 55.02% of the pyrolysis oil market share in 2025, and the segment is tracking a 18.92% CAGR through 2031. The pyrolysis oil market size attributable to waste-plastic feedstock is projected to rise in tandem as global plastic waste exceeds 380 million t y while mechanical recycling stalls below 10% recovery.
Advances in mixed-plastic processing, such as Resonac's more than or equal to 60% yield technology and synergistic co-pyrolysis of polypropylene with biomass, simplify feed preparation and cut sorting costs. Tire waste, the second-largest input group, benefits from well-organized collection but suffers from higher PAH contamination that commands price discounts. Biomass streams face oxygen-removal challenges that require costly hydrotreatment, limiting immediate scale-up. As regulators tighten chloride and sulfur limits for refinery feed, demand is rising for high-purity plastic oils, creating a premium segment within overall feedstock markets.
The Pyrolysis Oil Report is Segmented by Raw Material (Waste Plastics, Waste Tires, Biomass, and Others), Application (Fuels and Chemicals), and Geography (Asia-Pacific, North America, Europe, South America, and Middle-East and Africa). The Market Forecasts are Provided in Terms of Value (USD).
Geography Analysis
Europe accounted for 35.74% of global sales in 2025, underpinned by policy clarity and dedicated funding streams. The region hosts LyondellBasell's 50,000 tons per year Wesseling unit and OMV's 16,000 tons per year ReOil plant, both demonstrating scalable output with lower carbon footprints versus incineration.
Asia-Pacific is the fastest-growing market at a 22.98% CAGR, fueled by Japan's NEDO funding, China's 4 billion-t waste-utilization target and breakthrough projects such as ENEOS-Mitsubishi Chemical's hydrothermal plant in Ibaraki. Southeast Asia is following suit, with Indonesian partners JGC and Marubeni evaluating modular Pyro-Blue systems to tackle rising marine-plastic inflows.
North America shows accelerating potential through long-term offtake contracts and robust LCFS credit structures. Dow's supply deal with Freepoint anchors a 180,000 tons per year Arizona complex, and NOVA Chemicals will add 66,000 tons per year of capacity in Ontario using Plastic Energy's Tacoil process, supporting its 30% recycled content pledge by 2030.
- Agilyx
- Alterra Energy, LLC
- Arbios Biotech
- Bioenergy AE Cote-Nord
- BTG Bioliquids (Green Fuel Nordic Oy)
- Kerry Group plc
- New Energy Kft.
- New Hope Energy
- Nexus Circular
- Plastic Energy
- Pyrocell (Setra)
- Scandinavian Enviro Systems AB
- Trident Fuels pty ltd
- Twence
- Viridor Limited
Additional Benefits:
- The market estimate (ME) sheet in Excel format
- 3 months of analyst support
TABLE OF CONTENTS
1 Introduction
- 1.1 Study Assumptions and Market Definition
- 1.2 Scope of the Study
2 Research Methodology
3 Executive Summary
4 Market Landscape
- 4.1 Market Overview
- 4.2 Market Drivers
- 4.2.1 Rising demand for renewable and circular fuel substitutes
- 4.2.2 Stricter plastic-waste regulations and bans worldwide
- 4.2.3 Rising chemical-recycling investment pipelines
- 4.2.4 FCC / hydro-processing co-feeding lowers refinery CAPEX
- 4.2.5 Carbon-credit monetisation for low-carbon pyrolysis oil
- 4.3 Market Restraints
- 4.3.1 Corrosivity and instability during storage/transport
- 4.3.2 High CAPEX and scale-up execution risk
- 4.3.3 PAH/contaminant concerns triggering regulatory delays
- 4.4 Value Chain Analysis
- 4.5 Porter's Five Forces
- 4.5.1 Bargaining Power of Suppliers
- 4.5.2 Bargaining Power of Buyers
- 4.5.3 Threat of New Entrants
- 4.5.4 Threat of Substitute Products and Services
- 4.5.5 Degree of Competition
5 Market Size and Growth Forecasts (Value)
- 5.1 By Raw Material
- 5.1.1 Waste Plastics
- 5.1.2 Waste Tires
- 5.1.3 Biomass
- 5.1.4 Others
- 5.2 By Application
- 5.2.1 Fuels
- 5.2.2 Chemicals
- 5.3 By Geography
- 5.3.1 Asia-Pacific
- 5.3.1.1 China
- 5.3.1.2 India
- 5.3.1.3 Japan
- 5.3.1.4 South Korea
- 5.3.1.5 Malaysia
- 5.3.1.6 Thailand
- 5.3.1.7 Indonesia
- 5.3.1.8 Vietnam
- 5.3.1.9 Rest of Asia-Pacific
- 5.3.2 North America
- 5.3.2.1 United States
- 5.3.2.2 Canada
- 5.3.2.3 Mexico
- 5.3.3 Europe
- 5.3.3.1 Germany
- 5.3.3.2 United Kingdom
- 5.3.3.3 France
- 5.3.3.4 Italy
- 5.3.3.5 Spain
- 5.3.3.6 Nordic Countries
- 5.3.3.7 Turkey
- 5.3.3.8 Russia
- 5.3.3.9 Rest of Europe
- 5.3.4 South America
- 5.3.4.1 Brazil
- 5.3.4.2 Argentina
- 5.3.4.3 Colombia
- 5.3.4.4 Rest of South America
- 5.3.5 Middle-East and Africa
- 5.3.5.1 Saudi Arabia
- 5.3.5.2 South Africa
- 5.3.5.3 Nigeria
- 5.3.5.4 Qatar
- 5.3.5.5 Egypt
- 5.3.5.6 United Arab Emirates
- 5.3.5.7 Morocco
- 5.3.5.8 Rest of Middle-East and Africa
- 5.3.1 Asia-Pacific
6 Competitive Landscape
- 6.1 Market Concentration
- 6.2 Strategic Moves
- 6.3 Market Share (%)/Ranking Analysis
- 6.4 Company Profiles (includes Global level Overview, Market level overview, Core Segments, Financials as available, Strategic Information, Market Rank/Share for key companies, Products and Services, and Recent Developments)
- 6.4.1 Agilyx
- 6.4.2 Alterra Energy, LLC
- 6.4.3 Arbios Biotech
- 6.4.4 Bioenergy AE Cote-Nord
- 6.4.5 BTG Bioliquids (Green Fuel Nordic Oy)
- 6.4.6 Kerry Group plc
- 6.4.7 New Energy Kft.
- 6.4.8 New Hope Energy
- 6.4.9 Nexus Circular
- 6.4.10 Plastic Energy
- 6.4.11 Pyrocell (Setra)
- 6.4.12 Scandinavian Enviro Systems AB
- 6.4.13 Trident Fuels pty ltd
- 6.4.14 Twence
- 6.4.15 Viridor Limited
7 Market Opportunities and Future Outlook
- 7.1 White-space and Unmet-need Assessment
 废弃物衍生热解油市场分析及预测(至2035年):类型、产品类型、技术、应用、最终用户、製程、安装类型、设备、解决方案与阶段
 热解油市场规模、份额和成长分析(按类型、原料、原料、改质方法、製程技术、应用和地区划分)—产业预测(2026-2033 年)
 全球轮胎热解产品市场:市场规模、份额、趋势分析(按产品、最终用途和地区划分)、细分市场预测(2025-2033 年)
 轮胎热解产品市场:依产品类型、製程技术、营运规模、应用、最终用户、国家及地区划分-全球产业分析、市场规模、市场占有率及2025-2032年预测
 全球热解油市场全球轮胎热解产品市场
 全球废弃塑胶热解油市场预测(至2032年):按塑胶类型、热解方法、反应器配置、营运规模、分销管道、最终用户和地区划分
 生物质热解油市场-全球产业规模、份额、趋势、机会和预测,按类型、应用、地区和竞争细分,2020-2030 年
 塑胶废弃物热解油市场机会、成长动力、产业趋势分析及2025-2034年预测
 废弃物衍生热解油市场:产业分析、规模、占有率、成长、趋势和预测,2025-2032 年