


 |
市场调查报告书
商品编码
1910815
印刷柔性感测器:市场占有率分析、产业趋势与统计、成长预测(2026-2031)Printed Flexible Sensor - Market Share Analysis, Industry Trends & Statistics, Growth Forecasts (2026 - 2031) |
||||||
※ 本网页内容可能与最新版本有所差异。详细情况请与我们联繫。
预计印刷柔性感测器市场将从 2025 年的 28.1 亿美元成长到 2026 年的 30.5 亿美元,到 2031 年将达到 45.6 亿美元,2026 年至 2031 年的复合年增长率为 8.39%。
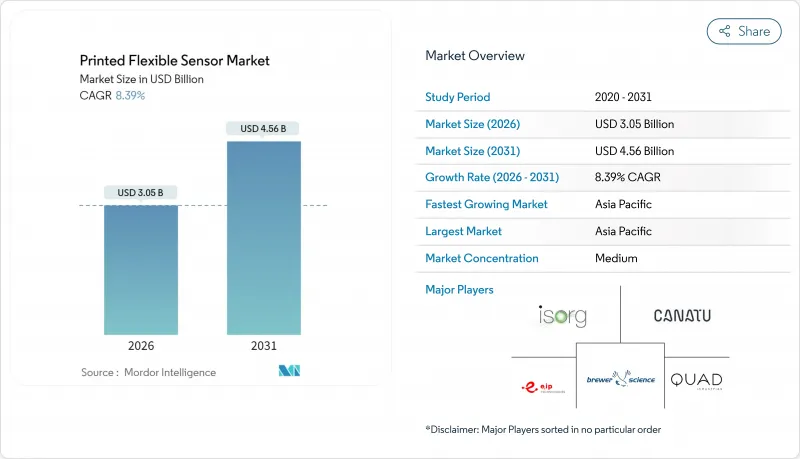
这项稳步扩张得益于卷对卷增材製造技术的进步、支持国内半导体产能的政策奖励,以及家用电子电器、医疗可穿戴设备、汽车系统和国防平台等领域对可适应性感测解决方案日益增长的需求。新的印刷製程可将资本支出降低40%以上,进而降低成熟企业和新兴企业的进入门槛,而成本优化仍是成长的关键驱动力。政府项目,例如拜登-哈里斯政府拨款16亿美元用于先进封装,凸显了软性电子产品基础设施的战略重要性。凭藉规模优势,尤其是在扩大柔性OLED产能方面,亚太地区预计在2030年前供应近一半的印刷感测器。同时,欧洲的监管发展正在推动对可回收感测器结构的需求。
全球印刷柔性感测器市场趋势及展望
节能超薄家用电子电器的需求不断增长
智慧型手机和穿戴式装置厂商正在采用印刷柔性感测器,以实现传统刚性组件无法实现的折迭式显示器和压力感测外壳。超低功耗架构延长了设备电池续航时间,并实现了纤薄外形规格,同时满足了消费者对节能的需求。宾州州立大学的研究开发了一种自组装导电网络,无需二次活化步骤,从而降低了製造过程中的能耗。压力映射表面正越来越多地应用于游戏周边设备,将印刷柔性感测器的市场拓展到行动装置之外。类似的超薄可弯曲薄膜也正在应用于工业监测领域,在这些领域中,感测器必须能够贴合曲面设备,同时又不增加厚度。
在医疗穿戴式装置和生物感测领域不断扩大应用
医疗机构正在部署印刷生物感测器进行即时生命征象监测,加速向预防性和远端医疗转型。科思创和埃森哲合作,利用Baymedix黏合剂和Platilon TPU薄膜,开发出透气舒适的贴片式感测器。韩国材料科学研究院展示了一种灵敏度为1 ppm的氨气侦测器,开创了非侵入性诊断在肾臟病监测领域应用的先河。随着柔性设备临床证据的累积和监管流程的简化,生物感测器有望在印刷柔性感测器市场中占据最快的成长轨道。
与硅感测器相比,精度和稳定性方面存在差异
印刷式压力感测器在长期稳定性方面仍逊于微加工硅材料,尤其是在温度波动和机械疲劳条件下。微晶硅元件的灵敏度係数可达31,漂移极小,而印刷薄膜在精确度要求高的应用上可能出现不可接受的偏差。临床评估报告显示,柔性压力感测器的精度在88%至94%之间,足以满足指标监测的要求,但无法达到侵入性侦测的基准值。目前正在进行封装和奈米复合油墨方面的研究,以缩小性能差距。
细分市场分析
至2025年,印刷式压力感测器将占柔性感测器市场总量的27.95%,为智慧型手机、游戏控制器和汽车触控面板提供触觉介面。生物感测器领域也呈现同步成长势头,年复合成长率达9.03%,反映医疗保健领域对非侵入性、运作病患监测的需求日益增长。随着诊断技术从医疗机构向消费领域转移,生物感测器的快速成长正在推动印刷式柔性感测器市场的扩张。强劲的需求与人工智慧赋能的分析技术相辅相成,高解析度应变计可用于绘製动态,从而建立復健回馈迴路。此外,能够检测1ppm氨气的气体感测器在农业和环境健康领域开闢了新的应用前景,预示着印刷式柔性感测器产业产品系列的多元化发展。
邻近市场将推动差异化发展:用于智慧包装的光学检测器可实现新鲜度认证,而编织到电子纺织品中的应变感测器则可采集人体工学指标,用于工业安全专案。生物感测器的印刷柔性感测器市场规模预计将超过传统领域,因为聚合物基板和奈米工程油墨的结合可在不影响佩戴舒适度的前提下提供临床实用的灵敏度。酵素功能化电极和自修復导体的研发投入不断增加,预计将巩固该领域相对于传统压力和温度感测器的优势。
网版印刷凭藉其厚膜印刷能力和低单位成本,预计2025年将维持35.55%的市占率。而喷墨印刷预计8.78%的复合年增长率则预示着产业正朝着更高解析度图案和多材料相容性方向发展。随着线宽接近20微米以下的极限,喷墨平台能够在有限面积内实现高密度互连,进而推动印刷柔性感测器市场的微型化蓝图。新兴的气溶胶喷射印刷和3D列印技术能够将导电浆料应用于非平面形状,满足航空电子设备和医疗植入所需的贴合性,进一步拓展了设计自由度。
儘管凹版和柔版印刷生产线仍然是生产数百万台消费性电子设备的主要方式,但喷墨技术的数位化特性缩短了换线时间,并实现了感测器布局的大规模客製化。学术团队展示了亚微米碳奈米管电晶体的毛细流动印刷技术,实现了与光刻技术相媲美的微型化,标誌着竞争格局的关键转折点。随着油墨供应商将光闪烧结无氧化物铜奈米流体商业化,其导电性可与块状银媲美,且不受贵金属价格的影响,与喷墨系统相关的柔性印刷感测器的市场规模预计将加速成长。
区域分析
预计到2025年,亚太地区将占据柔性印刷感测器市场46.35%的份额,并在2031年之前以8.71%的复合年增长率成长。中国主导产能扩张,京东方预计2028年超越三星显示,成为柔性OLED产能最大的企业。这项进展将保障上游材料的需求,并实现印刷感测器供应链的本地化。日本的精密製造传统和韩国在材料科学领域的深厚实力将增强该地区的韧性,而东南亚国家将为大规模生产的消费性电子产品提供高性价比的组装基地。
北美地区在收入方面排名第二。联邦政府的支持,例如16亿美元的先进封装计画和1.79亿美元的能源部微电子中心,正在帮助提升国内印刷柔性感测器产业的能力。国防开支推动了共形航空电子感测器的早期应用,而强大的医疗设备生态系统则加速了生物感测器的商业化进程。
欧洲正利用其在汽车产业的主导和严格的生态设计法规,推动可回收感测器的全球规范制定。 「转型计划」旨在建构区域性功能电子产品供应链,这将减少对亚洲进口的依赖,并将研发资金用于永续基板技术。儘管拉丁美洲和中东/非洲目前市场份额较小,但工业现代化和通讯基础设施的进步表明,这些地区存在潜在需求,尤其是在智慧电网和建筑自动化感测领域。
其他福利:
- Excel格式的市场预测(ME)表
- 3个月的分析师支持
目录
第一章 引言
- 研究假设和市场定义
- 调查范围
第二章调查方法
第三章执行摘要
第四章 市场情势
- 市场概览
- 市场驱动因素
- 节能超薄家用电子电器的需求不断增长
- 穿戴式医疗设备和生物感测技术的应用日益广泛
- 汽车车载人机互动系统与电池监控系统的集成
- 国防研发:用于保形航空电子设备和结构健康监测
- 卷对卷增材製造技术可减少超过40%的资本投资
- 欧盟生态设计政策倾向于使用可回收的印刷感测器
- 市场限制
- 与硅感测器相比,精度和稳定性方面存在差异
- 製造流程缺乏标准化
- 银奈米颗粒墨水的供应不稳定
- 高温应用案例缺乏可靠性数据
- 价值/供应链分析
- 监管环境
- 技术展望
- 波特五力模型
- 新进入者的威胁
- 买方的议价能力
- 供应商的议价能力
- 替代品的威胁
- 竞争对手之间的竞争
第五章 市场规模与成长预测
- 依感测器类型
- 生物感测器
- 触摸感应器
- 检测器
- 温度感测器
- 压力感测器
- 气体感测器
- 应变和力传感器
- 透过印刷技术
- 网版印刷
- 喷墨列印
- 凹版印刷
- 柔版印刷
- 3D/气溶胶喷射列印
- 按基础材料
- 聚酰亚胺(PI)
- PET
- PEN
- 纸张和纤维素
- 其他(玻璃、金属箔)
- 按最终用户行业划分
- 家用电子电器
- 医疗保健
- 车
- 工业和製造业
- 航太/国防
- 其他(智慧包装、建筑自动化)
- 按地区
- 北美洲
- 美国
- 加拿大
- 墨西哥
- 南美洲
- 巴西
- 阿根廷
- 南美洲其他地区
- 欧洲
- 德国
- 法国
- 英国
- 义大利
- 西班牙
- 俄罗斯
- 其他欧洲地区
- 亚太地区
- 中国
- 日本
- 韩国
- 印度
- 澳洲和纽西兰
- 东南亚
- 亚太其他地区
- 中东和非洲
- 中东
- 沙乌地阿拉伯
- 阿拉伯聯合大公国
- 土耳其
- 其他中东地区
- 非洲
- 南非
- 奈及利亚
- 其他非洲地区
- 中东
- 北美洲
第六章 竞争情势
- 市场集中度
- 策略趋势
- 市占率分析
- 公司简介
- Canatu Oy
- Brewer Science
- ISORG
- E2IP Technologies
- Quad Industries
- Pressure Profile Systems Inc.
- Butler Technologies Inc.
- Tekscan Inc.
- PST Sensors
- PolyIC GmbH and Co. KG
- Memtronik
- Linepro Controls Pvt. Ltd.
- Forciot
- Nissha Co. Ltd.
- TactoTek
- Interlink Electronics
- FlexEnable
- Heraeus Nexensos
- Molex
- 3M
第七章 市场机会与未来展望
The printed flexible sensor market is expected to grow from USD 2.81 billion in 2025 to USD 3.05 billion in 2026 and is forecast to reach USD 4.56 billion by 2031 at 8.39% CAGR over 2026-2031.
This steady expansion results from converging advances in roll-to-roll additive manufacturing, policy incentives supporting domestic semiconductor capacity, and rising demand for conformable sensing solutions across consumer electronics, medical wearables, automotive systems, and defense platforms. Cost optimization remains a pivotal growth lever as new printing processes shave more than 40% from capital expenditure outlays, thereby lowering entry barriers for both incumbents and start-ups. Government programs such as the Biden-Harris Administration's USD 1.6 billion allocation for advanced packaging underscore the strategic relevance of flexible electronics infrastructure.Asia-Pacific's scale advantage, particularly in flexible OLED capacity build-out, positions the region to supply nearly half of all printed sensors by 2030, while regulatory moves in Europe foster demand for recyclable sensor architectures.
Global Printed Flexible Sensor Market Trends and Insights
Rising Demand for Energy-Efficient, Ultra-Thin Consumer Electronics
Smartphone and wearable OEMs embed printed flexible sensors to deliver foldable displays and pressure-sensitive housings that conventional rigid components cannot support. Ultra-low-power architectures extend device battery life, meeting user expectations for energy efficiency while enabling slim form factors. Research at Penn State produced self-assembling conductive networks that remove secondary activation steps, trimming manufacturing energy budgets. Gaming peripherals increasingly rely on pressure-mapped surfaces, widening the printed flexible sensor market beyond mobile hardware. The same thin, bendable films are migrating into industrial monitoring where sensors must conform to curved equipment without adding bulk.
Increasing Adoption in Medical Wearables and Biosensing
Healthcare providers deploy printed biosensors for real-time vital-sign tracking, accelerating the shift toward preventive, remote care. Covestro's partnership with accensors yielded breathable, skin-friendly patch sensors that leverage Baymedix adhesives and Platilon TPU films. The Korea Institute of Materials Science demonstrated ammonia-gas detectors with 1 ppm sensitivity, opening non-invasive diagnostics for renal disease monitoring. Regulatory pathways are streamlining as flexible devices build clinical evidence, positioning biosensors to capture the fastest growth trajectory within the printed flexible sensor market.
Accuracy and Stability Gap vs. Silicon Sensors
Printed gauges still trail micro-machined silicon alternatives on long-term stability, especially when exposed to temperature swings or mechanical fatigue. Microcrystalline silicon devices achieve gauge factors of 31 with minimal drift, whereas printed films can deviate beyond acceptable thresholds in precision-critical deployments. Clinical evaluations report accuracy spreads of 88-94% for flexible pressure sensors, sufficient for indicative monitoring yet below invasive-grade benchmarks. Ongoing research into encapsulation layers and nanocomposite inks seeks to narrow the performance delta.
Other drivers and restraints analyzed in the detailed report include:
- Automotive In-Cabin HMI and Battery Monitoring Integration
- Defense R&D for Conformal Avionics and Structural Health Monitoring
- Lack of Fabrication Standardization
For complete list of drivers and restraints, kindly check the Table Of Contents.
Segment Analysis
Printed pressure sensors controlled 27.95% of the overall printed flexible sensor market share in 2025, supplying haptic interfaces to smartphones, gaming controllers, and automotive touch-surfaces. Parallel momentum in biosensors, expanding at a 9.03% CAGR, reflects healthcare's drive toward non-invasive, always-on patient monitoring. The biosensor surge widens the printed flexible sensor market as diagnostics migrate from clinic to consumer spheres. Robust demand intersects with AI-enabled analytics, where high-resolution strain gauges map biomechanics for rehabilitation feedback loops. Furthermore, gas sensors detecting 1 ppm ammonia open agricultural and environmental-health use-cases, illustrating portfolio diversification within the printed flexible sensor industry.
Market adjacencies amplify differentiation: photodetectors for smart packaging authenticate freshness, while strain sensors woven into e-textiles capture ergonomic metrics for industrial safety programs. The printed flexible sensor market size for biosensors is forecast to outgrow legacy segments as polymer substrates coupled with nano-engineered inks deliver clinically relevant sensitivity without sacrificing wearer comfort. Intensifying R&D in enzyme-functionalized electrodes and self-healing conductors will likely sustain the segment's outperformance against conventional pressure and temperature counterparts.
Screen printing retained 35.55% revenue in 2025 thanks to its thick-film capability and low-unit cost, but inkjet printing's anticipated 8.78% CAGR underscores industry migration toward higher pattern resolution and multi-material flexibility. As line widths approach the sub-20 µm threshold, inkjet platforms enable dense routing on limited real-estate, thereby advancing miniaturization roadmaps within the printed flexible sensor market. Emergent aerosol-jet and 3D printing modalities further extend the design envelope by depositing conductive pastes on non-planar geometries, a requirement for conformal avionics and medical implants.
Gravure and flexographic lines remain staples for million-unit consumer-electronics volumes, yet inkjet's digital nature curtails changeover time, permitting mass-customization of sensor layouts. Capillary-flow printing of submicron CNT transistors demonstrated by academic groups showcases feature parity with photolithography, marking a decisive competitive inflection. The printed flexible sensor market size tied to inkjet systems is projected to accelerate as ink suppliers commercialize oxide-free copper nanofluids that sinter via photonic flashes, achieving bulk-silver conductivities without the precious-metal price drag.
The Printed Flexible Sensor Market Report is Segmented by Sensor Type (Biosensors, Touch Sensors, Photodetectors, and More), Printing Technology (Screen Printing, Inkjet Printing, Gravure Printing, Fand More), Substrate Material (Polyimide, PET, PEN, Paper and More), End-User Industry (Consumer Electronics, Medical and Healthcare, and More), and by Geography. The Market Forecasts are Provided in Terms of Value (USD).
Geography Analysis
Asia-Pacific held 46.35% printed flexible sensor market share in 2025 and is anticipated to grow at 8.71% CAGR to 2031. China leads capacity additions, with BOE projected to surpass Samsung Display in flexible OLED throughput by 2028, a development that secures upstream material demand and localizes printed sensor supply chains. Japan's precision-manufacturing heritage and South Korea's material-science depth add regional resilience, while Southeast Asian economies provide cost-efficient assembly for high-volume consumer electronics.
North America ranks second by revenue. Federal incentives such as the USD 1.6 billion advanced packaging program and the USD 179 million DOE microelectronics centers stimulate domestic printed flexible sensor industry capability. Defense budgets catalyze early adoption of conformal avionics sensors, and the robust medical-device ecosystem accelerates biosensor commercialization.
Europe leverages automotive leadership and stringent eco-design mandates to shape global specifications for recyclable sensors. The Reform Project's initiative to forge a regional functional electronics supply chain reduces reliance on Asian imports and channels R&D funding toward sustainable substrate technologies. Latin America and the Middle East & Africa currently command small shares, yet industrial modernization and telecom infrastructure upgrades signal latent demand, particularly in smart-grid and building-automation sensing.
- Canatu Oy
- Brewer Science
- ISORG
- E2IP Technologies
- Quad Industries
- Pressure Profile Systems Inc.
- Butler Technologies Inc.
- Tekscan Inc.
- PST Sensors
- PolyIC GmbH and Co. KG
- Memtronik
- Linepro Controls Pvt. Ltd.
- Forciot
- Nissha Co. Ltd.
- TactoTek
- Interlink Electronics
- FlexEnable
- Heraeus Nexensos
- Molex
- 3M
Additional Benefits:
- The market estimate (ME) sheet in Excel format
- 3 months of analyst support
TABLE OF CONTENTS
1 INTRODUCTION
- 1.1 Study Assumptions and Market Definition
- 1.2 Scope of the Study
2 RESEARCH METHODOLOGY
3 EXECUTIVE SUMMARY
4 MARKET LANDSCAPE
- 4.1 Market Overview
- 4.2 Market Drivers
- 4.2.1 Rising demand for energy-efficient, ultra-thin consumer electronics
- 4.2.2 Increasing adoption in medical wearables and biosensing
- 4.2.3 Automotive in-cabin HMI and battery monitoring integration
- 4.2.4 Defense R&D for conformal avionics and structural health monitoring
- 4.2.5 Roll-to-roll additive manufacturing cutting CapEx >40 %
- 4.2.6 EU eco-design policies favouring recyclable printed sensors
- 4.3 Market Restraints
- 4.3.1 Accuracy and stability gap vs. silicon sensors
- 4.3.2 Lack of fabrication standardisation
- 4.3.3 Volatile supply of silver nanoparticle inks
- 4.3.4 Limited reliability data for high-temperature use-cases
- 4.4 Value / Supply-Chain Analysis
- 4.5 Regulatory Landscape
- 4.6 Technological Outlook
- 4.7 Porter's Five Forces
- 4.7.1 Threat of New Entrants
- 4.7.2 Bargaining Power of Buyers
- 4.7.3 Bargaining Power of Suppliers
- 4.7.4 Threat of Substitutes
- 4.7.5 Intensity of Competitive Rivalry
5 MARKET SIZE AND GROWTH FORECASTS
- 5.1 By Sensor Type
- 5.1.1 Biosensors
- 5.1.2 Touch Sensors
- 5.1.3 Photodetectors
- 5.1.4 Temperature Sensors
- 5.1.5 Pressure Sensors
- 5.1.6 Gas Sensors
- 5.1.7 Strain and Force Sensors
- 5.2 By Printing Technology
- 5.2.1 Screen Printing
- 5.2.2 Inkjet Printing
- 5.2.3 Gravure Printing
- 5.2.4 Flexographic Printing
- 5.2.5 3D / Aerosol-Jet Printing
- 5.3 By Substrate Material
- 5.3.1 Polyimide (PI)
- 5.3.2 PET
- 5.3.3 PEN
- 5.3.4 Paper and Cellulose
- 5.3.5 Others (Glass, Metal Foils)
- 5.4 By End-user Industry
- 5.4.1 Consumer Electronics
- 5.4.2 Medical and Healthcare
- 5.4.3 Automotive
- 5.4.4 Industrial and Manufacturing
- 5.4.5 Aerospace and Defense
- 5.4.6 Others (Smart Packaging, Building Automation)
- 5.5 By Geography
- 5.5.1 North America
- 5.5.1.1 United States
- 5.5.1.2 Canada
- 5.5.1.3 Mexico
- 5.5.2 South America
- 5.5.2.1 Brazil
- 5.5.2.2 Argentina
- 5.5.2.3 Rest of South America
- 5.5.3 Europe
- 5.5.3.1 Germany
- 5.5.3.2 France
- 5.5.3.3 United Kingdom
- 5.5.3.4 Italy
- 5.5.3.5 Spain
- 5.5.3.6 Russia
- 5.5.3.7 Rest of Europe
- 5.5.4 Asia Pacific
- 5.5.4.1 China
- 5.5.4.2 Japan
- 5.5.4.3 South Korea
- 5.5.4.4 India
- 5.5.4.5 Australia and New Zealand
- 5.5.4.6 Southeast Asia
- 5.5.4.7 Rest of Asia Pacific
- 5.5.5 Middle East and Africa
- 5.5.5.1 Middle East
- 5.5.5.1.1 Saudi Arabia
- 5.5.5.1.2 UAE
- 5.5.5.1.3 Turkey
- 5.5.5.1.4 Rest of Middle East
- 5.5.5.2 Africa
- 5.5.5.2.1 South Africa
- 5.5.5.2.2 Nigeria
- 5.5.5.2.3 Rest of Africa
- 5.5.5.1 Middle East
- 5.5.1 North America
6 COMPETITIVE LANDSCAPE
- 6.1 Market Concentration
- 6.2 Strategic Moves
- 6.3 Market Share Analysis
- 6.4 Company Profiles (includes Global level Overview, Market level overview, Core Segments, Financials as available, Strategic Information, Market Rank/Share for key companies, Products and Services, and Recent Developments)
- 6.4.1 Canatu Oy
- 6.4.2 Brewer Science
- 6.4.3 ISORG
- 6.4.4 E2IP Technologies
- 6.4.5 Quad Industries
- 6.4.6 Pressure Profile Systems Inc.
- 6.4.7 Butler Technologies Inc.
- 6.4.8 Tekscan Inc.
- 6.4.9 PST Sensors
- 6.4.10 PolyIC GmbH and Co. KG
- 6.4.11 Memtronik
- 6.4.12 Linepro Controls Pvt. Ltd.
- 6.4.13 Forciot
- 6.4.14 Nissha Co. Ltd.
- 6.4.15 TactoTek
- 6.4.16 Interlink Electronics
- 6.4.17 FlexEnable
- 6.4.18 Heraeus Nexensos
- 6.4.19 Molex
- 6.4.20 3M
7 MARKET OPPORTUNITIES AND FUTURE OUTLOOK
- 7.1 White-space and Unmet-need Assessment
 印刷柔性感测器市场:按感测器类型、技术、材料类型、终端用户产业和应用划分-2026-2032年全球市场预测
 印刷感测器市场规模、份额、趋势和预测:按类型、印刷技术、应用和地区划分,2026-2034年
 印刷柔性感测器市场分析及预测(至2035年):按类型、产品、技术、组件、应用、材料类型、装置、最终用户和功能划分
 印刷感测器市场规模、份额和成长分析(按类型、印刷技术、应用和地区划分)—产业预测(2026-2033 年)
 全球印刷和嵌入式感测器电子市场:预测至 2032 年—按组件、感测器、印刷、製造流程、应用、最终用户和地区进行分析
 印刷感测器:市场份额分析、行业趋势、统计数据和成长预测(2025-2030)
 柔性微奈米感测器市场报告:2031 年趋势、预测与竞争分析印刷感测器市场报告:2031 年趋势、预测与竞争分析