


 |
市场调查报告书
商品编码
1910879
矿物加工设备:市场占有率分析、产业趋势与统计、成长预测(2026-2031)Mineral Processing Equipment - Market Share Analysis, Industry Trends & Statistics, Growth Forecasts (2026 - 2031) |
||||||
※ 本网页内容可能与最新版本有所差异。详细情况请与我们联繫。
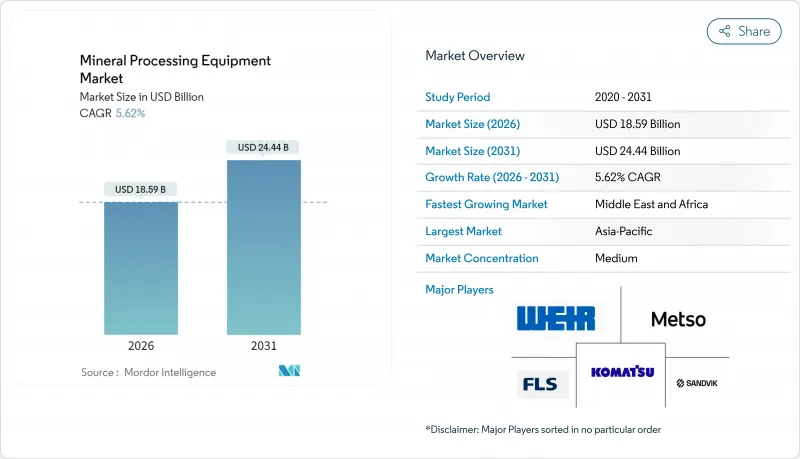
2025年矿物加工设备市场价值为176.1亿美元,预计从2026年的185.9亿美元成长到2031年的244.4亿美元,在预测期(2026-2031年)内复合年增长率为5.62%。
矿石品位持续下降、能源转换金属需求激增以及环境标准日益严格,共同推动了以高产能、数位化工厂为重点的多年投资週期。锂、镍和稀土元素需求的成长,带动了精细粉碎、精密分离和先进除尘系统设备的订单增加。生产商优先考虑降低每吨成本和范围1排放,并采用高压辊磨机(HPGR)和柱式浮选等技术。随着偏远矿场业者寻求有保障的运作和预测性维护,售后服务正变得越来越重要。供应链民族主义推动了北美、欧洲和亚洲对国内加工能力扩张的迫切需求,进一步扩大了矿物加工设备市场的机会。
全球矿物加工设备市场趋势及展望
电动车和电池(锂电池、镍电池)的金属需求激增
电池级材料需求的激增正推动矿物加工设备市场发生重大变革。锂矿计划需要能够达到99.5%或更高纯度的专用焙烧、浸出和结晶迴路,这带动了美卓pCAM和煅烧炉成套设备的新订单。镍红土矿加工同样使大型高压釜、硫酸浸出反应器和下游溶剂萃取装置受益。拥有成熟高温高压设计的原始设备製造商(OEM)正保持着高利润率,因为投资者正在澳洲、印尼和智利快速推进电池金属一体化产业中心的建设。由此带来的产能扩张支撑着两位数的设备需求成长,即使在大宗商品支出低迷的时期也是如此。供应商也正在整合ESG报告模组,以追溯每吨电池金属的生产排放。
转向高等级矿石需要更高产能的破碎机
铜、金和铁矿石物品位持续下降,迫使选矿厂处理更多矿石以维持金属产量。高压辊磨机 (HPGR) 可节能 20-40%,并能获得更细的产品粒径分布,进而提高下游浮选回收率。韦尔集团在澳洲和智利矿场安装的 ENDURON 系统便证明了这一点。在这些矿场中,矿场对一台额定产能为每小时 2 万吨的初级破碎机进行了改造,并配备了配套的即时粒度分析仪,从而形成完整的控制迴路。这种连锁反应推动了对能够处理高矿浆量的筛分机、旋流器和脱水设备的需求。提供从破碎到分级一体化解决方案的供应商正在获得更多业务收益,并日益专注于矿物加工设备市场中的高通量、低能耗解决方案。
在新矿开发中,以ESG主导的资本配置至关重要
随着机构投资人采用更严格的ESG(环境、社会和治理)筛选标准,新矿场的审批流程被推迟,相关设备的订单也随之减少。在加拿大待开发区的铁矿石和铜矿计划中,碳中和製程设计如今已成为一项先决条件,这使得安装成本增加了高达20%。审批週期的延长降低了破碎机和磨机的短期需求,而除尘和水循环系统改造的订单却在增加。原始设备製造商(OEM)正在透过模组化、便携式设备来应对这项挑战,这些设备能够最大限度地减少土地扰动并缩短环境审查时间,从而在矿物加工设备市场维持着小规模批量、快速采购订单的稳定供应。
细分市场分析
锂在2031年前高达13.58%的复合年增长率凸显了矿物加工设备市场的结构性变化。儘管到2025年,被归类为「其他」的大宗商品仍占矿物加工设备市场规模的89.55%,但电池金属工厂对煅烧窑、溶剂萃取混合器和结晶器等设备的要求极高,且杂质含量阈值极低。随着汽车製造商寻求安全且可追溯的供应链,矿物加工设备市场正吸引投资者的注意。虽然传统的铁矿石和铜的流通量仍然可观,但它们个位数的成长率与关键矿物加工领域两位数的成长形成了鲜明对比。
随着铜金矿石品位持续下降,研磨(HPGR)、粉碎机和闪速浮选设备的资本投资週期不断延长。稀土元素处理量虽低,但其生产迴路需要复杂的多层分离,导致单位成本高昂,进而影响利润率。因此,供应商正将研发重点放在湿式冶金和选择性浸出技术上,以平衡其对传统大宗商品和高成长特种矿产领域的依赖。
截至2025年,破碎机和磨粉机在矿物加工设备市场规模中占据最大份额,达32.72%;而先进浮选槽预计到2031年将以5.88%的复合年增长率快速增长。加工复杂铅锌镍矿的工厂采用自动化气流和棉絮摄影系统来维持矿石品位。整合式撬装浮选模组可将交付週期缩短至六个月,使其适用于快速推进的锂矿计划。
下游的高速浓缩机和膏体填充设备可有效应对尾矿坝的风险,而配备磨损性能感测器的智慧泥浆泵则可延长检修週期。因此,矿物加工设备的市场份额正逐渐向分离和尾矿处理方向转变,这反映出水资源管理和价值回收的重要性日益凸显。
区域分析
亚太地区仍将是矿物加工设备市场的核心,预计2025年将占全球销售额的67.92%。中国庞大的冶炼和精炼基地正以前所未有的规模吸收破碎机、磨机和过滤设备。澳洲的铁矿石巨头已承诺新增超过7亿吨的年产能,并持续升级其高压格栅分离设备。同时,印尼的镍红土矿计划已明确了高压釜和酸厂的配套设施。印度针对关键矿产的生产关联激励(PLI)计划以及对矿业法的修订将鼓励新的锂石墨矿开发,以满足2025年至2030年间不断增长的设备需求。
中东和非洲地区将达到最高成长率,到2031年复合年增长率将达到9.82%。沙乌地阿拉伯、纳米比亚和安哥拉正投入国家资本,以实现其磷酸盐、铜和稀土元素资源的商业化。太阳能海水淡化厂将为耗水量大的浓缩厂提供原料,进而降低单位营运成本。位于马阿登的大型磷酸盐综合体是矿山到化肥一体化流程的典范,并已获得泵浦、浓缩机和迴转干燥机的维修服务合约。在德班、Muscat和特马设立的区域维修基地减少了物流延误,有利于投资本地技术人员的原始设备製造商(OEM)。北美和欧洲的成长率维持在个位数,主要得益于供应链安全政策。美国联邦政府的津贴正在促进国内氢氧化锂精炼厂的早期运作,使煅烧炉和结晶器的专业製造商受益。欧盟《关键材料法》对稀土元素分离和电池回收提供补贴,提振了柱式浮选和湿式冶金设备的订单。南美洲的锂三角产业保持成长势头,安第斯山脉高地的水资源限制促使直接锂提取(DLE)模组的普及,这种模组消耗的盐水更少。地缘政治、环境、社会和治理(ESG)要求以及资源民族主义正在交织融合,重塑区域设备采购格局,从而支撑矿物加工设备市场的全面成长。
其他福利:
- Excel格式的市场预测(ME)表
- 3个月的分析师支持
目录
第一章 引言
- 研究假设和市场定义
- 调查范围
第二章调查方法
第三章执行摘要
第四章 市场情势
- 市场概览
- 市场驱动因素
- 电动车电池金属热潮(锂、镍)
- 转向开采高等级矿石推动了对更高产能破碎机的需求。
- 非洲关键矿产计划资本投资激增
- 引进数位双胞胎技术实现全厂优化
- 绿色钢铁倡议增加了对球团矿的需求
- 利用人工智慧进行矿石分选,降低下游製程的能耗。
- 市场限制
- ESG主导的待开发区资本配置
- 加强粒状物排放标准
- 偏远地区熟练劳动力短缺
- 关键零件的地缘政治供应链民族主义
- 价值/供应链分析
- 监管环境
- 技术展望
- 波特五力模型
- 新进入者的威胁
- 买方和消费者的议价能力
- 供应商的议价能力
- 替代品的威胁
- 竞争对手之间的竞争
第五章 市场规模及成长预测(价值(美元))
- 矿产开采业
- 矾土
- 铜
- 铁
- 锂
- 镍
- 稀土元素
- 黄金和贵金属
- 其他的
- 透过装置
- 破碎机和研磨设备
- 筛网和分离器
- 给料机和输送机
- 钻头和破碎机
- 增稠和澄清
- 浮选槽
- 磁选机和重力选机
- 泵浦和阀门
- 过滤和脱水
- 透过製造工艺
- 破碎和研磨
- 排序和分类
- 浓缩(浮选/分离)
- 脱水治疗
- 物料输送
- 按最终用户行业划分
- 矿产和矿石开采公司
- 合约加工厂
- 回收金属和再生金属
- 骨材和建筑材料
- 地区
- 北美洲
- 美国
- 加拿大
- 北美其他地区
- 南美洲
- 巴西
- 智利
- 南美洲其他地区
- 欧洲
- 德国
- 英国
- 法国
- 义大利
- 其他欧洲地区
- 亚太地区
- 中国
- 印度
- 澳洲
- 日本
- 韩国
- 亚太其他地区
- 中东和非洲
- 阿拉伯聯合大公国
- 沙乌地阿拉伯
- 土耳其
- 埃及
- 南非
- 其他中东和非洲地区
- 北美洲
第六章 竞争情势
- 市场集中度
- 策略趋势
- 市占率分析
- 公司简介
- FLSmidth A/S
- Metso Corporation
- Komatsu Ltd.
- Sandvik AB
- The Weir Group PLC
- ThyssenKrupp AG
- TAKRAF GmbH
- CITIC Heavy Industries Co., Ltd.
- Terex Corporation
- Wirtgen GmbH
- Multotec(Pty)Ltd
- FEECO International, Inc.
- McLanahan Corporation
- Tenova SpA
- Haver & Boecker Niagara GmbH
- Derrick Corporation
- Eriez Manufacturing Co.
- Astec Industries, Inc.
- Sotecma SL
第七章 市场机会与未来展望
The Mineral Processing Equipment market was valued at USD 17.61 billion in 2025 and estimated to grow from USD 18.59 billion in 2026 to reach USD 24.44 billion by 2031, at a CAGR of 5.62% during the forecast period (2026-2031).
Continuous ore-grade decline, the energy-transition metals boom, and tightening environmental standards reinforce multi-year investment cycles favoring higher-capacity, digitally enabled plants. Growing demand for lithium, nickel, and rare earth elements pushes equipment orders toward finer-grinding, precision-separation, and advanced dust-control systems. Producers prioritize energy efficiency to reduce cost per tonne and Scope 1 emissions, elevating technologies such as high-pressure grinding rolls (HPGRs) and column flotation. Aftermarket services gain strategic importance as remote mine operators seek guaranteed uptime and predictive maintenance. Supply-chain nationalism adds urgency to domestic processing capacity in North America, Europe, and Asia, further broadening the mineral processing equipment market opportunity.
Global Mineral Processing Equipment Market Trends and Insights
EV-Battery Metal Boom (Lithium, Nickel)
Soaring demand for battery-grade inputs drives a pronounced shift in the Mineral Processing Equipment market. Lithium projects require specialized roasting, leaching, and crystallization circuits able to deliver 99.5%+ purity levels, prompting new orders for Metso's pCAM and calciner packages. Nickel laterite processing equally benefits larger autoclaves, sulfuric-acid leach reactors, and downstream solvent-extraction units. OEMs with high-temperature, high-pressure design credentials command premium margins as investors fast-track integrated battery-metal hubs in Australia, Indonesia, and Chile. The resulting capacity build-out sustains double-digit equipment demand even when bulk-commodity spending moderates. Suppliers also integrate ESG reporting modules that trace cradle-to-gate emissions for each tonne of battery metal.
Shift to Finer-Grade Ores Driving High-Capacity Crushers
Copper, gold, and iron ore head grades continue to fall, obliging plants to process larger tonnages to maintain metal output. HPGR circuits yield 20-40% energy savings and finer product size distributions that elevate downstream flotation recovery, as demonstrated by Weir Group's ENDURON installs Mines in Australia and Chile retrofit primary crushers with 20,000 t/h nameplate capacities, complemented by real-time particle-size analyzers that close the control loop. This cascading effect lifts demand for screens, cyclones, and dewatering equipment sized for higher slurry volumes. Suppliers that provide integrated comminution-to-classification packages capture added service revenue, reinforcing the Mineral Processing Equipment market's focus on high-throughput, low-specific-energy solutions.
ESG-Driven Capital Rationing for Green-Field Mines
Institutional investors apply stringent ESG filters, slowing approvals for new mines and delaying linked plant orders. Greenfield iron ore and copper projects in Canada now require upfront carbon-neutral processing designs, adding up to 20% to installed costs. Extended permitting cycles compress near-term demand for crushers and mills, even as retrofit orders for dust-suppression and water-recycling systems rise. OEMs respond with modular, relocatable plants that minimize land disturbance and shorten environmental reviews, preserving a pipeline of smaller, faster-moving purchase orders within the Mineral Processing Equipment market.
Other drivers and restraints analyzed in the detailed report include:
- CAPEX Surge in African Critical-Mineral Projects
- Digital-Twin Adoption for Plant-Wide Optimization
- Tightening Particulate-Matter Emission Norms
For complete list of drivers and restraints, kindly check the Table Of Contents.
Segment Analysis
Lithium's meteoric 13.58% CAGR through 2031 underscores structural change inside the mineral processing equipment market. Although bulk commodities under the "Others" banner still generated 89.55% of the mineral processing equipment market size in 2025, battery-metal plants are specifying calcination kilns, solvent-extraction mixers, and crystallizers built for ultra-low impurity thresholds. The Mineral Processing Equipment market captures investor enthusiasm as automakers seek secure, traceable supply chains. Traditional iron-ore and copper flows maintain large volumes; however, their single-digit growth contrasts sharply with double-digit expansion in critical mineral circuits.
Continued head-grade decline in copper and gold extends capex cycles for HPGR, fine-grinding, and flash-flotation gear. Though small in tonnage, rare-earth element circuits demand complex multi-stage separation that commands high unit pricing, lifting margin contribution. Suppliers thus allocate R&D toward hydrometallurgy and selective leaching, balancing legacy bulk-commodity exposure with high-growth specialty segments.
Crushers and mills represented the largest 32.72% slice of the mineral processing equipment market size in 2025, yet advanced flotation cells booked the quickest 5.88% CAGR through 2031. Plants processing complex lead-zinc or nickel ores adopt automated air-flow and froth-camera systems to sustain grade. Integrated skid-mounted flotation modules shorten delivery to six months, suiting fast-track lithium projects.
Downstream, high-rate thickeners and paste-fill plants address tailings dam risk, while smart slurry pumps with wear-performance sensors extend the mean time between overhauls. Therefore, the Mineral Processing Equipment market share mix tilts gradually toward separation and tailings handling, reflecting heightened water stewardship and value-recovery priorities.
The Mineral Processing Equipment Market Report is Segmented by Mineral Mining Sector (Bauxite, Copper, Iron, Lithium, Nickel, Rare-Earth Elements, Gold and Precious Metals, Others), Equipment (Crushers and Mills, Screens and Separators, and More), Processing Stage (Crushing and Grinding, and More), End-User Industry (Mineral/Ore Mining Companies, and More), and Geography. The Market Forecasts are Provided in Terms of Value (USD).
Geography Analysis
Asia-Pacific, with 67.92% of 2025 turnover, remains the nucleus of the mineral processing equipment market. China's vast smelting and refining backbone absorbs crushers, mills, and filtration packages on an unparalleled scale. Australian iron-ore majors commit to 700+ Mt/y capacity, sustaining HPGR and screening upgrades, while Indonesian nickel laterite projects specify autoclaves and acid-plant tie-ins. India's Production-Linked Incentive scheme for critical minerals and mining code reforms stimulates greenfield lithium and graphite developments that underpin incremental equipment demand in 2025-2030.
The Middle East and Africa deliver the fastest 9.82% CAGR through 2031, as Saudi Arabia, Namibia, and Angola deploy sovereign capital to monetize phosphate, copper, and rare-earth resources. Solar-powered desalination plants feed water-intensive concentrators, cutting unit opex. Ma'aden's mega-phosphate complex exemplifies integrated mine-to-fertilizer flows, capturing service contracts for pumps, thickeners, and rotary dryers. Localized maintenance hubs in Durban, Muscat, and Tema mitigate logistics delays, favoring OEMs that invest in on-ground technicians. North America and Europe record mid-single-digit growth rates anchored by supply-chain security agendas. United States federal grants fast-track domestic lithium-hydroxide refineries, benefitting calciner and crystallizer specialists. The EU's Critical Raw Materials Act subsidizes rare-earth separation and battery recycling, boosting column-flotation and hydromet plant orders. South America's lithium triangle retains momentum, although water-use restrictions in the high Andes propel the adoption of direct-lithium-extraction (DLE) modules that consume less brine. Geopolitics, ESG imperatives, and resource nationalism jointly reshape regional equipment procurement patterns, sustaining broad-based Mineral Processing Equipment market growth.
- FLSmidth A/S
- Metso Corporation
- Komatsu Ltd.
- Sandvik AB
- The Weir Group PLC
- ThyssenKrupp AG
- TAKRAF GmbH
- CITIC Heavy Industries Co., Ltd.
- Terex Corporation
- Wirtgen GmbH
- Multotec (Pty) Ltd
- FEECO International, Inc.
- McLanahan Corporation
- Tenova S.p.A.
- Haver & Boecker Niagara GmbH
- Derrick Corporation
- Eriez Manufacturing Co.
- Astec Industries, Inc.
- Sotecma S.L.
Additional Benefits:
- The market estimate (ME) sheet in Excel format
- 3 months of analyst support
TABLE OF CONTENTS
1 Introduction
- 1.1 Study Assumptions and Market Definition
- 1.2 Scope of the Study
2 Research Methodology
3 Executive Summary
4 Market Landscape
- 4.1 Market Overview
- 4.2 Market Drivers
- 4.2.1 EV-Battery Metal Boom (Lithium, Nickel)
- 4.2.2 Shift To Finer-Grade Ores Driving High-Capacity Crushers
- 4.2.3 CAPEX Surge in African Critical-Mineral Projects
- 4.2.4 Digital-Twin Adoption for Plant-Wide Optimization
- 4.2.5 Green-Steel Initiatives Increasing Pelletizing Demand
- 4.2.6 AI-Based Ore-Sorting Reducing Downstream Energy Use
- 4.3 Market Restraints
- 4.3.1 ESG-Driven Capital Rationing for Green-Field Mines
- 4.3.2 Tightening Particulate-Matter Emission Norms
- 4.3.3 Skilled-Workforce Shortages in Remote Regions
- 4.3.4 Geopolitical Supply-Chain Nationalism on Key Spares
- 4.4 Value / Supply-Chain Analysis
- 4.5 Regulatory Landscape
- 4.6 Technological Outlook
- 4.7 Porter's Five Forces
- 4.7.1 Threat of New Entrants
- 4.7.2 Bargaining Power of Buyers/Consumers
- 4.7.3 Bargaining Power of Suppliers
- 4.7.4 Threat of Substitute Products
- 4.7.5 Intensity of Competitive Rivalry
5 Market Size and Growth Forecasts (Value (USD))
- 5.1 By Mineral Mining Sector
- 5.1.1 Bauxite
- 5.1.2 Copper
- 5.1.3 Iron
- 5.1.4 Lithium
- 5.1.5 Nickel
- 5.1.6 Rare-earth Elements
- 5.1.7 Gold and Precious Metals
- 5.1.8 Others
- 5.2 By Equipment
- 5.2.1 Crushers and Mills
- 5.2.2 Screens and Separators
- 5.2.3 Feeders and Conveyors
- 5.2.4 Drills and Breakers
- 5.2.5 Thickening and Clarification
- 5.2.6 Flotation Cells
- 5.2.7 Magnetic and Gravity Separators
- 5.2.8 Pumps and Valves
- 5.2.9 Filtration and Dewatering
- 5.3 By Processing Stage
- 5.3.1 Crushing and Grinding
- 5.3.2 Screening and Sorting
- 5.3.3 Concentration (Flotation/Separation)
- 5.3.4 Dewatering
- 5.3.5 Material Handling
- 5.4 By End-User Industry
- 5.4.1 Mineral/Ore Mining Companies
- 5.4.2 Contract Processing Plants
- 5.4.3 Recycling and Secondary Metals
- 5.4.4 Aggregates and Construction
- 5.5 Geography
- 5.5.1 North America
- 5.5.1.1 United States
- 5.5.1.2 Canada
- 5.5.1.3 Rest of North America
- 5.5.2 South America
- 5.5.2.1 Brazil
- 5.5.2.2 Chile
- 5.5.2.3 Rest of South America
- 5.5.3 Europe
- 5.5.3.1 Germany
- 5.5.3.2 United Kingdom
- 5.5.3.3 France
- 5.5.3.4 Italy
- 5.5.3.5 Rest of Europe
- 5.5.4 Asia-Pacific
- 5.5.4.1 China
- 5.5.4.2 India
- 5.5.4.3 Australia
- 5.5.4.4 Japan
- 5.5.4.5 South Korea
- 5.5.4.6 Rest of Asia-Pacific
- 5.5.5 Middle East and Africa
- 5.5.5.1 United Arab Emirates
- 5.5.5.2 Saudi Arabia
- 5.5.5.3 Turkey
- 5.5.5.4 Egypt
- 5.5.5.5 South Africa
- 5.5.5.6 Rest of Middle East and Africa
- 5.5.1 North America
6 Competitive Landscape
- 6.1 Market Concentration
- 6.2 Strategic Moves
- 6.3 Market Share Analysis
- 6.4 Company Profiles (Includes Global level Overview, Market level overview, Core Segments, Financials as available, Strategic Information, Market Rank/Share for key companies, Products and Services, and Recent Developments)
- 6.4.1 FLSmidth A/S
- 6.4.2 Metso Corporation
- 6.4.3 Komatsu Ltd.
- 6.4.4 Sandvik AB
- 6.4.5 The Weir Group PLC
- 6.4.6 ThyssenKrupp AG
- 6.4.7 TAKRAF GmbH
- 6.4.8 CITIC Heavy Industries Co., Ltd.
- 6.4.9 Terex Corporation
- 6.4.10 Wirtgen GmbH
- 6.4.11 Multotec (Pty) Ltd
- 6.4.12 FEECO International, Inc.
- 6.4.13 McLanahan Corporation
- 6.4.14 Tenova S.p.A.
- 6.4.15 Haver & Boecker Niagara GmbH
- 6.4.16 Derrick Corporation
- 6.4.17 Eriez Manufacturing Co.
- 6.4.18 Astec Industries, Inc.
- 6.4.19 Sotecma S.L.
7 Market Opportunities and Future Outlook
 2026年全球矿物破碎、分选和加工设备市场报告
 2026-2030年全球矿物加工设备市场
 矿物加工设备市场规模、份额及成长分析(按设备类型、矿物开采产业及地区划分)-2026-2033年产业预测
 矿业物料输送设备市场规模、份额和趋势分析报告:按采矿方法、产品、地区和细分市场预测(2025-2033 年)
 骨材、采矿和矿物加工设备市场机会、成长动力、产业趋势分析及 2025 - 2034 年预测
 2025-2033 年按类型、移动性、应用和地区分類的破碎、筛选和选矿设备市场报告
 ASIC矿机全球市场(2024-2028)
 全球选矿设备市场