


 |
市场调查报告书
商品编码
1911312
包装:市场占有率分析、产业趋势与统计、成长预测(2026-2031)Packaging - Market Share Analysis, Industry Trends & Statistics, Growth Forecasts (2026 - 2031) |
||||||
※ 本网页内容可能与最新版本有所差异。详细情况请与我们联繫。
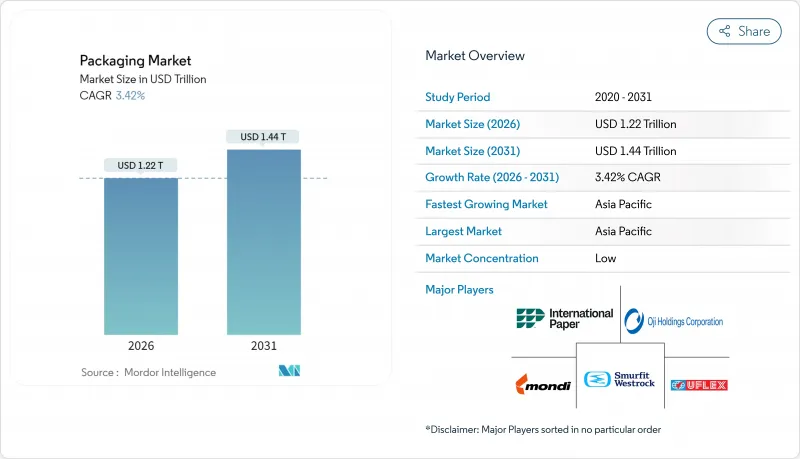
全球包装市场预计到 2026 年价值 12203.6 亿美元,高于 2025 年的 11800 亿美元,预计到 2031 年将达到 14439 亿美元。
预计从 2026 年到 2031 年,其复合年增长率将达到 3.42%。
这一稳步扩张标誌着全球包装市场持续成熟,并吸收了与循环经济指令相关的监管成本,同时消费者期望也发生了变化,他们更加重视永续性而非单纯的成本绩效。随着包装在食品、饮料、医药和电商通路中发挥不可替代的保护、品牌建立和合规功能,市场需求也变得更加强劲。亚太地区透过大规模生产保持较低的资本密集度,而已开发地区则在投资先进的回收技术、单一材料薄膜和数位印刷技术,从而实现近乎即时的产品发布。同时,电商小包裹的兴起、一次性塑胶製品的监管禁令以及企业永续性目标的推进,正推动资金流入轻量材料、生物基成分和按需客製化平台。寻求差异化的品牌正越来越多地采用数位标识符,以帮助实现可追溯性、提升消费者参与度,并遵守不断发展的生产者延伸责任制(EPR)机制。
全球包装市场趋势与洞察
与永续性相关的采购承诺推动材料创新
如今,企业政策明确规定了最低再生材料含量和可回收性认证,加速了对分子回收工厂和生物基树脂的投资。雅诗兰黛计画在2024年实现71%的「5R」包装框架合规率,这显示高端品牌如何将永续性收益。采购部门正在将碳可回收性指标纳入供应商评分卡,此举与针对难回收包装的计划性生产者责任延伸(EPR)费用相一致。诸如塑胶塑胶回收再利用协会(APR)的「可回收设计指南」等认证项目,为缩短开发週期提供了技术蓝图。因此,树脂供应商正在扩大解聚设备,将PET和聚酰胺还原为原生级原料,使加工商能够在不影响产品保质期的前提下达到再生材料含量目标。投资者正在奖励那些将经营团队奖金与减少包装环境影响挂钩的公司,这进一步推动了永续材料的製度化应用。
电子商务小包裹量的快速成长正在改变防护包装。
都市区履约中心每天处理数十亿件单品订单,其处理步骤比传统门市配送更多,因此对防损的需求也随之增加。亚马逊利用人工智慧驱动的包装线优化,减少了95%的塑胶空气枕,取而代之的是纸质缓衝材料,既能保持产品完整性,又能提高路边回收率。自动化尺寸调整机可依每笔订单客製化纸板坯料,减少高达30%的材料用量,同时大幅降低体积重量费用。这些配送方式的转变推动了对轻便柔性邮件包装的需求,这些包装带有整合式撕条和回封条。数位印刷机可印刷小批量图案,在包裹打开时强化品牌故事。因此,能够将数据分析与加工设备相结合的加工商正在抢占不断增长的电商市场份额。同时,传统的大批量出货商也在对其工厂进行改造,采用新的成型和密封技术。
原油价格波动会影响树脂预算
聚乙烯、聚丙烯和PET的价格与布兰特原油价格密切相关,导致季度合约加工商的利润率波动难以预测。 2024年油价每桶上涨10美元,导致树脂附加费在短短四周内出现两位数增长,令没有对冲手段的小规模挤出生产商雪上加霜。品牌所有者要求签订固定价格合同,并将成本风险转移到下游,迫使加工商加快使用价格走势不同的再生材料。柴油价格上涨也推高了运输和化工原料成本,进而推高了板材价格。这种波动导致资金流向区域树脂供应商,缩短了供应链。然而,食品级应用所需的高纯度rPET颗粒仍供给能力。
细分市场分析
到2025年,塑胶包装将凭藉其多功能性、快速密封性和成本效益,继续占据全球包装市场41.55%的份额。然而,随着监管机构和品牌章程优先考虑可再生纤维而非石油基材,预计到2031年,纸质包装的复合年增长率将达到4.47%,超过全球整体包装市场的成长速度。全球纸质包装市场正稳步扩张,这主要得益于阻隔涂布技术的进步,该技术能够承受从冷冻库到微波炉的循环使用。瓦楞纸板加工商正在投资数位单一途径印刷机,以实现可直接上架的印刷效果,使零售商无需额外的展示托盘。在速食业,材料替代正在加速进行,例如,发泡聚苯乙烯正被纤维碗所取代;在糖果甜点多包装中,定向聚丙烯正被可再生涂层纸所取代。
在硬质塑胶领域,可机械回收的单一材料PET罐和HDPE瓶的创新持续推动市场成长,并在酱料、乳製品和家居用品领域保持市场份额。柔软性塑胶薄膜因其轻巧和防篡改密封性能,受益于电子商务的成长。同时,由于航太和汽车产业的需求与包装需求竞争,金属罐的价值链面临瓶颈,导致成本压力不断增加。玻璃在高端饮料领域仍占有一席之地,但能源价格飙升正在推动轻量化发展。在纺织品领域,高性能衬纸板生产的扩张推动了持续成长,成为漂白聚乙烯涂层纸盒的替代品,并在全球包装市场创造了新的价值机会。
区域分析
亚太地区39.72%的市占率反映了其无与伦比的製造业集中度,以及随着可支配收入的增长,包装食品、饮料和个人保健产品的消费量不断增加。中国在软包装挤出产能方面主导,而印度的泡壳包装产量则满足了不断增长的医药需求以及对非洲的出口。日本和韩国等成熟市场正透过高精度加工技术、抗菌涂层和数位装饰等方式提升产品附加价值。印尼和越南正在扩大瓦楞纸板厂,以满足其电子产品出口基地的需求,从而推动了对纸板的强劲需求。
欧洲在生态设计领域保持主导,透过《包装废弃物法规》(PPWR) 的强制性规定,推广减少材料使用和可回收的解决方案。德国的闭合迴路PET回收系统实现了近98%的回收率,为其他成员国树立了榜样。法国和义大利正在扩大生产者责任制计划,透过优惠费用鼓励使用消费后回收树脂。东欧凭藉着具有竞争力的工资水平和接近性欧盟市场的地理优势,吸引软质包装投资,为加工商提供成本和合规方面的优势。
在北美,成熟的消费模式推动了稳定的替换需求,而全通路能力也呈现出成长动能。美国加工商正利用机器人技术实现瓦楞纸板生产线的自动化,并确保零破损交付,以符合亚马逊「零挫」购物体验的指导原则。加拿大的押金制度支持高品质的玻璃回收利用,并为精酿饮料填充机提供原料。墨西哥的树脂工厂同时供应国内和美国市场,从而有效抵御了供应衝击。
在中东和非洲地区,随着沙乌地阿拉伯和阿联酋经济多元化进程的推进,经济成长正在加速。新兴特大城市正在兴起现代零售业态,对先进的初级和二级包装提出了更高的要求。南非回收基础设施的完善确保了再生PET(rPET)的供应,从而支持了该地区的瓶罐循环利用体系,并将循环经济概念融入到不断扩张的全球包装市场中。
其他福利:
- Excel格式的市场预测(ME)表
- 3个月的分析师支持
目录
第一章 引言
- 研究假设和市场定义
- 调查范围
第二章调查方法
第三章执行摘要
第四章 市场情势
- 市场概览
- 市场驱动因素
- 与永续发展挂钩的采购承诺
- 电子商务小包裹量快速成长
- 品牌所有者转向单一材料薄膜
- 对一次性塑胶製品的监管禁令
- 利用现场数位印刷实现 SKU 多样化
- 推出智慧互联包装(支援物联网、QR码、NFC 等技术)
- 市场限制
- 原油价格波动会影响树脂成本
- 已开发国家日益高涨的反塑胶情绪
- 铝罐板材供应紧张
- 容器玻璃熔炉能源成本不断上涨
- 产业价值链分析
- 监管环境
- 技术展望
- 波特五力分析
- 新进入者的威胁
- 供应商的议价能力
- 买方的议价能力
- 替代品的威胁
- 竞争对手之间的竞争
- 宏观经济因素如何影响市场
第五章 市场规模与成长预测
- 按包装类型
- 塑胶包装
- 按类型
- 硬质塑胶包装
- 依材料类型
- 聚丙烯(PP)
- 聚对苯二甲酸乙二醇酯(PET)
- 聚氯乙烯(PVC)
- 聚苯乙烯(PS)和发泡聚苯乙烯(EPS)
- 其他材料类型
- 依产品类型
- 瓶子和罐子
- 瓶盖和封口
- 托盘和容器
- 其他产品类型
- 按最终用途行业划分
- 食物
- 饮料
- 製药
- 化妆品和个人护理
- 产业
- 其他终端用户产业
- 依材料类型
- 软塑胶包装
- 依材料类型
- 聚乙烯(PE)
- 双轴延伸聚丙烯(BOPP)
- 浇铸聚丙烯(CPP)
- 其他材料类型
- 依产品类型
- 小袋和包装袋
- 薄膜和包装
- 其他产品类型
- 按最终用途行业划分
- 食物
- 饮料
- 製药
- 化妆品和个人护理
- 产业
- 其他终端用户产业
- 依材料类型
- 硬质塑胶包装
- 依产品类型
- 瓶子和罐子
- 小袋和袋子
- 散装产品
- 其他产品类型
- 按最终用途行业划分
- 食物
- 饮料
- 化妆品和个人护理
- 製药
- 产业
- 其他终端用户产业
- 按类型
- 纸包装
- 依产品类型
- 可折迭瓦楞纸箱
- 瓦楞纸箱
- 液态纸板
- 其他产品类型
- 按最终用途行业划分
- 食物
- 饮料
- 电子商务
- 其他终端用户产业
- 依产品类型
- 容器玻璃
- 按颜色
- 绿色的
- 琥珀色
- 燧石
- 其他颜色
- 按最终用途行业划分
- 食物
- 饮料
- 酒精饮料
- 不含酒精的饮料
- 个人护理和化妆品
- 药品(不含管瓶和安瓿瓶)
- 香水
- 按颜色
- 金属罐和容器
- 依材料类型
- 钢
- 铝
- 依产品类型
- 能
- 鼓和桶
- 瓶盖和封口
- 其他产品类型
- 按最终用途行业划分
- 食物
- 饮料
- 化工和石油
- 产业
- 油漆和涂料
- 其他终端用户产业
- 依材料类型
- 塑胶包装
- 按包装类型
- 死板的
- 灵活的
- 按最终用途行业划分
- 食物
- 饮料
- 製药和医疗保健
- 个人护理和化妆品
- 产业
- 电子商务
- 其他终端用户产业
- 按地区
- 北美洲
- 美国
- 加拿大
- 墨西哥
- 南美洲
- 巴西
- 阿根廷
- 墨西哥
- 其他南美洲
- 欧洲
- 德国
- 法国
- 英国
- 义大利
- 西班牙
- 波兰
- 其他欧洲地区
- 亚太地区
- 中国
- 印度
- 日本
- 泰国
- 澳洲
- 韩国
- 亚太其他地区
- 中东和非洲
- 中东
- 沙乌地阿拉伯
- 阿拉伯聯合大公国
- 土耳其
- 其他中东地区
- 非洲
- 南非
- 奈及利亚
- 埃及
- 其他非洲地区
- 中东
- 北美洲
第六章 竞争情势
- 市场集中度
- 策略趋势
- 市占率分析
- 公司简介
- Amcor plc
- International Paper Company
- Smurfit WestRock
- Ball Corporation
- Crown Holdings Inc.
- Mondi plc
- Oji Holdings Corporation
- UFlex Limited
- Huhtamaki Oyj
- Sealed Air Corporation
- Greif Inc.
- Sonoco Products Company
- AptarGroup Inc.
- ALPLA Group GmbH
- OI Glass Inc.
- Verallia SE
- Vidrala SA
- Gerresheimer AG
- Vitro SAB de CV
- Ardagh Group SA
- CANPACK SA
- Silgan Holdings Inc.
- AGI Glaspac
- Packman Packaging Pvt. Ltd.
- Tetra Pak International SA
第七章 市场机会与未来展望
The global packaging market size in 2026 is estimated at USD 1,220.36 billion, growing from 2025 value of USD 1,180 billion with 2031 projections showing USD 1,443.9 billion, growing at 3.42% CAGR over 2026-2031.
This steady expansion demonstrates how the global packaging market continues to mature while absorbing regulatory costs linked to circular-economy mandates and shifting consumer expectations that favor sustainability over pure cost-performance metrics. Demand resilience arises from packaging's irreplaceable protection, brand-building, and compliance functions across food, beverage, pharmaceuticals, and e-commerce channels. Asia-Pacific keeps capital intensity low through large-scale manufacturing, whereas developed regions invest in advanced recycling, mono-material films, and digital printing that enable near-real-time SKU launches. Meanwhile, e-commerce parcel growth, regulatory bans on single-use plastics, and corporate sustainability targets reinforce capital flows toward lighter materials, bio-based feedstocks, and on-demand customization platforms. Brands pursuing differentiation increasingly embed digital identifiers that support traceability, consumer engagement, and compliance with evolving extended producer responsibility (EPR) schemes.
Global Packaging Market Trends and Insights
Sustainability-Linked Purchasing Commitments Drive Material Innovation
Corporate mandates now specify minimum recycled content and confirmed recyclability, accelerating investment in molecular recycling plants and bio-based resins. Estee Lauder reached 71% compliance with its "5 Rs" packaging framework in 2024, illustrating how premium brands monetize sustainability narratives. Procurement teams embed carbon and recyclability metrics into supplier scorecards, a trend that aligns with forthcoming EPR fees that penalize hard-to-recycle formats. Certification programs such as the Association of Plastic Recyclers' design-for-recycling guidelines supply technical blueprints that shorten development cycles. As a result, resin suppliers scale depolymerization units that return PET and polyamide to virgin-grade feedstock, letting converters hit recycled-content targets without compromising shelf life. Investors reward companies that link executive bonuses to packaging footprint reductions, further institutionalizing sustainable-material adoption.
E-Commerce Parcel Volume Explosion Reshapes Protective Packaging
Urban fulfillment centers ship billions of single-item orders that face more handling steps than traditional store deliveries, heightening damage-prevention needs. Amazon's AI-driven pack-line optimization removed 95% of plastic air pillows, substituting paper cushioning that maintains product integrity and improves curbside recyclability. Automated right-sizing machinery now cuts custom corrugated blanks per order, trimming material use by up to 30% while slashing dimensional-weight fees. These volume dynamics elevate demand for lightweight flexible mailers with integrated tear strips and return seals. Digital presses print small-batch graphics that reinforce brand storytelling during unboxing. Consequently, converters capable of integrating data analytics with converting assets capture growing e-commerce wallet share, while traditional bulk shippers retrofit plants with new forming and sealing technologies.
Crude-Oil Price Volatility Impacts Resin Budgets
Polyethylene, polypropylene, and PET prices correlate strongly with Brent crude, creating unpredictable margin swings for converters on quarterly contracts. Sudden USD 10 per-barrel spikes in 2024 translated into double-digit resin surcharges inside four weeks, straining small extruders that lack hedging tools. Brand owners demanded fixed-price agreements, shifting cost risk downstream and prompting converters to accelerate recycled-content usage that follows a different price curve. Paperboard prices also climbed because higher diesel rates elevated transport costs and chemical inputs. The volatility steers capital toward regional resin suppliers and shortens supply chains, although capacity gaps persist in high-purity rPET pellets needed for food-grade applications.
Other drivers and restraints analyzed in the detailed report include:
- Brand-Owner Shift to Mono-Material Films Simplifies Recycling
- Regulatory Bans on Single-Use Plastics Accelerate Alternatives
- Rising Anti-Plastic Sentiment Shapes Brand Decisions
For complete list of drivers and restraints, kindly check the Table Of Contents.
Segment Analysis
Plastic packaging retained 41.55% of the global packaging market share in 2025 on the strength of its versatility, sealing speed, and cost efficiency. Yet paper packaging's 4.47% CAGR through 2031 outpaces overall global packaging market growth as regulators and brand charters privilege renewable fiber over petroleum-based substrates. The global packaging market size allocated to paper formats widens, supported by barrier coatings that now survive freezer-to-microwave cycles. Corrugated converters invest in digital single-pass presses that enable shelf-ready graphics, letting retailers skip additional display trays. Material substitution accelerates in quick-service food, where fiber bowls replace expanded polystyrene, and in confectionery multipacks that migrate from oriented polypropylene to recyclable coated paper.
The rigid plastics segment preserves traction via innovations in mono-material PET jars and HDPE bottles compatible with mechanical recycling, sustaining share in sauces, dairy, and home-care. Flexible plastic films enjoy e-commerce tailwinds owing to their low weight and tamper-evident seals. Meanwhile, metal cans face supply-chain limits as aerospace and automotive demand collide with packaging orders, driving cost pressure. Glass maintains niche roles in premium beverages but absorbs energy-price shocks that encourage light-weighting. Fiber growth continues as mills ramp high-performance linerboards capable of replacing bleached polyethylene-coated cartons, creating new value pools inside the global packaging market.
The Packaging Market Report is Segmented by Packaging Type (Plastic Packaging, Paper Packaging, Container Glass, Metal Cans and Containers), Packaging Format (Rigid, Flexible), End-Use Industry (Food, Beverage, Pharmaceuticals and Healthcare, Personal Care and Cosmetics, Industrial, E-Commerce), and Geography (North America, South America, Europe, and More). The Market Forecasts are Provided in Terms of Value (USD).
Geography Analysis
Asia-Pacific's 39.72% share reflects unparalleled manufacturing density plus rising disposable incomes that expand packaged food, beverage, and personal-care consumption. China dominates flexible film extrusion capacity, while India's blister-pack output meets growing pharmaceutical demand and exports to Africa. Mature markets like Japan and South Korea add value through high-precision converting, antimicrobial coatings, and digital embellishment. Indonesia and Vietnam scale corrugated plants to support electronics export hubs, fueling steady cartonboard demand.
Europe maintains leadership in eco-design, leveraging PPWR-driven mandates that incentivize source-reduced and recyclable solutions. Germany's closed-loop PET system achieves collection rates near 98%, offering a blueprint for other member states. France and Italy expand producer-responsibility schemes that reward post-consumer resin usage with fee discounts. Eastern Europe attracts flexible-packaging investments that balance wage competitiveness with EU market proximity, giving converters cost and compliance advantages.
North America's mature consumption drives consistent replacement demand, yet growth pockets emerge in omnichannel fulfillment. U.S. converters automate corrugated factories with robotics, meeting Amazon Frustration-Free guidelines for damage-free delivery. Canada's deposit systems support high-quality glass recycling that supplies craft beverage fillers, while Mexico's resin plants feed both domestic and U.S. markets, hedging against supply shocks.
Middle East and Africa accelerates as Saudi Arabia and UAE diversify economies; new megacities attract modern retail formats requiring sophisticated primary and secondary packaging. South Africa's collection infrastructure upgrades enable rPET availability, feeding regional bottle loops and embedding circular practices into the expanding global packaging market.
- Amcor plc
- International Paper Company
- Smurfit WestRock
- Ball Corporation
- Crown Holdings Inc.
- Mondi plc
- Oji Holdings Corporation
- UFlex Limited
- Huhtamaki Oyj
- Sealed Air Corporation
- Greif Inc.
- Sonoco Products Company
- AptarGroup Inc.
- ALPLA Group GmbH
- O-I Glass Inc.
- Verallia SE
- Vidrala S.A.
- Gerresheimer AG
- Vitro S.A.B. de C.V.
- Ardagh Group S.A.
- CANPACK S.A.
- Silgan Holdings Inc.
- AGI Glaspac
- Packman Packaging Pvt. Ltd.
- Tetra Pak International S.A.
Additional Benefits:
- The market estimate (ME) sheet in Excel format
- 3 months of analyst support
TABLE OF CONTENTS
1 INTRODUCTION
- 1.1 Study Assumptions and Market Definition
- 1.2 Scope of the Study
2 RESEARCH METHODOLOGY
3 EXECUTIVE SUMMARY
4 MARKET LANDSCAPE
- 4.1 Market Overview
- 4.2 Market Drivers
- 4.2.1 Sustainability-linked purchasing commitments
- 4.2.2 E-commerce parcel volume explosion
- 4.2.3 Brand-owner shift to mono-material films
- 4.2.4 Regulatory bans on single-use plastics
- 4.2.5 On-site digital print enabling SKU proliferation
- 4.2.6 Adoption of smart and connected packaging (IoT, QR, NFC-enabled solutions)
- 4.3 Market Restraints
- 4.3.1 Crude-oil price volatility impacting resin costs
- 4.3.2 Rising anti-plastic sentiment in developed economies
- 4.3.3 Aluminum can sheet supply tightness
- 4.3.4 Container-glass furnace energy inflation
- 4.4 Industry Value Chain Analysis
- 4.5 Regulatory Landscape
- 4.6 Technological Outlook
- 4.7 Porter's Five Forces Analysis
- 4.7.1 Threat of New Entrants
- 4.7.2 Bargaining Power of Suppliers
- 4.7.3 Bargaining Power of Buyers
- 4.7.4 Threat of Substitutes
- 4.7.5 Competitive Rivalry
- 4.8 The Impact of Macroeconomic Factors on the Market
5 MARKET SIZE & GROWTH FORECASTS (VALUE)
- 5.1 By Packaging Type
- 5.1.1 Plastic Packaging
- 5.1.1.1 By Type
- 5.1.1.1.1 Rigid Plastic Packaging
- 5.1.1.1.1.1 By Material Type
- 5.1.1.1.1.1.1 Polypropylene (PP)
- 5.1.1.1.1.1.2 Polyethylene Terephthalate (PET)
- 5.1.1.1.1.1.3 Polyvinyl Chloride (PVC)
- 5.1.1.1.1.1.4 Polystyrene (PS) and Expanded Polystyrene (EPS)
- 5.1.1.1.1.1.5 Other Material Types
- 5.1.1.1.1.2 By Product Type
- 5.1.1.1.1.2.1 Bottles and Jars
- 5.1.1.1.1.2.2 Caps and Closures
- 5.1.1.1.1.2.3 Trays and Containers
- 5.1.1.1.1.2.4 Other Product Types
- 5.1.1.1.1.3 By End-use Industry
- 5.1.1.1.1.3.1 Food
- 5.1.1.1.1.3.2 Beverage
- 5.1.1.1.1.3.3 Pharmaceutical
- 5.1.1.1.1.3.4 Cosmetics and Personal Care
- 5.1.1.1.1.3.5 Industrial
- 5.1.1.1.1.3.6 Other End-use Industries
- 5.1.1.1.1.1 By Material Type
- 5.1.1.1.2 Flexible Plastic Packaging
- 5.1.1.1.2.1 By Material Type
- 5.1.1.1.2.1.1 Polyethylene (PE)
- 5.1.1.1.2.1.2 Biaxially Oriented Polypropylene (BOPP)
- 5.1.1.1.2.1.3 Cast Polypropylene (CPP)
- 5.1.1.1.2.1.4 Other Material Types
- 5.1.1.1.2.2 By Product Type
- 5.1.1.1.2.2.1 Pouches and Bags
- 5.1.1.1.2.2.2 Films and Wraps
- 5.1.1.1.2.2.3 Other Product Types
- 5.1.1.1.2.3 By End-use Industry
- 5.1.1.1.2.3.1 Food
- 5.1.1.1.2.3.2 Beverage
- 5.1.1.1.2.3.3 Pharmaceutical
- 5.1.1.1.2.3.4 Cosmetics and Personal Care
- 5.1.1.1.2.3.5 Industrial
- 5.1.1.1.2.3.6 Other End-use Industries
- 5.1.1.1.2.1 By Material Type
- 5.1.1.1.1 Rigid Plastic Packaging
- 5.1.1.2 By Product Type
- 5.1.1.2.1 Bottles and Jars
- 5.1.1.2.2 Pouches and Bags
- 5.1.1.2.3 Bulk-Grade Products
- 5.1.1.2.4 Other Product Types
- 5.1.1.3 By End-use Industry
- 5.1.1.3.1 Food
- 5.1.1.3.2 Beverages
- 5.1.1.3.3 Cosmetics and Personal Care
- 5.1.1.3.4 Pharamceuticals
- 5.1.1.3.5 Industrial
- 5.1.1.3.6 Other End-use Industries
- 5.1.1.1 By Type
- 5.1.2 Paper Packaging
- 5.1.2.1 By Product Type
- 5.1.2.1.1 Folding Carton
- 5.1.2.1.2 Corrugated Boxes
- 5.1.2.1.3 Liquid Paperboard
- 5.1.2.1.4 Other Product Types
- 5.1.2.2 By End-use Industry
- 5.1.2.2.1 Food
- 5.1.2.2.2 Beverages
- 5.1.2.2.3 E-commerce
- 5.1.2.2.4 Other End-use Industry
- 5.1.2.1 By Product Type
- 5.1.3 Container Glass
- 5.1.3.1 By Color
- 5.1.3.1.1 Green
- 5.1.3.1.2 Amber
- 5.1.3.1.3 Flint
- 5.1.3.1.4 Other Colors
- 5.1.3.2 By End-use Industry
- 5.1.3.2.1 Food
- 5.1.3.2.2 Beverage
- 5.1.3.2.2.1 Alcoholic
- 5.1.3.2.2.2 Non-Alcoholic
- 5.1.3.2.3 Personal Care and Cosmetics
- 5.1.3.2.4 Pharmaceuticals (excluding Vials and Ampoules)
- 5.1.3.2.5 Perfumery
- 5.1.3.1 By Color
- 5.1.4 Metal Cans and Containers
- 5.1.4.1 By Material Type
- 5.1.4.1.1 Steel
- 5.1.4.1.2 Aluminum
- 5.1.4.2 By Product Type
- 5.1.4.2.1 Cans
- 5.1.4.2.2 Drums and Barrels
- 5.1.4.2.3 Caps and Closures
- 5.1.4.2.4 Other Product Types
- 5.1.4.3 By End-use Industry
- 5.1.4.3.1 Food
- 5.1.4.3.2 Beverage
- 5.1.4.3.3 Chemicals and Petroleum
- 5.1.4.3.4 Industrial
- 5.1.4.3.5 Paints and coatings
- 5.1.4.3.6 Other End-use Industries
- 5.1.4.1 By Material Type
- 5.1.1 Plastic Packaging
- 5.2 By Packaging Format
- 5.2.1 Rigid
- 5.2.2 Flexible
- 5.3 By End-Use Industry
- 5.3.1 Food
- 5.3.2 Beverage
- 5.3.3 Pharmaceuticals and Healthcare
- 5.3.4 Personal Care and Cosmetics
- 5.3.5 Industrial
- 5.3.6 E-commerce
- 5.3.7 Other End-use Industry
- 5.4 By Geography
- 5.4.1 North America
- 5.4.1.1 United States
- 5.4.1.2 Canada
- 5.4.1.3 Mexico
- 5.4.2 South America
- 5.4.2.1 Brazil
- 5.4.2.2 Argentina
- 5.4.2.3 Mexico
- 5.4.2.4 Rest of South America
- 5.4.3 Europe
- 5.4.3.1 Germany
- 5.4.3.2 France
- 5.4.3.3 United Kingdom
- 5.4.3.4 Italy
- 5.4.3.5 Spain
- 5.4.3.6 Poland
- 5.4.3.7 Rest of Europe
- 5.4.4 Asia-Pacific
- 5.4.4.1 China
- 5.4.4.2 India
- 5.4.4.3 Japan
- 5.4.4.4 Thailand
- 5.4.4.5 Australia
- 5.4.4.6 South Korea
- 5.4.4.7 Rest of Asia-Pacific
- 5.4.5 Middle East and Africa
- 5.4.5.1 Middle East
- 5.4.5.1.1 Saudi Arabia
- 5.4.5.1.2 United Arab Emirates
- 5.4.5.1.3 Turkey
- 5.4.5.1.4 Rest of Middle East
- 5.4.5.2 Africa
- 5.4.5.2.1 South Africa
- 5.4.5.2.2 Nigeria
- 5.4.5.2.3 Egypt
- 5.4.5.2.4 Rest of Africa
- 5.4.5.1 Middle East
- 5.4.1 North America
6 COMPETITIVE LANDSCAPE
- 6.1 Market Concentration
- 6.2 Strategic Moves
- 6.3 Market Share Analysis
- 6.4 Company Profiles (includes Global level Overview, Market level overview, Core Segments, Financials as available, Strategic Information, Market Rank/Share for key companies, Products and Services, and Recent Developments)
- 6.4.1 Amcor plc
- 6.4.2 International Paper Company
- 6.4.3 Smurfit WestRock
- 6.4.4 Ball Corporation
- 6.4.5 Crown Holdings Inc.
- 6.4.6 Mondi plc
- 6.4.7 Oji Holdings Corporation
- 6.4.8 UFlex Limited
- 6.4.9 Huhtamaki Oyj
- 6.4.10 Sealed Air Corporation
- 6.4.11 Greif Inc.
- 6.4.12 Sonoco Products Company
- 6.4.13 AptarGroup Inc.
- 6.4.14 ALPLA Group GmbH
- 6.4.15 O-I Glass Inc.
- 6.4.16 Verallia SE
- 6.4.17 Vidrala S.A.
- 6.4.18 Gerresheimer AG
- 6.4.19 Vitro S.A.B. de C.V.
- 6.4.20 Ardagh Group S.A.
- 6.4.21 CANPACK S.A.
- 6.4.22 Silgan Holdings Inc.
- 6.4.23 AGI Glaspac
- 6.4.24 Packman Packaging Pvt. Ltd.
- 6.4.25 Tetra Pak International S.A.
7 MARKET OPPORTUNITIES AND FUTURE OUTLOOK
- 7.1 White-space and Unmet-Need Assessment
 湿度控制包装市场预测至2034年-按产品类型、材料、包装形式、通路、最终用户和地区分類的全球分析
 感官包装市场:依技术、材料、感测器类型、包装形式和应用划分-2026-2032年全球市场预测
 2026年全球包装与标籤服务市场报告气泡膜市场:2026-2032年全球市场预测(依材料、厚度、应用、最终用户及通路划分)復古包装市场:按材料、类型、最终用途、印刷技术和通路-2026-2032年全球预测纸质復古包装市场:依材料、包装类型、销售管道、最终用户、应用程式划分,全球预测(2026-2032)多功能零件市场按产品类型、价格范围、应用、垂直产业和分销管道划分,全球预测(2026-2032年)纸塑包装器材市场:依机器类型、材料、操作类型和应用划分,全球预测(2026-2032年)
 航太级包装市场规模、份额、成长、产业分析、材料、应用及区域分布(至2034年)全球电子顺磁共振波谱仪市场(按产品类型、频率、工作模式、组件、应用和最终用户划分)预测(2026-2032年)