


 |
市场调查报告书
商品编码
1910579
美国包装市场:市场占有率分析、产业趋势与统计、成长预测(2026-2031年)United States Packaging - Market Share Analysis, Industry Trends & Statistics, Growth Forecasts (2026 - 2031) |
||||||
※ 本网页内容可能与最新版本有所差异。详细情况请与我们联繫。
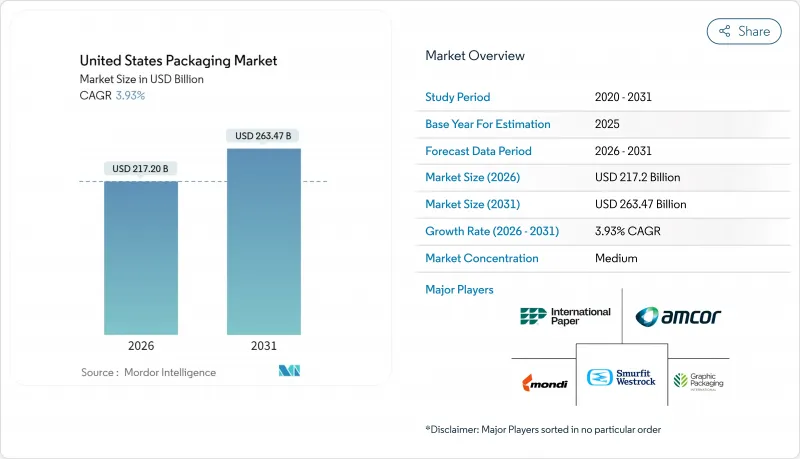
美国包装市场预计将从 2025 年的 2,089.8 亿美元成长到 2026 年的 2,172 亿美元,到 2031 年达到 2,634.7 亿美元,2026 年至 2031 年的复合年增长率为 3.93%。
与价值9408亿美元的卡车运输业的紧密联繫支撑着美国包装市场的韧性,因为包装设计和重量直接影响货运成本。电子商务的扩张、州级生产者延伸责任制(EPR)等监管政策的变化,以及製药产能加速回流,都在推动对自动化生产线和阻隔性材料的投资。儘管美国市场持续受益于食品饮料行业的优质化,但来自无PFAS法规和聚合物产能增加的成本压力正在挤压加工商的利润空间。大规模一体化供应商利用其规模和研发实力来承担监管合规成本并维持定价权。同时,规模较小的公司则在细分市场中寻求差异化竞争。
美国包装市场趋势与洞察
电子商务的快速成长推动了对小批量包装的需求。
投资自动化二级生产线能够帮助消费品製造商有效应对劳动力短缺和产品种类繁多的挑战。玫琳凯公司斥资200万美元进行设备升级后,在维持每分钟50-60件产品产量的同时,减少了85%的生产线人力成本。主要承运商的体积重量收费政策有利于小型轻便的小包裹,从而刺激了对尺寸合适的纸板衬垫和缓衝材料的需求。随着美国包装市场向全通路解决方案转型,能够提供集保护、品牌推广和数据丰富于一体的整合解决方案的加工商,正赢得寻求降低最后一公里配送成本的订单的青睐。自动化有助于经销商减少拣货和包装错误,并实现隔日送达,因此可靠的二级包装成为竞争优势的关键。拥有多元化材料组合的加工商正受益于基材多源采购的趋势,从而降低供应链风险。
食品饮料产业的优质化正在加速对阻隔性性软包装的需求。
为了延长保质期并支持洁净标示配方,高端品牌正转向使用多层高阻隔薄膜,这推高了美国包装市场的单价。先进的涂层技术能够阻隔氧气、光线和水分,在不添加任何添加剂的情况下保护天然风味,并减少食物浪费。消费者偏好可重复密封的吸嘴和带有透明窗口的包装袋,这要求加工商在阻隔性能和商店吸引力之间取得平衡。 FDA的食品接触认证增加了合规的复杂性,并限制了资本投入较低的竞争对手进入市场。品牌所有者正透过以消费者对感知品质的支付意愿为核心的利润扩大策略来证明更高的包装成本是合理的。有机零食和即饮咖啡销售的成长正在推动对高端软包装的需求,并增强薄膜挤出製造商的长期订单。
加州SB-54号法案下的生产者延伸责任计画中的成本转移
纽森州长因企业负担而推迟了最初法规的实施,但到2032年将塑胶使用量减少25%的目标以及50亿美元的废弃物基金仍然有效。生产商将被要求投资建造回收基础设施并重新设计包装,否则将支付分级费用。虽然美国包装市场的大型企业能够将成本分摊到各种产品上,但小型加工商面临利润率降低和资本投资能力下降的问题。不确定性阻碍了新产品推出,而关于使用加州特有SKU还是全国统一标准的争论也使州际物流变得复杂。成本转嫁给品牌所有者给商店价格带来了压力,并可能减缓某些消费品类别的销售成长。
细分市场分析
由于塑胶用途广泛且成本效益高,预计2025年,塑胶在美国包装市场仍将占据35.88%的份额。然而,纸张和纸板正以5.33%的复合年增长率快速增长,预计到2031年,随着零售商转向纤维基替代品,纸张和纸板将蚕食部分塑胶的市场份额。美国能源部承诺投入5,200万美元用于纤维素薄膜,这显示公共部门支持下一代基材的发展。天然高密度聚乙烯(HDPE)的短缺将导致再生树脂价格在2025年3月达到每磅96美分,这将给瓶到瓶回收计划带来挑战。
美国包装市场的塑胶加工商面临双重压力:碳排放会计要求和树脂供应过剩的风险。投资正转向可回收的单组分聚乙烯薄膜,而多层尼龙结构则被高阻隔纸所取代。由于饮料製造商采用可无限循环利用的合金罐,金属包装的需求依然强劲。整体而言,如今材料的选择重点在于平衡成本、循环利用指标和监管风险,而非仅仅关注基本性能。
到2025年,纸和纸板製品将占美国包装市场份额的28.70%,这主要得益于瓦楞纸包装的大量消耗。金属製品预计将以6.64%的复合年增长率成长,因为碳酸饮料和硬苏打水因其轻盈和可回收的优点而选择铝罐。 Crown Holdings的饮料罐收入预计在2024年成长17%,证实了市场需求的持续成长。 Silgan维持了金属食品罐市场50%的份额,显示常温保存产品的市场韧性。
数位印刷技术的应用使加工商能够应对季节性的SKU激增,而HDPE等硬质塑胶瓶仍然是食品杂货行业超值包装的首选。然而,金属的无限可回收特性引起了具有环保意识的消费者的共鸣,促使促销预算转向以罐装为主的包装形式。儘管伦敦金属交易所(LME)铝价的波动可能会限制销售成长,但品牌所有者正透过签订多年期照付不议合约来规避风险,从而稳定与罐体製造商的订单。
其他福利:
- Excel格式的市场预测(ME)表
- 分析师支持(3个月)
目录
第一章 引言
- 研究假设和市场定义
- 调查范围
第二章调查方法
第三章执行摘要
第四章 市场情势
- 市场概览
- 市场驱动因素
- 电子商务的快速成长推动了对小批量包装的需求。
- 食品和饮料的高端优质化正在加速对高阻隔阻隔性柔性包装材料的需求。
- 药品填充和包装设备回归日本,推动了对无菌包装的需求。
- 消费品製造商的自动化二级包装生产线
- 零售媒体网路更青睐可直接上架的包装形式。
- 美国和能源部为生物聚合物先导工厂提供的津贴(低调)
- 市场限制
- 加州SB-54法案「生产者延伸责任制」成本转移
- 不含 PFAS 的规定会增加配方成本
- 2028-2029年PE和PP裂解产能过剩将导致压力转换器利润率下降(被低估)。
- 底盘短缺导致纸箱运输成本上涨(未充分通报)
- 产业供应链分析
- 监管环境
- 技术展望
- 波特五力分析
- 供应商的议价能力
- 消费者议价能力
- 新进入者的威胁
- 替代品的威胁
- 竞争对手之间的竞争
第五章 市场规模与成长预测
- 依材料类型
- 纸和纸板
- 塑胶
- 聚乙烯 聚丙烯 (PP)
- 高密度聚苯乙烯(HDPE)和低密度聚乙烯(LDPE)
- 聚对苯二甲酸乙二醇酯(PET)
- 聚氯乙烯(PVC)
- 聚苯乙烯(PS)
- 其他塑胶製品
- 金属
- 玻璃容器
- 依产品类型
- 纸和纸板产品类型
- 折迭纸盒和硬纸盒
- 瓦楞纸箱和容器
- 免洗纸製品
- 其他纸和纸板产品类型
- 塑胶製品类型
- 硬质塑胶
- 瓶子和罐子
- 瓶盖和封口
- 散装产品
- 其他硬质塑胶胶製品类型
- 软塑胶
- 小袋
- 包包
- 薄膜和包装
- 其他软塑胶製品类型
- 硬质塑胶
- 金属製品类型
- 能
- 瓶盖和封口
- 气雾剂容器
- 其他金属製品类型
- 玻璃容器产品类型
- 瓶子
- 瓶子
- 纸和纸板产品类型
- 按包装类型
- 硬质包装形式
- 软包装
- 最终用户
- 食物
- 饮料
- 药品和医疗保健
- 个人护理和化妆品
- 工业/化工
- 农业
- 车
- 其他最终用户
第六章 竞争情势
- 市场集中度
- 策略趋势
- 市占率分析
- 公司简介
- Amcor plc
- Sealed Air Corporation
- Ball Corporation
- Crown Holdings, Inc.
- Sonoco Products Company
- American Packaging Corporation
- International Paper Company
- Graphic Packaging Holding Company
- Novolex Holdings, LLC
- ProAmpac Holdings Inc.
- Silgan Holdings Inc.
- AptarGroup, Inc.
- Huhtamaki Oyj
- Printpack, Inc.
- Packaging Corporation of America
- CCL Industries Inc.
- Ardagh Group SA
- Smurfit WestRock plc
- Mondi plc
第七章 市场机会与未来展望
The United States Packaging market is expected to grow from USD 208.98 billion in 2025 to USD 217.2 billion in 2026 and is forecast to reach USD 263.47 billion by 2031 at 3.93% CAGR over 2026-2031.
Strong links to the country's USD 940.8 billion trucking sector keep the US packaging market resilient, because packaging design and weight directly shape freight costs. E-commerce proliferation, regulatory shifts such as state-level Extended Producer Responsibility statutes, and accelerated on-shoring of pharmaceutical capacity are steering capital toward automation-ready lines and higher-barrier materials. The US market continues to benefit from premiumization in food and beverage segments, while cost pressures from PFAS-free mandates and polymer capacity additions squeeze margins for converters. Large, integrated suppliers leverage scale and R&D depth to absorb regulatory compliance costs and preserve pricing power as smaller firms seek niche differentiation.
United States Packaging Market Trends and Insights
E-commerce Boom Driving Small-Parcel Packaging Demand
Investments in automation-ready secondary lines allow consumer packaged goods firms to manage labor shortages and SKU proliferation efficiently, with Mary Kay trimming line labor by 85% after a USD 2 million upgrade while maintaining 50-60 units per minute. Dimensional-weight pricing by major carriers rewards smaller, lighter parcel formats, stimulating demand for right-sized corrugated inserts and cushioning. As the US packaging market aligns with omnichannel fulfillment, converters that offer integrated protective, branded, and data-rich solutions capture volume from retailers seeking to cut last-mile costs. Automation helps distributors minimize pick-pack errors and meet one-day delivery promises, making reliable secondary packaging a competitive necessity. Supply chain risk mitigation encourages multisourcing of substrates, benefiting converters with diversified material portfolios.
Premiumization in Food and Beverage Accelerating Demand for High-Barrier Flexibles
Premium brands are shifting to multilayer high-barrier films that extend shelf life and support clean-label formulas, a move that lifts average price per unit in the US packaging market. Advanced coatings block oxygen, light, and moisture, safeguarding natural flavors without additives and reducing food waste. Consumers favor pouches with resealable spouts and transparent windows, pushing converters to balance barrier performance with shelf appeal. FDA food contact clearances add compliance complexity, limiting the entry of low-capex competitors. Brand owners justify higher pack costs through margin-expansion strategies centered on consumer willingness to pay for perceived quality. As sales of organic snacks and ready-to-drink coffees climb, demand for premium flexible formats strengthens long-term order books for film extruders.
California's SB-54 Extended Producer Responsibility Cost Pass-Through
Governor Newsom delayed initial regulations, citing business burden, yet the 25% plastic reduction mandate by 2032 and the USD 5 billion waste fund remain in force. Producers must finance recycling infrastructure and redesign packages or pay modulated fees. Larger players in the US packaging market spread costs across wider portfolios, whereas small converters face margin erosion and reduced capex capacity. Uncertainty stalls new-product launches and complicates interstate logistics as companies debate California-only SKUs versus national harmonization. Cost pass-through to brand owners pressures shelf pricing, potentially dampening volume growth in discretionary categories.
Other drivers and restraints analyzed in the detailed report include:
- On-shoring of Pharmaceutical Fill-Finish Capacity Boosting Sterile Packaging
- Automation-Ready Secondary Packaging Lines at CPGs
- PFAS-Free Mandates Raising Formulation Costs
For complete list of drivers and restraints, kindly check the Table Of Contents.
Segment Analysis
Plastic retained 35.88% of the US packaging market share in 2025, thanks to versatility and cost efficiency. Paper and paperboard, however, grew at a 5.33% CAGR and are expected to erode some plastic volume by 2031 as retailers pledge fiber-based alternatives. The Department of Energy's USD 52 million fund toward cellulose-based films signals public-sector backing for next-gen substrates. Natural HDPE scarcity pushed recycled resin to 96 cents per pound in March 2025, challenging bottle-to-bottle projects.
Plastic converters in the US packaging market face dual pressure from carbon accounting demands and resin oversupply risks. Investments shift to mono-material PE films engineered for recyclability, while multi-layer nylon structures migrate to high-barrier paper. Metal packaging maintains demand as beverage makers lock in alloy cans to meet infinitely recyclable claims. Overall, material selection now balances cost, circularity metrics, and regulatory exposure more than basic performance.
Paper and paperboard products commanded 28.70% of the US packaging market share in 2025 due to high corrugated volumes. Metal products are forecast to grow at a 6.64% CAGR as carbonated soft drinks and hard seltzers choose aluminum cans for lightweighting and recycling benefits. Crown Holdings' beverage can income rose 17% in 2024, underscoring secular demand. Silgan's 50% hold on metal food cans shows the resilience of shelf-stable products.
Digital print adoption empowers converters to serve seasonal SKU spikes, while rigid plastics such as HDPE jugs retain grocery loyalty for value packs. Yet metal's infinite-recycle narrative resonates with climate-conscious shoppers, shifting promotional budgets toward can-centric formats. Price swings in LME aluminum could temper volume gains, but brand owners hedge through multiyear take-or-pay deals, stabilizing orders for can-makers.
The United States Packaging Market Report is Segmented by Material Type (Paper and Paperboard, Plastic, Metal, and Container Glass), Product Type (Paper and Paperboard Product Type, Plastic Product Type, and More), Packaging Format (Rigid Packaging Format, and Flexible Packaging Format), and End-User (Food, Beverage, Personal Care and Cosmetics, and More), and Geography. The Market Forecasts are Provided in Terms of Value (USD).
List of Companies Covered in this Report:
- Amcor plc
- Sealed Air Corporation
- Ball Corporation
- Crown Holdings, Inc.
- Sonoco Products Company
- American Packaging Corporation
- International Paper Company
- Graphic Packaging Holding Company
- Novolex Holdings, LLC
- ProAmpac Holdings Inc.
- Silgan Holdings Inc.
- AptarGroup, Inc.
- Huhtamaki Oyj
- Printpack, Inc.
- Packaging Corporation of America
- CCL Industries Inc.
- Ardagh Group S.A.
- Smurfit WestRock plc
- Mondi plc
Additional Benefits:
- The market estimate (ME) sheet in Excel format
- 3 months of analyst support
TABLE OF CONTENTS
1 INTRODUCTION
- 1.1 Study Assumptions and Market Definition
- 1.2 Scope of the Study
2 RESEARCH METHODOLOGY
3 EXECUTIVE SUMMARY
4 MARKET LANDSCAPE
- 4.1 Market Overview
- 4.2 Market Drivers
- 4.2.1 E-commerce boom driving small-parcel packaging demand
- 4.2.2 Premiumisation in food and beverage accelerating demand for high-barrier flexibles
- 4.2.3 On-shoring of pharmaceutical fill-finish capacity boosting sterile packaging
- 4.2.4 Automation-ready secondary packaging lines at CPGs
- 4.2.5 Retail media networks favouring shelf-ready formats
- 4.2.6 USDA and DOE grants for biopolymer pilot plants (under-the-radar)
- 4.3 Market Restraints
- 4.3.1 California's SB-54 "Extended Producer Responsibility" cost pass-through
- 4.3.2 PFAS-free mandates raising formulation costs
- 4.3.3 2028-2029 PE and PP cracker capacity overhang depressing converter margins (under-reported)
- 4.3.4 Rising freight rates on corrugated due to chassis shortages (under-reported)
- 4.4 Industry Supply Chain Analysis
- 4.5 Regulatory Landscape
- 4.6 Technological Outlook
- 4.7 Porter's Five Forces Analysis
- 4.7.1 Bargaining Power of Suppliers
- 4.7.2 Bargaining Power of Consumers
- 4.7.3 Threat of New Entrants
- 4.7.4 Threat of Substitutes
- 4.7.5 Intensity of Competitive Rivalry
5 MARKET SIZE AND GROWTH FORECASTS (VALUE)
- 5.1 By Material Type
- 5.1.1 Paper and Paperboard
- 5.1.2 Plastic
- 5.1.2.1 Polyethylene Polypropylene (PP)
- 5.1.2.2 High-density Polyethylene (HDPE) and Low-density Polyethylene (LDPE)
- 5.1.2.3 Polyethylene Terephthalate (PET)
- 5.1.2.4 Polyvinyl Chloride (PVC)
- 5.1.2.5 Polystyrene (PS)
- 5.1.2.6 Other Plastics
- 5.1.3 Metal
- 5.1.4 Container Glass
- 5.2 By Product Type
- 5.2.1 Paper and Paperboard Product Type
- 5.2.1.1 Folding Carton and Rigid Boxes
- 5.2.1.2 Corrugated Boxes and Containers
- 5.2.1.3 Single-use Paper Products
- 5.2.1.4 Other Paper and Paperboard Product Types
- 5.2.2 Plastic Product Type
- 5.2.2.1 Rigid Plastics
- 5.2.2.1.1 Bottles and Jars
- 5.2.2.1.2 Caps and Closures
- 5.2.2.1.3 Bulk-Grade Products
- 5.2.2.1.4 Other Rigid Plastics Product Types
- 5.2.2.2 Flexible Plastics
- 5.2.2.2.1 Pouches
- 5.2.2.2.2 Bags
- 5.2.2.2.3 Films and Wraps
- 5.2.2.2.4 Other Flexible Plastics Product Types
- 5.2.2.1 Rigid Plastics
- 5.2.3 Metal Product Type
- 5.2.3.1 Cans
- 5.2.3.2 Caps and Closures
- 5.2.3.3 Aerosol Containers
- 5.2.3.4 Other Metal Product Types
- 5.2.4 Container Glass Product Type
- 5.2.4.1 Bottles
- 5.2.4.2 Jars
- 5.2.1 Paper and Paperboard Product Type
- 5.3 By Packaging Format
- 5.3.1 Rigid Packaging Format
- 5.3.2 Flexible Packaging Format
- 5.4 By End-user
- 5.4.1 Food
- 5.4.2 Beverage
- 5.4.3 Pharmaceutical and Medical
- 5.4.4 Personal Care and Cosmetics
- 5.4.5 Industrial and Chemical
- 5.4.6 Agriculture
- 5.4.7 Automotive
- 5.4.8 Other End-users
6 COMPETITIVE LANDSCAPE
- 6.1 Market Concentration
- 6.2 Strategic Moves
- 6.3 Market Share Analysis
- 6.4 Company Profiles (includes Global level Overview, Market level overview, Core Segments, Financials as available, Strategic Information, Market Rank/Share for key companies, Products and Services, and Recent Developments)
- 6.4.1 Amcor plc
- 6.4.2 Sealed Air Corporation
- 6.4.3 Ball Corporation
- 6.4.4 Crown Holdings, Inc.
- 6.4.5 Sonoco Products Company
- 6.4.6 American Packaging Corporation
- 6.4.7 International Paper Company
- 6.4.8 Graphic Packaging Holding Company
- 6.4.9 Novolex Holdings, LLC
- 6.4.10 ProAmpac Holdings Inc.
- 6.4.11 Silgan Holdings Inc.
- 6.4.12 AptarGroup, Inc.
- 6.4.13 Huhtamaki Oyj
- 6.4.14 Printpack, Inc.
- 6.4.15 Packaging Corporation of America
- 6.4.16 CCL Industries Inc.
- 6.4.17 Ardagh Group S.A.
- 6.4.18 Smurfit WestRock plc
- 6.4.19 Mondi plc
7 MARKET OPPORTUNITIES AND FUTURE OUTLOOK
- 7.1 White-space and Unmet-Need Assessment
 轻量化包装市场预测至2034年-按材料、产品类型、技术、分销管道、最终用户和地区分類的全球分析湿度控制包装市场预测至2034年-按产品类型、材料、包装形式、通路、最终用户和地区分類的全球分析
 感官包装市场:依技术、材料、感测器类型、包装形式和应用划分-2026-2032年全球市场预测
 2026年全球包装与标籤服务市场报告
 全球枕式包装市场:市场规模、份额、趋势和成长分析(2026-2034)气泡膜市场:2026-2032年全球市场预测(依材料、厚度、应用、最终用户及通路划分)復古包装市场:按材料、类型、最终用途、印刷技术和通路-2026-2032年全球预测纸质復古包装市场:依材料、包装类型、销售管道、最终用户、应用程式划分,全球预测(2026-2032)多功能零件市场按产品类型、价格范围、应用、垂直产业和分销管道划分,全球预测(2026-2032年)纸塑包装器材市场:依机器类型、材料、操作类型和应用划分,全球预测(2026-2032年)