


 |
市场调查报告书
商品编码
1911364
氢气生产:市场占有率分析、产业趋势与统计、成长预测(2026-2031)Hydrogen Generation - Market Share Analysis, Industry Trends & Statistics, Growth Forecasts (2026 - 2031) |
||||||
※ 本网页内容可能与最新版本有所差异。详细情况请与我们联繫。
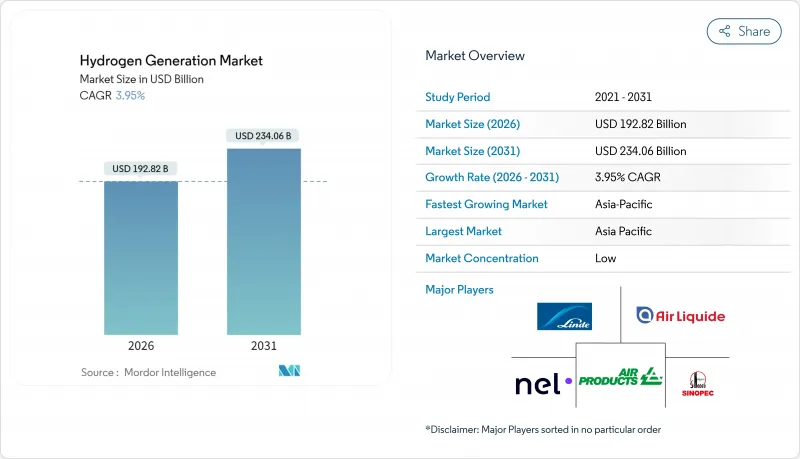
2025年氢气生产市场价值为1,854.9亿美元,预计到2031年将达到2,340.6亿美元,而2026年为1,928.2亿美元。
预计在预测期(2026-2031 年)内,复合年增长率将达到 3.95%。
随着政策支持下对低碳分子的需求取代化石燃料供应,氢气市场正经历扩张,这刺激了对电解和碳捕获维修的投资。欧盟的非生物来源可再生燃料(RFNBO)法规和美国第45V条生产税额扣抵等监管机制,正在将自愿脱碳努力转化为合规义务,为氢气生产市场提供可预测的收入基础。再生能源价格的下降和电解超级工厂规模的扩大正在重塑技术成本,而碳定价机制则正在扩大灰色分子和清洁分子之间的成本差距。同时,钢铁、氨和甲醇等产业部门的长期承购协议正在降低吉瓦级计划的风险,并使氢气生产市场摆脱对传统炼油厂营运的依赖。
全球氢气市场趋势及展望
欧盟RFNBO强制令刺激了对认证绿氢的需求
RFNBO框架要求炼油厂、化工厂和钢铁厂采购经认证的可再生氢,将这种绿色分子转化为符合规定的商品。首轮7.2亿欧元的竞标缩小了化石燃料和可再生能源供应之间的成本差距,为吉瓦级电解阵列的最终投资决策奠定了基础。关于额外性和时间相关性的认证规则区分了高级产品等级,并促进了专用可再生能源购电协议(PPA)的签订。像EWE这样的公共产业正在安装与陆上风电场相连的280兆瓦电解,预计2027年开始营运。结构化的购电协议支援企划案融资,并为设备供应商提供多年订单的运作。
美国第 45V 条款税额扣抵加速了国内电解建设
第45V条于2025年1月最终确定,规定对二氧化碳当量低于4公斤的氢气生产提供每公斤最高3美元的补贴,将使许多美国计划立即获利。三级奖励鼓励按小时回应可再生能源,并促进电网级储能和先进能源管理系统的发展。 Nel ASA公司获得了联邦资金,用于扩建其位于密西西比州的电解工厂;Plug Power公司订单了澳大利亚绿色氨项目的3吉瓦订单,这表明美国政策推动了全球製造规模的扩大。十年税额扣抵的确定性使得长期购电协议得以签订,而开发商则透过模拟各种政治情境来对冲下行风险。
吉瓦级电解专案一级可再生电协议短缺
由于开发商无法以具有竞争力的价格获得长期可再生能源购电协议 (PPA),欧洲规划的 130 吉瓦电解产能中只有一小部分获得了资金筹措。资料中心、电动车充电网路和传统工业都在争夺相同的认证电力,这给氢能计划的利润率带来了压力。德国的国家氢气干线电价(25 欧元/kWh)和荷兰的绿色电力强制令(4%)进一步推高了购电协议的溢价。除非离岸风竞标会加快进行,否则许多计划将被推迟到 2027 年以后,这将加剧短期电力供应的紧张。
细分市场分析
到2025年,灰氢将满足全球97.21%的氢气需求,巩固了对蒸气重组和煤炭气化的传统依赖。这种主导地位掩盖了电解供应的快速成长,预计到2031年,绿氢供应将以32.6%的复合年增长率成长。随着监管意识日益增强的客户越来越多地设定仅使用可再生的合约配额,这种激增正在改变采购模式。预计绿氢市场在欧洲和北美增长最快,因为这些地区的政策奖励有助于抵消不断上涨的平准化成本。现有资产所有者正在对部分工厂进行改造,加装碳捕集设备,以确保获得低碳认证;计划开发商则将可再生能源购电协议(PPA)和管道接入纳入长期供应协议。
蓝氢提供了一种过渡方案,尤其是在天然气资源丰富的地区,可以利用枯竭的储存进行二氧化碳储存。绿松石氢生产流程会产生固体碳产品,虽然已吸引创业投资资金,但仍处于商业化前期阶段。粉红色氢能在核能发电装置容量高但可再生能源用地有限的国家占据着一定的市场份额,为公用事业公司提供了基本负载脱碳方案。根据每种生产流程的成熟度来掌握投资时机,为氢气生产市场的多元化投资组合提供了更多选择。
氢气生产市场报告按原料(灰氢、蓝氢、绿氢、其他)、技术(蒸气重组、煤炭气化、电解、其他)、应用(炼油、化学加工、钢铁、运输燃料、电力和储能、其他)以及地区(北美、欧洲、亚太、南美、中东和非洲)进行细分。
区域分析
到2025年,亚太地区将占全球氢能收入的54.08%,这主要得益于中国庞大的煤炭气化装置和电解槽的加速部署。北京采取双管齐下的模式,一方面维持现有的灰氢生产,另一方面建造连接内蒙古和沿海工业区的世界最大专用氢气管道。印度的「国家绿色氢能计画」在损益平衡资金和电解槽电解槽堆进口关税豁免的支持下,使其成为下一个成长前沿。高日照度的东南亚国协,特别是印尼和马来西亚,正在建造以出口为导向的氨走廊,将其与日本和韩国的买家连接起来。
欧洲是全球第二大市场,但政策力道却遥遥领先。 RFNBO配额、价值240亿欧元的德国主干管道以及HYBRIT等氢基钢铁项目,正推动该地区大规模部署清洁分子能源。计划瓶颈主要在于缺乏低成本的可再生能源购电协议(PPA),但离岸风力发电竞标进程的加速正在释放更多产能。北欧水力发电为斯堪地那维亚电解计划提供稳定、低碳的电力供应,降低了氢气交付成本,使其低于欧洲大陆竞争对手。
在北美,第45V条款激励措施、丰富的风能和太阳能资源,以及墨西哥湾沿岸和中西部地区成熟的产业丛集,都为该项目提供了优势。加拿大的碳定价政策和水力资源丰富的州支持面向亚洲和欧洲的出口导向清洁氨计划。水资源管理和审批流程仍然是美国开发商面临的主要障碍,尤其是在干旱的西部各州。在中东,沙乌地阿拉伯、阿曼和阿拉伯联合大公国正在开发吉瓦级综合枢纽,利用具有竞争力的可再生能源,并透过现有的油轮航线运输绿色氨。非洲新兴的清洁氨计画主要集中在纳米比亚和茅利塔尼亚,这两个国家拥有世界一流的太阳能资源、充足的土地资源,并且接近性欧盟,这些优势正在吸引早期投资。
其他福利:
- Excel格式的市场预测(ME)表
- 3个月的分析师支持
目录
第一章 引言
- 研究假设和市场定义
- 调查范围
第二章调查方法
第三章执行摘要
第四章 市场情势
- 市场概览
- 市场驱动因素
- 欧盟可再生、低碳、非化石能源(RFNBO)强制令加速绿氢能承购合约的签订
- 透过IRA和美国第45V条税额扣抵抵免促进国内电解槽建设
- 中国的煤氢混合政策支撑了灰蓝计划
- 中东氨出口中心催生了对绿氢的千兆瓦级需求。
- 北欧钢铁製造商的HySustain计划
- 日本-澳洲液氢供应链(HESC)
- 市场限制
- 欧洲缺乏吉瓦级电解的一级可再生电协议
- 美国墨西哥湾沿岸的水资源紧张限制了PEM的实施。
- 韩国现有小型模组化反应器(SMR)装置的二氧化碳捕捉高成本
- 加勒比地区的氢气管道标准和安全许可限制
- 供应链分析
- 监管环境
- 技术展望
- 波特五力分析
- 供应商的议价能力
- 买方的议价能力
- 新进入者的威胁
- 替代品的威胁
- 竞争对手之间的竞争
第五章 市场规模与成长预测
- 起源
- 灰氢
- 蓝氢
- 绿氢能
- 绿松石氢
- 粉红氢
- 透过技术
- 蒸气甲烷重整(SMR)
- 煤炭气化
- 热感重整(ATR)
- 部分氧化法(POX)
- 电解(碱性电解、质子交换膜电解 (PEM)、固体氧化物电解(SOE))
- 透过使用
- 炼油
- 化学过程(氨、甲醇)
- 钢(直接还原铁(DRI)、氢气冶炼(H2-BF))
- 运输燃料(燃料电池电动车、船舶、航空)
- 电力和储能
- 住宅和商业供暖
- 按地区
- 北美洲
- 美国
- 加拿大
- 墨西哥
- 欧洲
- 英国
- 德国
- 法国
- 西班牙
- 北欧国家
- 土耳其
- 俄罗斯
- 其他欧洲地区
- 亚太地区
- 中国
- 印度
- 日本
- 韩国
- 东南亚国协
- 澳洲
- 亚太其他地区
- 南美洲
- 巴西
- 阿根廷
- 南美洲其他地区
- 中东和非洲
- 阿拉伯聯合大公国
- 沙乌地阿拉伯
- 埃及
- 南非
- 其他中东和非洲地区
- 北美洲
第六章 竞争情势
- 市场集中度
- 策略性倡议(併购、伙伴关係、购电协议)
- 市场占有率分析(主要企业的市场排名和份额)
- 公司简介
- Linde plc
- Air Liquide
- Air Products & Chemicals
- Sinopec
- Engie SA
- Nel ASA
- Cummins Inc.
- ITM Power plc
- Plug Power Inc.
- Siemens Energy AG
- McPhy Energy SA
- FuelCell Energy
- Enapter AG
- Bloom Energy
- Ballard Power Systems
- Johnson Matthey PLC
- Kawasaki Heavy Industries
- Messer Group GmbH
- Taiyo Nippon Sanso Corp.
- Doosan Fuel Cell
第七章 市场机会与未来展望
The Hydrogen Generation Market was valued at USD 185.49 billion in 2025 and estimated to grow from USD 192.82 billion in 2026 to reach USD 234.06 billion by 2031, at a CAGR of 3.95% during the forecast period (2026-2031).
This expansion occurs as policy-backed demand for low-carbon molecules displaces fossil-derived supply, accelerating investment in electrolysis and carbon-capture retrofits. Regulatory mechanisms such as the European Union's Renewable Fuels of Non-Biological Origin (RFNBO) rules and the United States' Section 45V production tax credit turn voluntary decarbonization efforts into compliance obligations, giving the hydrogen generation market a predictable revenue base. Technology costs reset as renewable electricity prices fall and electrolyzer gigafactories scale while carbon-pricing regimes widen the cost gap between grey and clean molecules. Simultaneously, industrial sectors-including steel, ammonia, and methanol-lock in long-term offtake contracts that de-risk gigawatt-scale projects and diversify the hydrogen generation market beyond its historical refinery focus.
Global Hydrogen Generation Market Trends and Insights
EU RFNBO mandate igniting certified green hydrogen demand
The RFNBO framework obliges refineries, chemical plants, and steelmakers to source verified renewable hydrogen, turning green molecules into compliance commodities. The inaugural €720 million auction narrowed the cost gap between fossil-based and renewable supply, enabling final investment decisions for gigawatt-scale electrolyzer arrays. Certification rules on additionality and temporal correlation differentiate premium product grades and trigger dedicated renewable PPAs. Utilities such as EWE are installing a 280 MW electrolyzer linked to onshore wind parks, with commissioning slated for 2027. Structured offtake contracts underpin project finance and give equipment vendors multi-year order visibility.
U.S. Section 45V tax credit accelerating domestic electrolyzer build-out
Finalized in January 2025, Section 45V grants up to USD 3 per kilogram for hydrogen produced below 4 kg CO2-e/kg, instantly moving many U.S. projects into the money. The three-tier incentive rewards hourly renewable matching, fostering grid-scale storage and advanced energy-management systems. Nel ASA secured federal funding to expand its Mississippi electrolyzer plant, while Plug Power landed a 3 GW equipment order for an Australian green ammonia scheme, demonstrating the global manufacturing scale driven by U.S. policy. Ten-year credit certainty unlocks long-dated PPAs, though developers model political-change scenarios to hedge downside risk.
Scarcity of tier-1 renewable PPAs for GW electrolysis
Only a small fraction of Europe's 130 GW electrolyzer pipeline has locked financing because developers cannot secure long-duration renewable PPAs at competitive prices. Data centers, EV charging networks, and traditional industry chase the same certified power, cutting into hydrogen project margins. Germany's nationwide hydrogen trunkline tariff of €25 per kWh and the Netherlands' 4% green-use mandate further elevate PPA premiums. Unless offshore wind auctions accelerate, many projects will slip beyond 2027, compressing the short-term delivery schedule.
Other drivers and restraints analyzed in the detailed report include:
- China's coal-to-hydrogen blending policy maintaining legacy volumes
- Middle East ammonia hubs catalyzing GW-scale export projects
- Gulf-Coast water stress constraining PEM roll-outs
For complete list of drivers and restraints, kindly check the Table Of Contents.
Segment Analysis
Grey hydrogen supplied 97.21% of global demand in 2025, cementing the historical reliance on steam methane reforming and coal gasification. That dominance masks the breakout trajectory of electrolytic supply, with green volumes projected to climb at a 32.6% CAGR by 2031. This surge shifts procurement patterns as compliance-driven customers carve out renewable-only contract pools. The hydrogen generation market size for green output is expected to expand most in Europe and North America, where policy incentives offset higher levelized costs. Legacy asset owners retrofit carbon capture on select plants to secure low-carbon certificates, while project developers bundle renewable PPAs and pipeline access into long-term supply contracts.
Blue hydrogen is an interim bridge, particularly in gas-rich regions that can leverage depleted reservoirs for CO2 storage. Turquoise pathways, producing solid carbon coproducts, attract venture funding but remain pre-commercial. Pink hydrogen retains a niche among countries with high nuclear capacity and limited renewable land availability, giving utilities a baseload decarbonization option without intermittency risk. Each pathway's maturation timeline influences investment sequencing, creating optionality for diversified portfolios within the hydrogen generation market.
The Hydrogen Generation Market Report is Segmented by Source (Grey Hydrogen, Blue Hydrogen, Green Hydrogen, and Others), Technology (Steam Methane Reforming, Coal Gasification, Electrolysis, and Others), Application (Oil Refining, Chemical Processing, Iron and Steel, Transportation Fuel, Power and Energy Storage, and Others), and Geography (North America, Europe, Asia-Pacific, South America, and Middle East and Africa).
Geography Analysis
Asia-Pacific controlled 54.08% of global revenue in 2025, anchored by China's extensive coal-gasification fleet and accelerated electrolyzer uptake. Beijing's dual-track model sustains existing grey output while underwriting the world's largest dedicated hydrogen pipeline between Inner Mongolia and coastal industrial zones. India's National Green Hydrogen Mission, backed by viability-gap funding and import-duty waivers on electrolyzer stacks, positions the country as the next big growth frontier. High-solar-irradiance ASEAN nations, notably Indonesia and Malaysia, develop export-oriented ammonia corridors linked to Japanese and Korean buyers.
Europe ranks second in market size but first in policy intensity. RFNBO quotas, a €24 billion German backbone pipeline, and hydrogen-based steel ventures like HYBRIT move the region toward large-scale clean-molecule adoption. Project bottlenecks stem largely from scarce low-cost renewable PPAs, although accelerated offshore-wind auction schedules aim to unlock additional capacity. Nordic hydropower gives Scandinavian electrolyzer projects a stable, low-carbon electricity supply, lowering delivered-hydrogen costs relative to continental peers.
North America benefits from Section 45V incentives, abundant wind-solar resources, and established industrial clusters along the Gulf Coast and Midwest. Canadian carbon-pricing policies and hydro-rich provinces support export-grade clean-ammonia projects targeting Asia and Europe. Water stewardship and permitting timelines remain the key gating items for U.S. developers, especially in arid Western states. The Middle East develops GW-scale integrated hubs in Saudi Arabia, Oman, and the United Arab Emirates, using competitive renewables to ship green ammonia along existing tanker routes. Africa's nascent pipeline focuses on Namibia and Mauritania, where world-class solar resources, land availability, and EU proximity combine to attract early-stage capital.
- Linde plc
- Air Liquide
- Air Products & Chemicals
- Sinopec
- Engie SA
- Nel ASA
- Cummins Inc.
- ITM Power plc
- Plug Power Inc.
- Siemens Energy AG
- McPhy Energy SA
- FuelCell Energy
- Enapter AG
- Bloom Energy
- Ballard Power Systems
- Johnson Matthey PLC
- Kawasaki Heavy Industries
- Messer Group GmbH
- Taiyo Nippon Sanso Corp.
- Doosan Fuel Cell
Additional Benefits:
- The market estimate (ME) sheet in Excel format
- 3 months of analyst support
TABLE OF CONTENTS
1 Introduction
- 1.1 Study Assumptions & Market Definition
- 1.2 Scope of the Study
2 Research Methodology
3 Executive Summary
4 Market Landscape
- 4.1 Market Overview
- 4.2 Market Drivers
- 4.2.1 EU RFNBO Mandate Accelerating Green Hydrogen Off-take Agreements
- 4.2.2 IRA & U.S. Section 45V Tax Credits Boosting Domestic Electrolyser Build-out
- 4.2.3 China's Coal-to-Hydrogen Blending Policy Sustaining Grey & Blue Projects
- 4.2.4 Middle-East Ammonia Export Hubs Creating Demand for GW-scale Green Hydrogen
- 4.2.5 Nordic Steelmakers' HySustain Programs
- 4.2.6 Japan-Australia Liquefied Hydrogen Supply-chain (HESC)
- 4.3 Market Restraints
- 4.3.1 Scarcity of Tier-1 Renewable PPAs for GW-scale Electrolysis in Europe
- 4.3.2 U.S. Gulf-Coast Water-Stress Constraints on PEM Deployment
- 4.3.3 High CO2 Capture Costs for Existing SMR Units in South Korea
- 4.3.4 Limited Hydrogen Pipeline Codes & Safety Permits in Caribbean Islands
- 4.4 Supply-Chain Analysis
- 4.5 Regulatory Landscape
- 4.6 Technological Outlook
- 4.7 Porter's Five Forces Analysis
- 4.7.1 Bargaining Power of Suppliers
- 4.7.2 Bargaining Power of Buyers
- 4.7.3 Threat of New Entrants
- 4.7.4 Threat of Substitutes
- 4.7.5 Intensity of Competitive Rivalry
5 Market Size & Growth Forecasts
- 5.1 By Source
- 5.1.1 Grey Hydrogen
- 5.1.2 Blue Hydrogen
- 5.1.3 Green Hydrogen
- 5.1.4 Turquoise Hydrogen
- 5.1.5 Pink Hydrogen
- 5.2 By Technology
- 5.2.1 Steam Methane Reforming (SMR)
- 5.2.2 Coal Gasification
- 5.2.3 Auto-Thermal Reforming (ATR)
- 5.2.4 Partial Oxidation (POX)
- 5.2.5 Electrolysis (Alkaline Electrolysis, Proton Exchange Membrane (PEM), Solid Oxide Electrolysis (SOE))
- 5.3 By Application
- 5.3.1 Oil Refining
- 5.3.2 Chemical Processing (Ammonia, Methanol)
- 5.3.3 Iron and Steel (DRI, H2-BF)
- 5.3.4 Transportation Fuel (FCEV, Marine, Aviation)
- 5.3.5 Power and Energy Storage
- 5.3.6 Residential and Commercial Heating
- 5.4 By Geography
- 5.4.1 North America
- 5.4.1.1 United States
- 5.4.1.2 Canada
- 5.4.1.3 Mexico
- 5.4.2 Europe
- 5.4.2.1 United Kingdom
- 5.4.2.2 Germany
- 5.4.2.3 France
- 5.4.2.4 Spain
- 5.4.2.5 Nordics
- 5.4.2.6 Turkey
- 5.4.2.7 Russia
- 5.4.2.8 Rest of Europe
- 5.4.3 Asia-Pacific
- 5.4.3.1 China
- 5.4.3.2 India
- 5.4.3.3 Japan
- 5.4.3.4 South Korea
- 5.4.3.5 ASEAN Countries
- 5.4.3.6 Australia
- 5.4.3.7 Rest of Asia-Pacific
- 5.4.4 South America
- 5.4.4.1 Brazil
- 5.4.4.2 Argentina
- 5.4.4.3 Rest of South America
- 5.4.5 Middle East and Africa
- 5.4.5.1 United Arab Emirates
- 5.4.5.2 Saudi Arabia
- 5.4.5.3 Egypt
- 5.4.5.4 South Africa
- 5.4.5.5 Rest of Middle East and Africa
- 5.4.1 North America
6 Competitive Landscape
- 6.1 Market Concentration
- 6.2 Strategic Moves (M&A, Partnerships, PPAs)
- 6.3 Market Share Analysis (Market Rank/Share for key companies)
- 6.4 Company Profiles (includes Global level Overview, Market level overview, Core Segments, Financials as available, Strategic Information, Products & Services, and Recent Developments)
- 6.4.1 Linde plc
- 6.4.2 Air Liquide
- 6.4.3 Air Products & Chemicals
- 6.4.4 Sinopec
- 6.4.5 Engie SA
- 6.4.6 Nel ASA
- 6.4.7 Cummins Inc.
- 6.4.8 ITM Power plc
- 6.4.9 Plug Power Inc.
- 6.4.10 Siemens Energy AG
- 6.4.11 McPhy Energy SA
- 6.4.12 FuelCell Energy
- 6.4.13 Enapter AG
- 6.4.14 Bloom Energy
- 6.4.15 Ballard Power Systems
- 6.4.16 Johnson Matthey PLC
- 6.4.17 Kawasaki Heavy Industries
- 6.4.18 Messer Group GmbH
- 6.4.19 Taiyo Nippon Sanso Corp.
- 6.4.20 Doosan Fuel Cell
7 Market Opportunities & Future Outlook
- 7.1 White-Space & Unmet-Need Assessment
 氢气生产市场:按类型、生产方法、原料、产品、应用和终端用户产业划分-2026-2032年全球市场预测
 2034年海上氢气生产市场预测-全球生产技术、生产形式、能源来源、储存方式、应用、最终用户与区域分析氢燃料涡轮机市场预测至2034年-全球分析(按涡轮机类型、设计类型、容量、氢燃料成分、应用、最终用户、通路和地区划分)
 2026年全球沼气氢气生产市场报告
 全球氢气生产市场规模、份额、趋势和成长分析报告(2026-2034年)
 氢气生产市场规模、份额、趋势及预测(按技术、应用、系统类型及地区划分,2026-2034年)2026年全球氢气生产市场报告
 氢气生产市场规模、份额和趋势分析报告:按技术、系统、应用、地区和细分市场预测,2026-2033年
 蒸气重组(SMR)市场规模、份额和成长分析(按原料、重整技术、终端用户产业、营运规模和地区划分)-2026-2033年产业预测日本氢气生产市场规模、份额、趋势及预测(按技术、系统类型、应用和地区划分,2026-2034年)