


 |
市场调查报告书
商品编码
1911417
欧洲电动货运自行车市场-份额分析、产业趋势与统计、成长预测(2026-2031)Europe E-Cargo Bike - Market Share Analysis, Industry Trends & Statistics, Growth Forecasts (2026 - 2031) |
||||||
※ 本网页内容可能与最新版本有所差异。详细情况请与我们联繫。
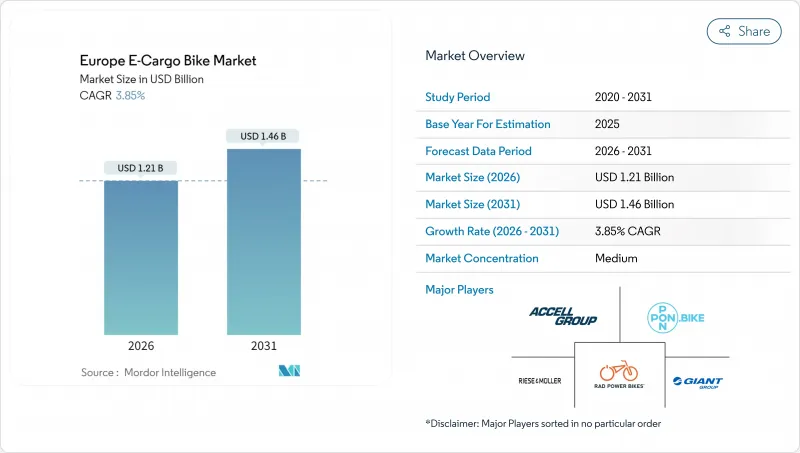
欧洲电动货运自行车市场预计到 2026 年价值 12.1 亿美元,高于 2025 年的 11.6 亿美元,预计到 2031 年将达到 14.6 亿美元,2026 年至 2031 年的复合年增长率为 3.85%。
这项展望反映了成熟的需求曲线,其中有利的法规、锂离子电池成本的下降以及城市物流的重组持续推动电动自行车的普及,而没有出现最初的激增。城市层面的零排放配送区、慷慨的商用车补贴以及密集的微型仓配网络共同增强了电动自行车的商业价值,而每千瓦时每美元电池价格的大幅下降则消除了关键的成本障碍。市场竞争强度仍适中。虽然成熟的自行车品牌利用垂直整合和服务网络,但随着采购活动转向线上,以数位化为先导的新兴参与企业正在施加价格压力。同时,细分市场趋势表明,在西欧主要大都市地区,助力驱动系统、锂离子电池、中置马达以及中高端价格区间构成了主流商用电动自行车的配置标准。
欧洲电动货运自行车市场趋势与洞察
城市物流零排放法规
欧洲各城市正稳步扩大零排放配送区,迫使物流业者重新评估车辆的经济效益。阿姆斯特丹自2025年起禁止石化燃料货车进入市中心,这项禁令促使领先购买电动货运自行车。伦敦的超低排放区对柴油货车征收每日收费,一旦费用超过阈值,电动货运自行车的整体拥有成本优势就会显着增强。德国、法国和荷兰的监管协调进一步放大了这些成本讯号,例如亚马逊物流等泛欧车队已将柏林、巴黎和米兰的微型交通枢纽作为标准化营运中心。随着越来越多的城市公布逐步淘汰内燃货车的计划,营运商将欧洲电动货运自行车市场视为一种合规措施,以保持跨辖区路线的柔软性。
商用电动货车补贴
目前,国家和地方政府的奖励计画主要针对企业买家而非消费者。德国的BAFA计画可报销高达25%的采集费用,并可与地方政府补贴迭加以提高补贴比例。法国5,500万欧元(约6,400万美元)的自行车投资基金正在扩大对商用电动货运车队的津贴。荷兰大幅提高了货运自行车以及中小企业的税额扣抵。这些激励措施缩短了高使用率服务的投资回收期,也解释了为什么企业买家在西欧的订单中占据主导地位。
缺乏路边充电设施
欧洲大多数城市缺乏专用于商用电动货运自行车的街道充电桩,迫使车队营运商依赖车库进行营运。在车库中,一个4安培的充电器充满800瓦时的电池可能需要长达六个小时,这不仅增加了场地成本,也造成了运作损失。由于缺乏开放标准,混合车队不得不安装来自不同供应商的专用充电桩,这进一步加重了资金压力。这种差距在南欧主要城市(马德里、罗马和雅典)尤为突出,这些城市的共用微出行政策专注于Scooter,而忽略了商用货运自行车。除非市政委员会强制要求在卸货区设置街道充电桩,否则希望进入欧洲电动货运自行车市场的Start-Ups新创公司将继续难以突破试点车队的局限,扩大规模。
细分市场分析
截至2025年,脚踏辅助驱动系统占了欧洲电动货运自行车市场92.58%的份额。这是因为根据欧盟第168/2013号法规,它们被归类为自行车,因此无需缴纳机动车保险和办理牌照手续。监管的确定性让企业安心,促使企业采购部门在主流小包裹递送领域坚持选择此类产品,其平均负载容量约为120公斤。随着大型快递公司对其车辆进行标准化,以最大限度地减少培训和合规负担,预计欧洲脚踏辅助电动货运自行车市场规模将稳定成长。
然而,油门辅助系统预计将以4.35%的复合年增长率成长。这是因为运输食品、家具和城市废弃物等重物需要持续的动力,而这种动力并不依赖驾驶员的体力。德国、法国和义大利已将时速25公里以下的车辆动力等级定义标准化,使得车队管理者能够在不增加责任责任险的情况下引入油门辅助车辆。因此,製造商正在推出双模式控制器,允许营运商切换合规等级,使其车辆能够适应不断变化的城市法规。
到2025年,锂离子电池技术将占据欧洲电动货运自行车市场89.65%的份额,年复合成长率达4.02%,这主要得益于千瓦时电价的大幅下降。电池组的使用寿命已达到足以满足企业车队更新週期要求的完整循环次数。磷酸铁锂电池(LFP)凭藉其固有的热稳定性和卓越的循环耐久性占据了市场主导地位,而这些特性对于大量宅配业务至关重要。
铅酸电池目前仅用于入门级消费级货运自行车,而这类自行车的购置价格往往高于总拥有成本。固态电池原型机虽然备受关注,但距离具备商业性成本竞争力仍需四年。同时,原始设备製造商(OEM)的重点正转向智慧电池管理系统,该系统具备电池单元级监控、蓝牙诊断和地理锁定防盗功能,旨在提高车队转售时的残值。
轮毂式马达目前仍占55.72%的市场份额,但预计到2031年,中置马达的复合年增长率将达到5.05%,超过市场平均。与自行车变速箱整合后实现的扭矩放大效应在里斯本和里昂众多陡峭的道路上尤为实用。 BoschPerformance Line CX Cargo马达可产生85牛顿米的扭矩,让200公斤的货物能够轻鬆驶上坡道,而不会让骑乘者感到吃力。
过去,维护的复杂性是购买的一大障碍,但不断扩展的服务网路和预测性诊断应用程式正在减少停机时间。一些车队营运商现在认为,轮毂式马达和中置马达的总拥有成本在第二年后大致相当,而那些采取务实策略的营运商正越来越多地转向后者。
其他福利:
- Excel格式的市场预测(ME)表
- 分析师支持(3个月)
目录
第一章 引言
- 研究假设和市场定义
- 调查范围
第二章调查方法
第三章执行摘要
第四章:主要产业趋势
- 年度自行车销售额
- 平均销售价格和价格范围构成
- 电动自行车及其零件的跨境贸易(进口/出口)
- 电动自行车在自行车总销量中所占的百分比
- 单程通勤距离 5-15 公里的通勤者 (%)
- 自行车和电动式自行车租赁市场规模
- 电动自行车电池组价格
- 电池化学价格比较
- 最后一公里(超本地化)配送量
- 受保护的自行车道(公里)
- 电动自行车电池容量(瓦时)
- 都市交通壅塞指数
- 法律规范
- 电动自行车的型式认可和认证
- 进出口和贸易法规
- 分类、道路使用和使用者规定
- 电池、充电器和充电安全
第五章 市场情势
- 市场概览
- 市场驱动因素
- 城市物流强制零排放
- 商用电动货车补贴
- 电池单价(美元/度)大幅下降(低于100欧元)
- 高密度微型仓配网路的成长
- 企业ESG采购目标
- 低速电动车的保险优惠
- 市场限制
- 缺乏路边充电设施
- 负载容量与续航里程的权衡(与厢型车相比)
- 零件标准碎片化
- 中置驱动系统熟练技工短缺
- 价值/供应链分析
- 技术展望
- 波特五力模型
- 新进入者的威胁
- 供应商的议价能力
- 买方的议价能力
- 替代品的威胁
- 竞争对手之间的竞争
第六章 市场规模及成长预测(数量及规模)
- 依推进类型
- 踏板辅助
- 油门辅助
- 依电池类型
- 铅酸电池
- 锂离子电池
- 其他的
- 按下马达安装位置
- 轮毂(前/后)
- 中置马达
- 透过驱动系统
- 链传动
- 皮带传动
- 透过马达输出
- 小于250瓦
- 251-350 W
- 351-500 W
- 501-600 W
- 600瓦或以上
- 按价格范围
- 低于1000美元
- 1,000-1,499 美元
- 1500-2499美元
- 2,500-3,499 美元
- 3,500-5,999 美元
- 超过6000美元
- 按销售管道
- 在线的
- 离线
- 按最终用途
- 商业航运
- 零售和商品分销
- 食品和饮料配送
- 服务供应商
- 其他的
- 商业航运
- 按地区
- 西欧
- 德国
- 法国
- 英国
- 荷兰
- 比利时
- 卢森堡
- 南欧
- 义大利
- 西班牙
- 葡萄牙
- 希腊
- 北欧的
- 丹麦
- 瑞典
- 挪威
- 芬兰
- 东欧
- 波兰
- 捷克共和国
- 匈牙利
- 斯洛伐克
- 瑞士
- 其他欧洲地区
- 西欧
第七章 竞争情势
- 市场集中度
- 策略趋势
- 市占率分析
- 公司简介
- Accell Group
- Bakfiets.nl
- CUBE Bikes
- Douze Factory SAS
- Giant Manufacturing Co. Ltd.
- Pon Holdings BV(incl. Urban Arrow)
- Rad Power Bikes Inc.
- Riese & Muller GmbH
- RYTLE GmbH
- Yubabikes Inc.
- Tern Bicycles
- Benno Bikes
- Larry vs Harry
- Butchers & Bicycles(EventyrCykler)
- Triobike A/S
- CARLA CARGO Engineering GmbH
- ONOMOTION GmbH
第八章:市场机会与未来展望
- 閒置频段与未满足需求评估
第九章:CEO们需要思考的关键策略问题
The Europe e-cargo bike market size in 2026 is estimated at USD 1.21 billion, growing from 2025 value of USD 1.16 billion with 2031 projections showing USD 1.46 billion, growing at 3.85% CAGR over 2026-2031.
This outlook captures a maturing demand curve in which supportive regulation, falling lithium-ion battery costs, and urban logistics restructuring continue to nudge adoption forward without the explosive jumps seen in earlier years. City-level zero-emission delivery zones, generous commercial fleet subsidies, and dense micro-fulfillment networks collectively reinforce the business case, while the rapid drop in battery USD/kWh has erased a key cost barrier. Competitive intensity remains moderate: established bicycle brands leverage vertical integration and service networks, yet digital-first entrants add pricing pressure as procurement shifts online. Meanwhile, segment dynamics reveal that pedal-assisted drivetrains, lithium-ion batteries, mid-drive motors, and mid-premium price points define the mainstream commercial specification across Western European hubs.
Europe E-Cargo Bike Market Trends and Insights
Urban-Logistics Zero-Emission Mandates
European municipalities are steadily enlarging zero-emission delivery zones, forcing logistics operators to reassess vehicle economics. Amsterdam's ban on fossil-fuel vans inside the city core from 2025 has already triggered forward purchases of e-cargo bikes. London's Ultra Low Emission Zone exposes diesel vans to daily fees that can surpass a threshold that tilts total cost of ownership decisively toward electrically assisted cargo cycles. Regulatory convergence across Germany, France, and the Netherlands compounds these cost signals, prompting pan-European fleets such as Amazon Logistics to standardize on micromobility depots in Berlin, Paris, and Milan. As more cities publish phase-out timelines for internal-combustion vans, operators view the Europe e-cargo bike market as a compliance hedge that preserves route flexibility across jurisdictions.
Subsidies for Commercial E-Cargo Fleets
National and municipal incentive programs now target business buyers rather than consumers. Germany's BAFA scheme reimburses up to 25% of acquisition cost and can be stacked with local grants that raise subsidy coverage. France's EUR 55 million (~USD 64 million) bicycle investment fund extends grants to commercial e-cargo fleets . The Netherlands adds significant cargo bike plus tax deductions for small enterprises. These incentives compress payback periods for high-utilization services, explaining why corporate buyers dominate order books in Western Europe.
Limited Secure On-Street Charging
Most European cities lack purpose-built curbside chargers for commercial e-cargo cycles. Fleet operators therefore tether operations to depots, incurring real-estate and downtime costs when 800 Wh batteries require up to six hours for a full cycle on 4 A chargers. The absence of open standards forces mixed fleets to install proprietary docks from multiple vendors, straining capital budgets. Southern European hubs-Madrid, Rome, Athens-show the largest gaps because shared micromobility policies focus on scooters rather than commercial cargo bikes. Until city councils mandate curbside charging in loading bays, scaling above pilot fleets remains arduous for courier start-ups eyeing the Europe e-cargo bike market.
Other drivers and restraints analyzed in the detailed report include:
- Rapid Drop in Battery USD/KWH Below EUR 100
- Dense Micro-Fulfilment Network Growth
- Payload and Range Trade-Offs Versus Vans
For complete list of drivers and restraints, kindly check the Table Of Contents.
Segment Analysis
Pedal-assisted drivetrains held 92.58% of the Europe e-cargo bike market share in 2025, reflecting their classification as bicycles under EU Regulation 168/2013, which exempts them from motor-vehicle insurance and licensing. The comfort of regulatory certainty keeps corporate buyers entrenched in this category for mainstream parcel delivery, where average loads hover near 120 kg. The Europe e-cargo bike market size for pedal assist is set to grow steadily as large couriers standardize fleets to minimize training and compliance overhead.
Throttle-assisted alternatives will, however, clock a 4.35% CAGR because heavy grocery, furniture, and municipal waste applications require continuous power unaffected by rider stamina. As Germany, France, and Italy align power-class definitions up to 25 km/h, fleet managers can integrate throttle-assisted units without increasing liability insurance lines. Manufacturers accordingly release dual-mode controllers that let operators toggle between compliance classes, future-proofing assets against evolving city statutes.
Lithium-ion technology captured 89.65% share of the Europe e-cargo bike market size in 2025 and continues rising at a 4.02% CAGR as kilowatt-hour costs freefall. Pack lifespans now reach significant full cycles, aligning with corporate fleet replacement timelines. LFP chemistry absorbs most volume due to intrinsic thermal stability and a notable cycle durability, a critical trait for high-turnover courier missions.
Lead-acid persists only in entry-level consumer cargo bikes where purchase price trumps total cost of ownership. Solid-state prototypes attract headlines but remain four years from commercial costing parity. In the interim, OEM focus shifts to smart battery management systems with cell-level monitoring, Bluetooth diagnostics, and geofenced immobilization-capabilities that enhance residual value at fleet resale.
Hub motors still hold 55.72% share yet mid-drive units will grow above the market at 5.05% CAGR through 2031. The torque multiplication afforded by integrating with bicycle gearing proves invaluable on gradients common in Lisbon or Lyon. Bosch's Performance Line CX Cargo motor delivers 85 Nm, enabling 200 kg payload starts on inclines without rider strain .
Higher maintenance complexity once deterred buyers, but expanding service networks and predictive diagnostic apps reduce downtime. Some fleet operators now benchmark hub versus mid-drive total cost of ownership at near parity after year two, tipping the specification mix toward the latter for utility-intensive routes.
The Europe E-Cargo Bike Market Report is Segmented by Propulsion Type (Pedal Assisted, Throttle Assisted), Battery Type (Lead Acid Battery, Lithium-Ion Battery, and More), Motor Placement (Hub (Front/Rear), Mid-Drive), Drive Systems (Chain Drive, Belt Drive), Motor Power (Below 250W, 251-350W, and More), Price Band, Sales Channel, End Use, and Geography. The Market Forecasts are Provided in Terms of Value (USD) and Volume (Units).
List of Companies Covered in this Report:
- Accell Group
- Bakfiets.nl
- CUBE Bikes
- Douze Factory SAS
- Giant Manufacturing Co. Ltd.
- Pon Holdings B.V. (incl. Urban Arrow)
- Rad Power Bikes Inc.
- Riese & Muller GmbH
- RYTLE GmbH
- Yubabikes Inc.
- Tern Bicycles
- Benno Bikes
- Larry vs Harry
- Butchers & Bicycles (EventyrCykler)
- Triobike A/S
- CARLA CARGO Engineering GmbH
- ONOMOTION GmbH
Additional Benefits:
- The market estimate (ME) sheet in Excel format
- 3 months of analyst support
TABLE OF CONTENTS
1 Introduction
- 1.1 Study Assumptions & Market Definition
- 1.2 Scope of the Study
2 Research Methodology
3 Executive Summary
4 Key Industry Trends
- 4.1 Annual Bicycle Sales
- 4.2 Average Selling Price & Price-Band Mix
- 4.3 Cross-Border Trade in E-Bikes & Parts (Imports/Exports)
- 4.4 E-Bike Share of Total Bicycle Sales
- 4.5 Commuters with 5-15 km One-Way Trips (%)
- 4.6 Bicycle/E-Bike Rental Market Size
- 4.7 E-Bike Battery Pack Price
- 4.8 Battery Chemistry Price Comparison
- 4.9 Last-Mile (Hyper-Local) Delivery Volume
- 4.10 Protected Bicycle Lanes (km)
- 4.11 E-Bike Battery Capacity (Wh)
- 4.12 Urban Traffic Congestion Index
- 4.13 Regulatory Framework
- 4.13.1 Homologation & Certification of E-Bicycles
- 4.13.2 Export-Import and Trade Regulation
- 4.13.3 Classification, Road Access and User Rules
- 4.13.4 Battery, Charger and Charging Safety
5 Market Landscape
- 5.1 Market Overview
- 5.2 Market Drivers
- 5.2.1 Urban-Logistics Zero-Emission Mandates
- 5.2.2 Subsidies for Commercial E-Cargo Fleets
- 5.2.3 Rapid Drop in Battery USD/KWH Below EUR 100
- 5.2.4 Dense Micro-Fulfilment Network Growth
- 5.2.5 Corporate ESG Procurement Targets
- 5.2.6 Insurance Incentives for Low-Speed EVs
- 5.3 Market Restraints
- 5.3.1 Limited Secure On-Street Charging
- 5.3.2 Payload and Range Trade-Offs Versus Vans
- 5.3.3 Fragmented Component Standards
- 5.3.4 Skilled-Mechanic Shortage for Mid-Drive Systems
- 5.4 Value / Supply-Chain Analysis
- 5.5 Technological Outlook
- 5.6 Porter's Five Forces
- 5.6.1 Threat of New Entrants
- 5.6.2 Bargaining Power of Suppliers
- 5.6.3 Bargaining Power of Buyers
- 5.6.4 Threat of Substitutes
- 5.6.5 Competitive Rivalry
6 Market Size & Growth Forecasts (Value & Volume)
- 6.1 By Propulsion Type
- 6.1.1 Pedal Assisted
- 6.1.2 Throttle Assisted
- 6.2 By Battery Type
- 6.2.1 Lead Acid Battery
- 6.2.2 Lithium-ion Battery
- 6.2.3 Others
- 6.3 By Motor Placement
- 6.3.1 Hub (Front/Rear)
- 6.3.2 Mid-drive
- 6.4 By Drive Systems
- 6.4.1 Chain Drive
- 6.4.2 Belt Drive
- 6.5 By Motor Power
- 6.5.1 Below 250 W
- 6.5.2 251-350 W
- 6.5.3 351-500 W
- 6.5.4 501-600 W
- 6.5.5 Above 600 W
- 6.6 By Price Band
- 6.6.1 Up to USD 1,000
- 6.6.2 USD 1,000-1,499
- 6.6.3 USD 1,500-2,499
- 6.6.4 USD 2,500-3,499
- 6.6.5 USD 3,500-5,999
- 6.6.6 Above USD 6,000
- 6.7 By Sales Channel
- 6.7.1 Online
- 6.7.2 Offline
- 6.8 By End Use
- 6.8.1 Commercial Delivery
- 6.8.1.1 Retail and Goods Delivery
- 6.8.1.2 Food and Beverage Delivery
- 6.8.2 Service Providers
- 6.8.3 Others
- 6.8.1 Commercial Delivery
- 6.9 By Geography
- 6.9.1 Western Europe
- 6.9.1.1 Germany
- 6.9.1.2 France
- 6.9.1.3 United Kingdom
- 6.9.1.4 Netherlands
- 6.9.1.5 Belgium
- 6.9.1.6 Luxembourg
- 6.9.2 Southern Europe
- 6.9.2.1 Italy
- 6.9.2.2 Spain
- 6.9.2.3 Portugal
- 6.9.2.4 Greece
- 6.9.3 Northern Europe
- 6.9.3.1 Denmark
- 6.9.3.2 Sweden
- 6.9.3.3 Norway
- 6.9.3.4 Finland
- 6.9.4 Eastern Europe
- 6.9.4.1 Poland
- 6.9.4.2 Czech Republic
- 6.9.4.3 Hungary
- 6.9.4.4 Slovakia
- 6.9.5 Switzerland
- 6.9.6 Rest of Europe
- 6.9.1 Western Europe
7 Competitive Landscape
- 7.1 Market Concentration
- 7.2 Strategic Moves
- 7.3 Market Share Analysis
- 7.4 Company Profiles (Includes Global Level Overview, Market Level Overview, Core Segments, Financials as Available, Strategic Information, Market Rank/Share for Key Companies, Products and Services, SWOT Analysis, and Recent Developments)
- 7.4.1 Accell Group
- 7.4.2 Bakfiets.nl
- 7.4.3 CUBE Bikes
- 7.4.4 Douze Factory SAS
- 7.4.5 Giant Manufacturing Co. Ltd.
- 7.4.6 Pon Holdings B.V. (incl. Urban Arrow)
- 7.4.7 Rad Power Bikes Inc.
- 7.4.8 Riese & Muller GmbH
- 7.4.9 RYTLE GmbH
- 7.4.10 Yubabikes Inc.
- 7.4.11 Tern Bicycles
- 7.4.12 Benno Bikes
- 7.4.13 Larry vs Harry
- 7.4.14 Butchers & Bicycles (EventyrCykler)
- 7.4.15 Triobike A/S
- 7.4.16 CARLA CARGO Engineering GmbH
- 7.4.17 ONOMOTION GmbH
8 Market Opportunities & Future Outlook
- 8.1 White-space & Unmet-need Assessment
9 Key Strategic Questions for E-Bikes CEOs
 2026年全球电动货运自行车市场报告
 全球电动货运自行车市场规模、份额、趋势和成长分析报告(2026-2034)
 电动货运自行车市场:按类型、负载容量、驱动系统、电池类型、电压、最终用户、应用和分销管道划分-2026-2032年全球市场预测
 电动货运自行车:市场占有率分析、产业趋势与统计、成长预测(2026-2031)
 电动货运自行车市场规模、份额和成长分析(按电池类型、推进方式、产品类型和地区划分)-2026-2033年产业预测
 全球电动货运自行车市场
 电动货物摩托车的全球市场:产品类型·电池类型·驱动方式·模式·距离·最高速度·负载容量·用途·不同地区的预测 (~2032年)
 全球电动货运自行车市场规模、份额、趋势分析报告:按距离、按应用、按类型、区域展望、预测,2024-2031 年