


 |
市场调查报告书
商品编码
1911743
电动货运自行车:市场占有率分析、产业趋势与统计、成长预测(2026-2031)E-Cargo Bike - Market Share Analysis, Industry Trends & Statistics, Growth Forecasts (2026 - 2031) |
||||||
※ 本网页内容可能与最新版本有所差异。详细情况请与我们联繫。
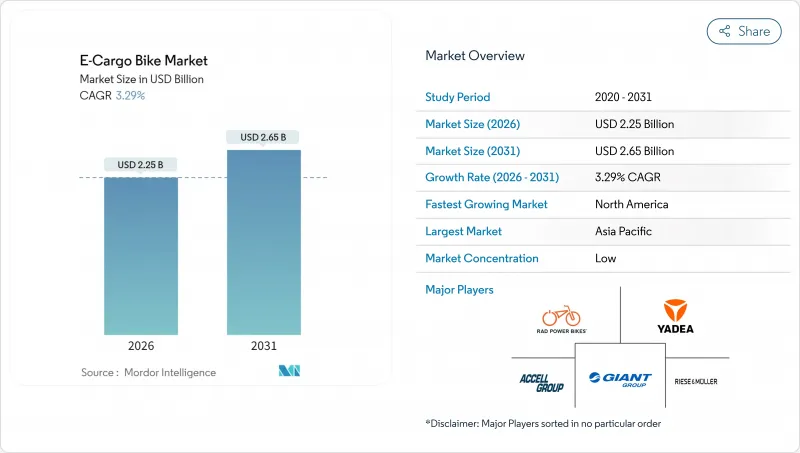
全球电动货运自行车市场预计将从 2025 年的 21.8 亿美元成长到 2026 年的 22.5 亿美元,预计到 2031 年将达到 26.5 亿美元,2026 年至 2031 年的复合年增长率为 3.29%。
这种稳定成长的趋势表明,电动货运自行车正从小众的微出行产品清晰地转型为商业物流基础设施的关键组成部分。电池成本的下降、快速的都市化以及日益严格的排放法规,共同缩小了电动货运自行车与传统货运自行车的总拥有成本 (TCO) 差距。随着都市区低排放区限制柴油货车进入市中心,车队营运商正转向电动货运解决方案,以避免拥堵费并满足范围 3 的排放报告义务。企业永续性目标正在加速电动货运自行车的普及,因为每辆投入使用的电动自行车都能带来显着的碳排放和噪音降低。同时,中置马达和整合式远端资讯处理系统等组件创新正在扩展商用货运自行车的功能,提高爬坡性能和车队运转率。
全球电动货运自行车市场趋势与洞察
最后一公里配送服务的成长
随着大城市货物密度持续上升,车队管理人员正在寻找能够快速穿梭于狭窄道路和装卸区的替代方案。物流业者表示,电动货运车辆在尖峰时段的配送速度比轻型货车更快,从而减少了日常停车罚款和拥堵费。亚马逊正在欧洲逐步大规模推广货运自行车,显示解决方案的征兆远不止于专业宅配公司。低排放区的扩张也推动了这一趋势,因为柴油车的准入费用通常高于电动货运车辆的日常营运成本。更快的配送速度、更低的罚款以及便利的都市区通行条件意味着电动货运自行车市场在大都会圈配送网路中持续扩张。
政府激励措施和补贴
财政激励措施可以简化车队管理的采购决策。美国联邦政府的税额扣抵涵盖符合条件的商用电动货运自行车的购买价格,而德国则为车辆购置提供补贴,并为充电基础设施建设提供资金。巴黎和哥本哈根等城市提供的补贴也辅以地方政府的退税,从而缩短了高运转率营运商的投资回收期。公车专用道优先通行权和车辆总重限制豁免等优惠政策,能够节省营运成本,进一步增强直接补贴带来的效益。
与传统货运自行车的初始成本比较
与传统的人力驱动货车相比,电动驱动系统显着提高了购买成本。中小企业的租赁选择有限,且无法透过节省燃料成本快速抵销资本支出。在许多城市,仍需达到相当长的每週运作时间才能达到收支平衡。金融机构正在推出针对轻型电动车队的资产支持型产品,但除欧洲和北美以外,其普及程度仍然有限。在资本市场成熟之前,前期成本可能会限製成本敏感地区的快速普及。
细分市场分析
到2025年,辅助骑乘系统将占据电动货运自行车市场86.62%的份额。这些系统符合欧洲和日本的法律标准,允许在骑乘者踩踏的情况下输出较高的峰值功率。这种法律上的明确性降低了车队所有者的保险和执照费用。扭力感测器系统日趋精密,能够根据负载容量和坡度调整功率输出,从而延长续航里程。由于北美地区放宽了功率限制,油门辅助系统正以4.12%的复合年增长率成长,但在欧洲主要城市仍面临严格的牌照限制。
需求趋势凸显了助力车辆为何将继续在城市物流领域占据主导地位。这项技术允许车辆在专用车道内持续行驶,无需遵守车辆法规。由于需要踩踏板,其平均消费量低于节气门车辆,从而延缓了途中充电的需求。在高密度配送网路中,这种效率,加上监管合规负担的减轻,最终转化为更低的总体拥有成本。
预计到2025年,锂离子电池组将占总出货量的72.58%,并在2031年之前保持3.62%的复合年增长率。能量密度的提升已突破250Wh/kg的关口,使得相同续航里程所需的电池组体积更小。电动车供应量的增加刺激了电动货车车架等次市场的发展,从而形成有利的价格趋势。磷酸锂铁(LFP)电池因其独特的化学特性,在锂电池领域正占据越来越大的份额。这种特性具有良好的热稳定性,受到消防安全监管机构和末端物流保险公司的青睐。
由于价格低廉,铅酸电池在亚洲入门级市场仍占有一席之地,车队营运商通常在两次更换週期后转向锂电池。锂电池更长的使用寿命减少了五年内的电池更换次数,即使在电价较高的地区,锂电池也具有总体拥有成本 (TCO) 优势。增强型电池管理系统整合了电池平衡和温度切断功能,提高了安全性并扩大了政府核准。
预计到2025年,中置马达自行车将占54.88%的市场份额,年复合成长率(CAGR)为3.84%,进一步扩大领先优势。由于马达直接与曲柄连接,扭矩透过自行车的传动系统得到放大,即使在陡坡和重载情况下也能保持动力。均衡的重量分配确保了即使负重也能安全过弯。轮毂式马达的优点在于平地行驶时能保持良好的牵引力,且维护成本略低,但反覆上坡骑乘时容易产生热量。
对于频繁启停且爬坡路段较短的城市路线,车队采购者通常选择中置马达车型。由于链条和齿轮负荷较大,保养週期会略短一些,但营运商愿意接受这种权衡,以换取更佳的驾驶性能和更低的每公里电池消费量。
区域分析
到2025年,亚太地区将占47.55%的收入份额,这主要得益于中国强大的供应商生态系统和日本在商用马达审批方面较为宽鬆的监管政策。当地的原始设备製造商(OEM)正在集中整合电池、马达和底盘,从而降低单位成本并缩短设计週期。因此,该地区既是生产中心,也是最大的单一需求中心,拥塞收费政策也促进了电动货运自行车的普及,尤其是在中国的主要城市。
北美将成为成长最快的地区,到2031年复合年增长率将达到6.95%。联邦税额扣抵、政府资助的自行车道网路以及消费者对当日送达服务日益增长的期望,都推动了强劲的需求。像UPS和FedEx这样的营运商正在公布排放数据,这给董事会带来了压力,促使他们从货车转向自行车运输。需求的驱动力不仅在于环保理念,还在于自行车在拥挤的城市中心带来的实际效益——过去,街头停车罚单将严重影响利润。
欧洲市场依然成熟,但仍蕴藏着不断成长的机会。统一的EN 15194认证简化了跨境车辆部署流程,阿姆斯特丹和柏林等城市允许电动货运自行车使用公车专用道以及零售店前的装卸货区域。清晰的监管环境和完善的基础设施正在推动市场稳步成长。南美和非洲等新兴市场虽然起步较晚,但随着融资管道的改善和当地组装厂降低进口关税,其成长速度可望加快。
其他福利:
- Excel格式的市场预测(ME)表
- 3个月的分析师支持
目录
第一章 引言
- 研究假设和市场定义
- 调查范围
第二章调查方法
第三章执行摘要
第四章 市场情势
- 市场概览
- 主要行业趋势
- 年度自行车销售额
- 平均销售价格和价格范围构成
- 电动自行车及其零件的跨境贸易(进口/出口)
- 电动自行车在自行车总销量中所占的百分比
- 单程通勤距离 5-15 公里的通勤者 (%)
- 自行车和电动式自行车租赁市场规模
- 电动自行车电池组价格
- 电池化学价格比较
- 最后一公里(超本地化)配送量
- 受保护的自行车道(公里)
- 电动自行车电池容量(瓦时)
- 都市交通壅塞指数
- 法律规范
- 电动自行车型式认证与认可
- 进出口和贸易法规
- 分类、道路使用和使用者规定
- 电池、充电器和充电安全
第五章 市场情势
- 市场概览
- 市场驱动因素
- 最后一公里配送服务的成长
- 政府激励措施和补贴
- 锂离子电池价格正在下降
- 扩大受保护的自行车基础设施
- 企业永续发展报告面临压力
- 利用远端资讯处理技术优化车队
- 市场限制
- 与传统货运自行车相比,初始成本较高
- 载货能力有限(与货车相比)
- 充电基础设施不足
- 零件标准碎片化
- 价值/供应链分析
- 监管环境
- 技术展望
- 波特五力模型
- 新进入者的威胁
- 供应商的议价能力
- 买方的议价能力
- 替代品的威胁
- 竞争对手之间的竞争
第六章 市场规模及成长预测(价值(美元)及销售量(单位))
- 依推进类型
- 踏板辅助
- 油门辅助
- 依电池类型
- 铅酸电池
- 锂离子电池
- 其他的
- 按下马达安装位置
- 轮毂(前/后)
- 中置马达
- 透过驱动系统
- 链传动
- 皮带传动
- 透过马达输出
- 小于250瓦
- 251-350 W
- 351-500 W
- 501-600 W
- 600瓦或以上
- 按价格范围
- 最高可达 1,000 美元
- 1,000-1,499 美元
- 1500-2499美元
- 2,500-3,499 美元
- 3,500-5,999 美元
- 超过6000美元
- 按销售管道
- 在线的
- 离线
- 按最终用途
- 商业航运
- 零售和商品分销
- 食品和饮料配送
- 服务供应商
- 其他的
- 商业航运
- 按地区
- 北美洲
- 美国
- 加拿大
- 墨西哥
- 南美洲
- 巴西
- 阿根廷
- 南美洲其他地区
- 欧洲
- 奥地利
- 比利时
- 丹麦
- 法国
- 德国
- 义大利
- 卢森堡
- 荷兰
- 挪威
- 波兰
- 西班牙
- 瑞典
- 瑞士
- 英国
- 其他欧洲地区
- 亚太地区
- 澳洲
- 中国
- 印度
- 日本
- 纽西兰
- 韩国
- 亚太其他地区
- 中东和非洲
- 沙乌地阿拉伯
- 阿拉伯聯合大公国
- 南非
- 其他中东和非洲地区
- 北美洲
第七章 竞争情势
- 市场集中度
- 策略趋势
- 市占率分析
- 公司简介
- Accell Group
- Aima Technology Group Co. Ltd
- Bakfiets.nl
- CUBE Bikes
- DOUZE Factory SAS
- Giant Manufacturing Co. Ltd
- Jiangsu Xinri E-Vehicle Co. Ltd
- Jinhua Jobo Technology Co.
- Pedego Electric Bikes
- Pon Holding BV
- Rad Power Bikes Inc.
- Riese & Muller GmbH
- RYTLE GmbH
- Tern Bicycles
- Xtracycle Cargo Bikes
- XYZ CARGO
- Yadea Group Holdings Ltd.
- Yubabikes Inc.
第八章:市场机会与未来展望
第九章:CEO们需要思考的关键策略问题
The global e-cargo bike market is expected to grow from USD 2.18 billion in 2025 to USD 2.25 billion in 2026 and is forecast to reach USD 2.65 billion by 2031 at 3.29% CAGR over 2026-2031.
This steady trajectory reflects a clear shift from niche micromobility product to a critical component of commercial logistics infrastructure. Declining battery costs, rapid urbanization, and stricter emissions rules combine to shrink the total cost of ownership gap with conventional cargo cycles. Municipal low-emission zones now block diesel vans from dense downtown cores, so fleet operators turn to e-cargo solutions to avoid congestion fees and meet Scope 3 reporting obligations. Corporate sustainability targets accelerate adoption because every deployed bike delivers a verifiable reduction in carbon and noise. At the same time, component innovation such as mid-drive motors and integrated telematics is expanding the functional envelope of commercial cargo cycling, improving hill-climbing performance and fleet uptime.
Global E-Cargo Bike Market Trends and Insights
Growth of Last-Mile Delivery Services
Package density in large cities keeps rising and pushes fleet managers toward alternatives that navigate narrow streets and loading zones with fewer delays. Logistics operators report that e-cargo units complete peak-hour routes quicker than light vans, cutting routine parking fines and congestion fees. Amazon deployed a significant number of cargo bikes across European countries over time, signaling that the solution now scales beyond courier specialists. Emerging low-emission zones reinforce the trend because diesel entry fees often exceed the daily operating cost of an e-cargo unit. Faster drop times, fewer fines, and urban access privileges ensure that the e-cargo bike market continues to expand within metropolitan fulfillment networks .
Government Incentives and Subsidies
Fiscal instruments make purchase decisions easier for fleet accountants. The United States federal tax credit covers the acquisition price for qualifying commercial cargo e-cycles, while Germany earmarks funds for fleet grants and charging hardware. Cities, including Paris and Copenhagen, layer local rebates on top, trimming the payback horizon for high-utilization operators. Preferential access to bus lanes and exemptions from gross vehicle-weight rules add operational savings that compound the effect of direct subsidies.
High Upfront Cost vs. Conventional Cargo Bikes
Electric drivetrains significantly increase the sticker price compared to traditional human-powered cargo frames. Small businesses often lack leasing options and cannot offset capital expenditure against fuel savings quickly. The break-even point still requires significant operating hours per week in many cities. Financial institutions are gradually rolling out asset-backed products for light electric fleets, but penetration remains limited outside Europe and North America. Until capital markets mature, upfront economics will check rapid diffusion in cost-sensitive regions.
Other drivers and restraints analyzed in the detailed report include:
- Declining Lithium-Ion Battery Prices
- Expansion of Protected Cycling Infrastructure
- Limited Payload Capacity Versus Vans
For complete list of drivers and restraints, kindly check the Table Of Contents.
Segment Analysis
Pedal-assist configurations controlled 86.62% of the 2025 e-cargo bike market. The format lines up with European and Japanese legal thresholds that allow higher peak output so long as the rider is pedaling. That legal clarity lowers insurance and license costs for fleet owners. Torque-sensor systems have become more refined, adjusting power delivery by load and gradient to extend range. Throttle-assist bikes are growing at a 4.12% CAGR as North American jurisdictions relax wattage caps, yet the mode still faces tighter licensing in core European cities.
Demand patterns underscore why pedal-assist remains the workhorse for urban logistics. The technology allows continuous operation inside protected lanes without triggering motor-vehicle rules. Because pedal input remains mandatory, average energy consumption is lower than throttle alternatives, delaying mid-route charging stops. For high-density courier networks, that efficiency combines with lighter regulatory compliance to protect the total cost of ownership.
Lithium-ion packs delivered 72.58% of total shipments in 2025 and will retain the crown through 2031 at 3.62% CAGR. Energy density gains now break the 250 Wh/kg barrier, which shrinks pack size for a given range. Rising volumes from electric automotive lines feed secondary markets such as e-cargo frames, driving a favorable pricing glide path. LFP variants are winning share within the lithium family because the chemistry provides thermal stability valued by fire-safety regulators and last-mile insurers.
Lead-acid holds a foothold in entry-level Asian markets due to its low sticker price, yet fleet operators usually migrate to lithium within two replacement cycles. Longer cycle life translates into fewer battery swaps over a five-year horizon, tipping total cost of ownership toward lithium even where electricity prices are high. Enhanced battery management systems now bundle cell-balancing and temperature cutoffs, raising safety credentials and unlocking broader municipal approvals.
Mid-drive layouts secured 54.88% market share in 2025 and should widen the gap by posting a 3.84% CAGR. With the motor linked directly to the crank, torque multiplies through the bicycle drivetrain, preserving power on steep grades and under heavy cargo loads. Balanced weight distribution also means safer cornering with a full load. Hub motors keep traction on flat terrain and carry marginally lower maintenance costs, but face heat build-up when ascending hills repeatedly.
Fleet buyers gravitate toward mid-drive packages for downtown routes that feature frequent stop-start and short but steep climbs. Service intervals are slightly shorter because chains and gears experience higher loads, yet operators accept this trade-off for superior ride dynamics and lower battery drain per kilometer.
The E-Cargo Bike Market Report is Segmented by Propulsion Type (Pedal Assisted, Throttle Assisted), Battery Type (Lead Acid Battery, Lithium-Ion Battery, and More), Motor Placement (Hub (Front/Rear), Mid-Drive), Drive Systems (Chain Drive, Belt Drive), Motor Power (Below 250W, 251-350W, and More), Price Band, Sales Channel, End Use, and Geography. The Market Forecasts are Provided in Terms of Value (USD) and Volume (Units).
Geography Analysis
Asia-Pacific controlled 47.55% revenue in 2025, thanks to deep supplier ecosystems in China and regulatory headroom in Japan that approves commercial motors. Local OEMs integrate battery, motor, and chassis under one roof, driving down unit cost and shortening design cycles. As a result, the region functions both as a production hub and as the largest single demand center, especially within tier-one Chinese cities where congestion charges now favor electric cargo cycles.
North America is the fastest riser with a 6.95% CAGR to 2031. Federal tax credits, city-funded bike lane networks, and growing consumer expectations for same-day delivery combine to create a strong pull. Operators such as UPS and FedEx openly publish emission dashboards, which adds board-level pressure to pivot from vans to bikes. The environmental narrative pairs with practical advantages in gridlocked downtown cores where curbside parking tickets once ate into profit margins.
Europe maintains a mature yet still expanding opportunity. Harmonized EN 15194 certification streamlines cross-border fleet deployment, and cities such as Amsterdam and Berlin grant e-cargo bikes access to bus lanes plus loading bays outside retail stores. The combination of regulation clarity and extensive infrastructure yields stable growth. Emerging markets in South America and Africa are starting from a low base but could pick up speed once credit facilities mature and local assembly plants lower import duties.
- Accell Group
- Aima Technology Group Co. Ltd
- Bakfiets.nl
- CUBE Bikes
- DOUZE Factory SAS
- Giant Manufacturing Co. Ltd
- Jiangsu Xinri E-Vehicle Co. Ltd
- Jinhua Jobo Technology Co.
- Pedego Electric Bikes
- Pon Holding B.V.
- Rad Power Bikes Inc.
- Riese & Muller GmbH
- RYTLE GmbH
- Tern Bicycles
- Xtracycle Cargo Bikes
- XYZ CARGO
- Yadea Group Holdings Ltd.
- Yubabikes Inc.
Additional Benefits:
- The market estimate (ME) sheet in Excel format
- 3 months of analyst support
TABLE OF CONTENTS
1 Introduction
- 1.1 Study Assumptions & Market Definition
- 1.2 Scope of the Study
2 Research Methodology
3 Executive Summary
4 Market Landscape
- 4.1 Market Overview
- 4.2 Key Industry Trends
- 4.2.1 Annual Bicycle Sales
- 4.2.2 Average Selling Price & Price-Band Mix
- 4.2.3 Cross-Border Trade in E-Bikes & Parts (Imports/Exports)
- 4.2.4 E-Bike Share of Total Bicycle Sales
- 4.2.5 Commuters with 5-15 km One-Way Trips (%)
- 4.2.6 Bicycle/E-Bike Rental Market Size
- 4.2.7 E-Bike Battery Pack Price
- 4.2.8 Battery Chemistry Price Comparison
- 4.2.9 Last-Mile (Hyper-Local) Delivery Volume
- 4.2.10 Protected Bicycle Lanes (km)
- 4.2.11 E-Bike Battery Capacity (Wh)
- 4.2.12 Urban Traffic Congestion Index
- 4.2.13 Regulatory Framework
- 4.2.13.1 Homologation & Certification of E-Bicycles
- 4.2.13.2 Export-Import and Trade Regulation
- 4.2.13.3 Classification, Road Access & User Rules
- 4.2.13.4 Battery, Charger & Charging Safety
5 Market Landscape
- 5.1 Market Overview
- 5.2 Market Drivers
- 5.2.1 Growth of Last-Mile Delivery Services
- 5.2.2 Government Incentives and Subsidies
- 5.2.3 Declining Lithium-Ion Battery Prices
- 5.2.4 Expansion of Protected Cycling Infrastructure
- 5.2.5 Corporate Sustainability Reporting Pressure
- 5.2.6 Telematics-Enabled Fleet Optimization
- 5.3 Market Restraints
- 5.3.1 High Upfront Cost vs. Conventional Cargo Bikes
- 5.3.2 Limited Payload Capacity Versus Vans
- 5.3.3 Gaps in Charging Infrastructure
- 5.3.4 Fragmented Component Standards
- 5.4 Value / Supply-Chain Analysis
- 5.5 Regulatory Landscape
- 5.6 Technological Outlook
- 5.7 Porter's Five Forces
- 5.7.1 Threat of New Entrants
- 5.7.2 Bargaining Power of Suppliers
- 5.7.3 Bargaining Power of Buyers
- 5.7.4 Threat of Substitutes
- 5.7.5 Competitive Rivalry
6 Market Size & Growth Forecasts (Value (USD) and Volume (Units))
- 6.1 By Propulsion Type
- 6.1.1 Pedal Assisted
- 6.1.2 Throttle Assisted
- 6.2 By Battery Type
- 6.2.1 Lead Acid Battery
- 6.2.2 Lithium-ion Battery
- 6.2.3 Others
- 6.3 By Motor Placement
- 6.3.1 Hub (Front/Rear)
- 6.3.2 Mid-Drive
- 6.4 By Drive Systems
- 6.4.1 Chain Drive
- 6.4.2 Belt Drive
- 6.5 By Motor Power
- 6.5.1 Below 250 W
- 6.5.2 251-350 W
- 6.5.3 351-500 W
- 6.5.4 501-600 W
- 6.5.5 Above 600 W
- 6.6 By Price Band
- 6.6.1 Up to USD 1,000
- 6.6.2 USD 1,000-1,499
- 6.6.3 USD 1,500-2,499
- 6.6.4 USD 2,500-3,499
- 6.6.5 USD 3,500-5,999
- 6.6.6 Above USD 6,000
- 6.7 By Sales Channel
- 6.7.1 Online
- 6.7.2 Offline
- 6.8 By End Use
- 6.8.1 Commercial Delivery
- 6.8.1.1 Retail and Goods Delivery
- 6.8.1.2 Food and Beverage Delivery
- 6.8.2 Service Providers
- 6.8.3 Others
- 6.8.1 Commercial Delivery
- 6.9 By Geography
- 6.9.1 North America
- 6.9.1.1 United States
- 6.9.1.2 Canada
- 6.9.1.3 Mexico
- 6.9.2 South America
- 6.9.2.1 Brazil
- 6.9.2.2 Argentina
- 6.9.2.3 Rest of South America
- 6.9.3 Europe
- 6.9.3.1 Austria
- 6.9.3.2 Belgium
- 6.9.3.3 Denmark
- 6.9.3.4 France
- 6.9.3.5 Germany
- 6.9.3.6 Italy
- 6.9.3.7 Luxembourg
- 6.9.3.8 Netherlands
- 6.9.3.9 Norway
- 6.9.3.10 Poland
- 6.9.3.11 Spain
- 6.9.3.12 Sweden
- 6.9.3.13 Switzerland
- 6.9.3.14 United Kingdom
- 6.9.3.15 Rest of Europe
- 6.9.4 Asia-Pacific
- 6.9.4.1 Australia
- 6.9.4.2 China
- 6.9.4.3 India
- 6.9.4.4 Japan
- 6.9.4.5 New Zealand
- 6.9.4.6 South Korea
- 6.9.4.7 Rest of Asia-Pacific
- 6.9.5 Middle East and Africa
- 6.9.5.1 Saudi Arabia
- 6.9.5.2 United Arab Emirates
- 6.9.5.3 South Africa
- 6.9.5.4 Rest of the Middle East and Africa
- 6.9.1 North America
7 Competitive Landscape
- 7.1 Market Concentration
- 7.2 Strategic Moves
- 7.3 Market Share Analysis
- 7.4 Company Profiles (Includes Global Level Overview, Market Level Overview, Core Segments, Financials as Available, Strategic Information, Market Rank/Share for Key Companies, Products and Services, SWOT Analysis, and Recent Developments)
- 7.4.1 Accell Group
- 7.4.2 Aima Technology Group Co. Ltd
- 7.4.3 Bakfiets.nl
- 7.4.4 CUBE Bikes
- 7.4.5 DOUZE Factory SAS
- 7.4.6 Giant Manufacturing Co. Ltd
- 7.4.7 Jiangsu Xinri E-Vehicle Co. Ltd
- 7.4.8 Jinhua Jobo Technology Co.
- 7.4.9 Pedego Electric Bikes
- 7.4.10 Pon Holding B.V.
- 7.4.11 Rad Power Bikes Inc.
- 7.4.12 Riese & Muller GmbH
- 7.4.13 RYTLE GmbH
- 7.4.14 Tern Bicycles
- 7.4.15 Xtracycle Cargo Bikes
- 7.4.16 XYZ CARGO
- 7.4.17 Yadea Group Holdings Ltd.
- 7.4.18 Yubabikes Inc.
8 Market Opportunities & Future Outlook
9 Key Strategic Questions for E-Bikes CEOs
 2026年全球电动货运自行车市场报告
 全球电动货运自行车市场规模、份额、趋势和成长分析报告(2026-2034)
 电动货运自行车市场:按类型、负载容量、驱动系统、电池类型、电压、最终用户、应用和分销管道划分-2026-2032年全球市场预测
 欧洲电动货运自行车市场-份额分析、产业趋势与统计、成长预测(2026-2031)
 电动货运自行车市场规模、份额和成长分析(按电池类型、推进方式、产品类型和地区划分)-2026-2033年产业预测
 全球电动货运自行车市场
 电动货物摩托车的全球市场:产品类型·电池类型·驱动方式·模式·距离·最高速度·负载容量·用途·不同地区的预测 (~2032年)
 全球电动货运自行车市场规模、份额、趋势分析报告:按距离、按应用、按类型、区域展望、预测,2024-2031 年