


 |
市场调查报告书
商品编码
1911470
北美垃圾袋:市占率分析、产业趋势与统计、成长预测(2026-2031)North America Trash Bags - Market Share Analysis, Industry Trends & Statistics, Growth Forecasts (2026 - 2031) |
||||||
※ 本网页内容可能与最新版本有所差异。详细情况请与我们联繫。
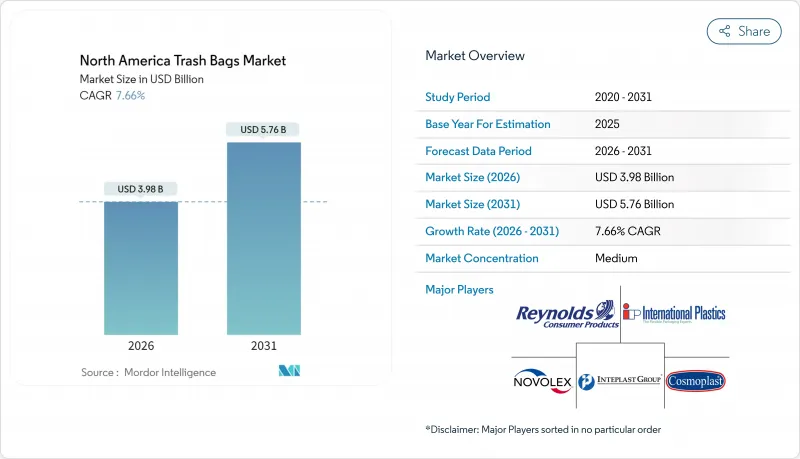
2025年北美垃圾袋市值为37亿美元,预计到2031年将达到57.6亿美元,高于2026年的39.8亿美元。
预计在预测期(2026-2031 年)内,复合年增长率将达到 7.66%。
市政垃圾处理量的持续成长、鼓励垃圾掩埋的监管奖励以及企业的零废弃政策,持续推动住宅、商业和工业领域对垃圾袋的需求。各州实行的按需计量型(PAYT)政策,尤其是在新英格兰地区,进一步推高了人均垃圾袋购买量。随着美国七个州实施生产者延伸责任制(EPR)法律,可生物降解和再生材料製成的产品在货架商店的占比不断提高,这推动了消费后再生树脂的应用。同时,聚乙烯价格的波动迫使生产商实现原料多元化,并透过新的机械回收业务(例如位于印第安纳州的Nova-Novolex工厂)来确保供应。品牌商正寻求透过香味产品吸引消费者,而B2B买家则优先考虑能够承受大量纸板类电商废弃物的商用内衬袋。
北美垃圾袋市场趋势与分析
扩大住宅垃圾处理和州立掩埋转移目标
强制性废弃物分流政策正在重塑废弃物收集方式,鼓励市政当局在公共采购中指定使用经认证的可堆肥或再生材料製成的垃圾袋。加州SB 1383法案使沙加缅度市的有机物回收率提高了14%,同时同期掩埋量减少了10%。加拿大拟议的甲烷排放法规旨在2030年将掩埋排放减少50%,这项目标正促使公共采用符合ASTM D6400标准的有机垃圾袋[CANADA.CA]。这些法规正在推动市政竞标数量的成长,尤其是容量为13-30加仑、适合挨家挨户收集的垃圾袋。
财富500强企业做出零浪费承诺
公司层级的废弃物分流目标正促使多家门市的采购部门签订大型长期合约。 Cox Enterprises 已从掩埋转移了 7.5 亿磅(约 34 万吨)垃圾,其废弃物项目的经济价值估计为 3.4 亿美元。 Target 目前在美国 1,680 个地点处理有机废弃物,营运废弃物分流率已达 85%。这些项目需要统一的 SKU 规格、透明薄膜分拣袋以及可同时处理食物垃圾和纸板残渣的工业可堆肥内衬。
聚乙烯和生质塑胶原料价格波动
受墨西哥湾沿岸飓风引发的停工影响,聚乙烯库存紧张,生产商要求将合约价格提高每磅0.05至0.07美元。受此影响,买家随即削减库存至18天,使加工商面临价格飙升的风险。类似的波动也影响生物聚合物市场。发酵槽的生产依赖玉米和醣类原料,而这些原料的价格也有波动。利润率的不确定性可能会阻碍对新挤出生产线的资本投资,并延迟创新产品的商业化上市。
细分市场分析
到2025年,北美地区住宅垃圾袋市场仍将占最大份额,达到45.65%。这主要得益于厨房垃圾袋在超市货架上的持续销售,而这又得益于上门垃圾收集和计量型(PAYT)定价模式的推广。然而,从汽车工厂到资料中心园区,工业买家的采购量正以7.88%的复合年增长率持续成长,直到2031年。许多公司都设定了零掩埋目标,因此要求使用更厚的垃圾袋来装金属屑、树脂颗粒和大型包装材料。供应商合约通常会将颜色编码的分类垃圾袋、防静电桶内衬和55加仑的建筑垃圾袋捆绑销售,从而推高了工业垃圾袋的平均售价,使其高于住宅垃圾袋。
工业市场的扩张反映了强劲的建筑支出和製造业回流。大型计划会产生集中的废弃物,并带来可预测的托盘大小的订单,从而降低加工商的物流成本。因此,随着新工厂运作以及现有设施维修废弃物分类区以符合环境、社会和治理 (ESG) 指标,预计到 2030 年,北美垃圾袋市场中工业用垃圾袋的份额将接近住宅用垃圾袋的份额。
由于低密度聚乙烯(LDPE)兼具抗撕裂性和成本效益,预计到2025年其市占率将维持在41.05%。然而,监管支持正在推动符合ASTM D6400认证标准的塑胶袋的普及,使该细分市场以7.74%的复合年增长率成长。加州SB 1046法案规定,自2025年起,超市结帐前使用的可生物降解塑胶袋直径必须为15英吋或更大。这促使超级市场连锁店推出与厨房有机食品袋相容的可生物降解垃圾袋。同时,对机械回收的投资正在提高再生LDPE颗粒的透明度,这有助于在缺乏认证堆肥设施的地区维持消费者对传统薄膜的接受度。
总体而言,北美垃圾袋市场正朝着双轨制模式发展:主流的低密度聚乙烯(LDPE)或高密度聚乙烯(HDPE)垃圾袋用于城市废弃物,而高端可生物降解垃圾袋则用于有机废弃物,并带有品牌主导的可持续发展讯息。这种产品分化使加工商能够柔软性满足区域监管要求,同时避免原材料价格波动所带来的风险。
其他福利:
- Excel格式的市场预测(ME)表
- 3个月的分析师支持
目录
第一章 引言
- 研究假设和市场定义
- 调查范围
第二章调查方法
第三章执行摘要
第四章 市场情势
- 市场概览
- 市场驱动因素
- 扩大住宅垃圾处理和州立掩埋转移目标
- 财富 500 强公司设施的零浪费声明
- 电子商务包装的快速周转率导致商业垃圾增加。
- 市政计量型(PAYT)垃圾处理方案正在加速垃圾袋的使用。
- 由于高透明度和再生树脂含量高(这一领域关注度较低),因此定价较高。
- 医疗保健和食品服务业采用抗菌衬垫(这一趋势鲜为人知)
- 市场限制
- 挥发性聚乙烯和生质塑胶塑胶原料价格
- 一次性塑胶禁令及生产者延伸责任(EPR)法
- 可重复使用托特包的推出导致零售 SKU 蚕食。
- 透过加强对排放排放的监测,遏制低品质班轮的进口
- 价值/供应链分析
- 监管环境
- 技术展望
- 波特五力分析
- 供应商的议价能力
- 买方的议价能力
- 新进入者的威胁
- 替代品的威胁
- 竞争对手之间的竞争
- 调味剂和添加剂配方趋势
第五章 市场规模与成长预测
- 最终用户
- 住宅
- 商业
- 产业
- 依产品类型
- 低密度聚乙烯(LDPE)袋
- 高密度聚苯乙烯(HDPE)袋
- 可生物降解/可堆肥袋
- 以体积(加仑)
- 少于 8 加仑(浴室)
- 8至30加仑(厨房用)
- 30至55加仑(建设业)
- 55加仑以上(工业桶内衬)
- 按物质来源
- 原生塑胶
- 再生塑胶
- 混合型(再生+原生)
- 生物基树脂
- 按销售管道
- 线下零售(杂货店、量贩店)
- 线上零售
- 清洁及卫生用品/公共事业经销
- 按国家/地区
- 美国
- 加拿大
第六章 竞争情势
- 市场集中度
- 策略趋势
- 市占率分析
- 公司简介
- Reynolds Consumer Products Inc.(Hefty)
- The Clorox Company(Glad Products Company)
- Novolex Holdings LLC
- Inteplast Group Corporation
- Riverside Paper Co. Inc.
- Cosmoplast Industrial Company LLC
- International Plastics Inc.
- Poly-America LP
- Four Star Plastics Inc.
- Neway Packaging Corporation
- All American Poly Corp.
- Aluf Plastics Inc.
- Petoskey Plastics Inc.
- Heritage Bag Company
- Crown Poly Inc.
- WasteZero Inc.
- Matrix Packaging LLC
- Elkay Plastics Co. Inc.
- Interplast Packaging LLC
- Super Bag Corp.
- RollPak Corp.
- Boulder Bag Company
第七章 市场机会与未来展望
The North America trash bags market was valued at USD 3.70 billion in 2025 and estimated to grow from USD 3.98 billion in 2026 to reach USD 5.76 billion by 2031, at a CAGR of 7.66% during the forecast period (2026-2031).
Sustained growth in the municipal waste stream, regulatory incentives for landfill diversion, and corporate zero-waste mandates continue to drive demand across residential, commercial, and industrial channels. State pay-as-you-throw (PAYT) schemes, most notably in New England, continue to lift per-capita bag purchase. Biodegradable and recycled-content products are gaining shelf space as seven U.S. states roll out extended producer responsibility (EPR) laws that incentivize the adoption of post-consumer resin. At the same time, polyethylene price volatility has forced producers to diversify their feedstocks and secure supply through new mechanical recycling ventures, including the Nova-Novolex plant in Indiana. Brand owners are courting consumers with scent-infused SKUs, while B2B buyers prioritize contractor-grade liners that withstand heavy, cardboard-rich e-commerce refuse.
North America Trash Bags Market Trends and Insights
Residential Waste-Stream Expansion and State Landfill-Diversion Targets
Mandatory diversion policies are reshaping waste collection norms, prompting municipalities to specify certified compostable or recycled-content liners in public procurement. California's SB 1383 has already increased organic recycling tonnage by 14% in Sacramento, while landfill inputs fell by 10% during the same period. Canada's draft methane rule aims for a 50% reduction in landfill emissions by 2030, a goal that encourages public facilities to adopt ASTM D6400-compliant organics bags [CANADA.CA]. Such rules keep municipal bid volumes growing, particularly for 13-30 gallon liners that fit curbside carts
Corporate Zero-Waste Pledges from Fortune 500 Facilities
Enterprise-wide diversion targets are converting multi-site buyers into large, long-term accounts. Cox Enterprises has diverted 750 million lb from landfill and credited waste programs with USD 340 million in financial value. Target now processes organics at 1,680 U.S. locations and has already reached 85% operational diversion. These programs demand consistent SKU specifications, clear-film sortation bags, and industrial compostable liners that can handle food scraps and corrugated offcuts simultaneously.
Volatile Polyethylene and Bioplastic Feedstock Prices
Polyethylene spot values fell 11.95% year-on-year in 2025 after hurricane-linked outages on the Gulf Coast squeezed inventories before producers pushed a USD 0.05-0.07-per-lb contract hike. Buyers responded by trimming stock cover to 18 days, leaving converters exposed to price spikes. Similar volatility affects biopolymer markets, where fermenter output depends on corn and sugar feedstocks, which have their own price fluctuations. Margin uncertainty hinders capital investment in new extrusion lines and can delay the commercial launch of innovative SKUs.
Other drivers and restraints analyzed in the detailed report include:
- Rapid E-Commerce Packaging Turnover Elevating Commercial Trash Volume
- Municipal Pay-As-You-Throw Programs Accelerating Bag Consumption
- Single-Use-Plastic Bans and Extended-Producer-Responsibility Laws
For complete list of drivers and restraints, kindly check the Table Of Contents.
Segment Analysis
The residential channel still accounts for the largest slice of the North America trash bags market size, posting 45.65% share in 2025 as curbside collection and PAYT schemes keep kitchen liners moving through grocery aisles. Yet, industrial buyers, from automotive plants to data center campuses, are ramping up purchases at a 7.88% CAGR through 2031. Many are locked into zero-landfill targets that necessitate heavier-gauge liners rated for metal shavings, resin pellets, or bulky packaging. Supplier contracts often bundle color-coded segregation bags, anti-static drum liners, and 55-gallon builders' sacks, boosting average selling price relative to household SKUs.
Industrial volume gains reflect healthy construction spending and the onshoring of manufacturing. Large projects generate concentrated waste nodes, creating predictable, pallet-level orders that shave logistics costs for converters. The North America trash bags market share for industrial applications is therefore expected to approach the residential share by decade-end as new plants come online and legacy facilities retrofit waste-sorting zones to meet ESG metrics.
LDPE retained 41.05% revenue share in 2025 thanks to its balance of tear resistance and cost efficiency. However, legislative tailwinds are sending ASTM D6400-certified bags up the adoption curve, with the sub-category tracking a 7.74% CAGR. California's SB 1046 requires compostable pre-checkout bags with a minimum 15-inch mouth width, effective starting in 2025. Echo effects include supermarket chains sourcing matching compostable trash liners for back-of-house organics totes. At the same time, mechanical-recycling investments are improving the clarity of recycled LDPE pellets, helping traditional film retain customer loyalty where certified composting facilities remain scarce.
Overall, the North America trash bags market is shifting toward a dual-portfolio model, featuring mainstream LDPE or HDPE for general refuse and premium-priced biodegradable options for organics, as well as brand-led sustainability messaging. This bifurcation provides converters with the flexibility to hedge against feedstock swings while meeting regional compliance requirements.
The North America Trash Bags Market Report is Segmented by End User (Residential, Commercial, Industrial), Product Type (LDPE Bags, HDPE Bags and More), Capacity (< 8 Gal, 8-30 Gal, 30-55 Gal, > 55 Gal), Material Source (Virgin Plastic, Post-Consumer Recycled Plastic, Hybrid, Bio-Based Resins), Sales Channel (Offline Retail, and More), and Geography (United States, Canada). The Market Forecasts are Provided in Terms of Value (USD).
List of Companies Covered in this Report:
- Reynolds Consumer Products Inc. (Hefty)
- The Clorox Company (Glad Products Company)
- Novolex Holdings LLC
- Inteplast Group Corporation
- Riverside Paper Co. Inc.
- Cosmoplast Industrial Company LLC
- International Plastics Inc.
- Poly-America L.P.
- Four Star Plastics Inc.
- Neway Packaging Corporation
- All American Poly Corp.
- Aluf Plastics Inc.
- Petoskey Plastics Inc.
- Heritage Bag Company
- Crown Poly Inc.
- WasteZero Inc.
- Matrix Packaging LLC
- Elkay Plastics Co. Inc.
- Interplast Packaging LLC
- Super Bag Corp.
- RollPak Corp.
- Boulder Bag Company
Additional Benefits:
- The market estimate (ME) sheet in Excel format
- 3 months of analyst support
TABLE OF CONTENTS
1 INTRODUCTION
- 1.1 Study Assumptions and Market Definition
- 1.2 Scope of the Study
2 RESEARCH METHODOLOGY
3 EXECUTIVE SUMMARY
4 MARKET LANDSCAPE
- 4.1 Market Overview
- 4.2 Market Drivers
- 4.2.1 Residential waste-stream expansion and state landfill-diversion targets
- 4.2.2 Corporate zero-waste pledges from Fortune 500 facilities
- 4.2.3 Rapid e-commerce packaging turnover elevating commercial trash volume
- 4.2.4 Municipal pay-as-you-throw (PAYT) programs accelerating bag consumption
- 4.2.5 High-clarity, recycled-content resins enabling premium pricing (under-the-radar)
- 4.2.6 Adoption of anti-microbial liners in healthcare and foodservice (under-the-radar)
- 4.3 Market Restraints
- 4.3.1 Volatile polyethylene and bioplastic feedstock prices
- 4.3.2 Single-use-plastic bans and extended-producer-responsibility (EPR) laws
- 4.3.3 Retail SKU cannibalization from reusable tote initiatives
- 4.3.4 Logistics emissions scrutiny curbing import of low-grade liners
- 4.4 Value / Supply-Chain Analysis
- 4.5 Regulatory Landscape
- 4.6 Technological Outlook
- 4.7 Porter's Five Forces Analysis
- 4.7.1 Bargaining Power of Suppliers
- 4.7.2 Bargaining Power of Buyers
- 4.7.3 Threat of New Entrants
- 4.7.4 Threat of Substitutes
- 4.7.5 Intensity of Competitive Rivalry
- 4.8 Fragrance and additive formulation trends
5 MARKET SIZE AND GROWTH FORECASTS (VALUE)
- 5.1 By End User
- 5.1.1 Residential
- 5.1.2 Commercial
- 5.1.3 Industrial
- 5.2 By Product Type
- 5.2.1 Low-Density Polyethylene (LDPE) Bags
- 5.2.2 High-Density Polyethylene (HDPE) Bags
- 5.2.3 Biodegradable / Compostable Bags
- 5.3 By Capacity (Gallons)
- 5.3.1 < 8 Gal (Bathroom)
- 5.3.2 8 - 30 Gal (Kitchen)
- 5.3.3 30 - 55 Gal (Contractor)
- 5.3.4 > 55 Gal (Industrial Drum Liners)
- 5.4 By Material Source
- 5.4.1 Virgin Plastic
- 5.4.2 Post-Consumer Recycled Plastic
- 5.4.3 Hybrid (Recycled + Virgin)
- 5.4.4 Bio-based Resins
- 5.5 By Sales Channel
- 5.5.1 Offline Retail (Grocery, Mass Merchandiser)
- 5.5.2 Online Retail
- 5.5.3 Jan-San / Institutional Distribution
- 5.6 By Country
- 5.6.1 United States
- 5.6.2 Canada
6 COMPETITIVE LANDSCAPE
- 6.1 Market Concentration
- 6.2 Strategic Moves
- 6.3 Market Share Analysis
- 6.4 Company Profiles (includes Global level Overview, Market level overview, Core Segments, Financials as available, Strategic Information, Market Rank/Share for key companies, Products and Services, and Recent Developments)
- 6.4.1 Reynolds Consumer Products Inc. (Hefty)
- 6.4.2 The Clorox Company (Glad Products Company)
- 6.4.3 Novolex Holdings LLC
- 6.4.4 Inteplast Group Corporation
- 6.4.5 Riverside Paper Co. Inc.
- 6.4.6 Cosmoplast Industrial Company LLC
- 6.4.7 International Plastics Inc.
- 6.4.8 Poly-America L.P.
- 6.4.9 Four Star Plastics Inc.
- 6.4.10 Neway Packaging Corporation
- 6.4.11 All American Poly Corp.
- 6.4.12 Aluf Plastics Inc.
- 6.4.13 Petoskey Plastics Inc.
- 6.4.14 Heritage Bag Company
- 6.4.15 Crown Poly Inc.
- 6.4.16 WasteZero Inc.
- 6.4.17 Matrix Packaging LLC
- 6.4.18 Elkay Plastics Co. Inc.
- 6.4.19 Interplast Packaging LLC
- 6.4.20 Super Bag Corp.
- 6.4.21 RollPak Corp.
- 6.4.22 Boulder Bag Company
7 MARKET OPPORTUNITIES AND FUTURE OUTLOOK
- 7.1 White-space and Unmet-Need Assessment
 一次性垃圾袋市场:依材质、厚度、尺寸、封口方式、应用和分销管道划分-2026-2032年全球市场预测垃圾袋市场:产品类型、材质、厚度、颜色、通路、应用、最终用途-2026-2032年全球市场预测
 垃圾袋市场报告:按类型、材质、尺寸、分销管道、最终用户和地区划分(2026-2034 年)
 垃圾袋:市占率分析、产业趋势与统计、成长预测(2026-2031)
 全球垃圾袋市场规模、份额、趋势和成长分析报告(2026-2034年)
 2026年全球垃圾袋市场报告汽车垃圾袋市场按类型、分销管道、材料、最终用户和销售划分-全球预测(2026-2032 年)
 垃圾袋市场规模、份额和成长分析(按材料、类型和地区划分)-2026-2033年产业预测
 户外垃圾桶市场-全球产业规模、份额、趋势、机会和预测,按产品类型(脚踏式垃圾桶、感应式垃圾桶、其他)、应用领域(住宅、商业)、地区和竞争格局划分,2020-2030年预测
 垃圾袋的全球市场:材料类型·产品类型·容量·终端用户产业·流通管道·各地区 (~2035年)