


 |
市场调查报告书
商品编码
1940605
垃圾袋:市占率分析、产业趋势与统计、成长预测(2026-2031)Trash Bags - Market Share Analysis, Industry Trends & Statistics, Growth Forecasts (2026 - 2031) |
||||||
※ 本网页内容可能与最新版本有所差异。详细情况请与我们联繫。
2025年垃圾袋市值为135.3亿美元,预计到2031年将达到193.7亿美元,而2026年为143.6亿美元。
预计在预测期(2026-2031 年)内,复合年增长率将达到 6.15%。
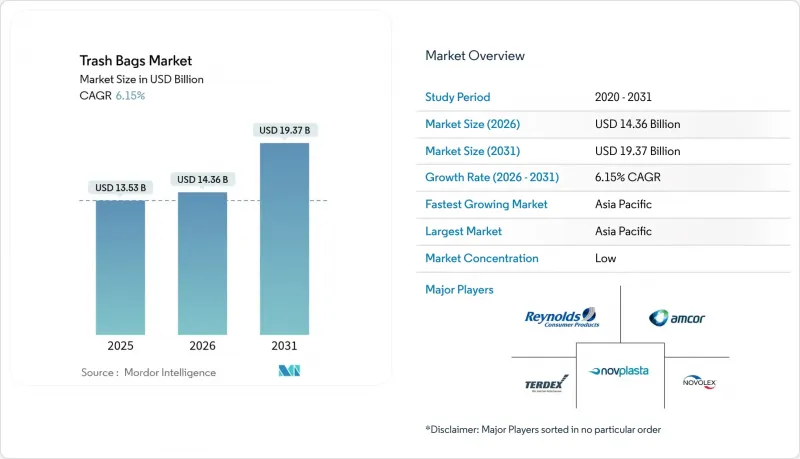
快速的都市化导致城市固态废弃物量不断增加,而计量型(PAYT)和更严格的生产者责任制正在重新定义产品规格,从而推动了对高品质、合规垃圾袋的需求。亚太地区仍然是最大的区域消费市场,受益于不断成长的中产阶级和日益完善的基础设施。在北美和欧洲等成熟市场,一次性塑胶法规的压力正在加速向再生塑胶和生物基薄膜的转型。同时,乙烯价格的波动持续挤压加工商的利润空间,导致生产商之间的整合加剧。
全球垃圾袋市场趋势与洞察
都市区废弃物产生量不断增加,以及无缝收集的必要性日益凸显。
预计到2023年,都市固态废弃物量将达到21亿吨,2050年将达到38亿吨。目前,都市区正在为自动垃圾收集车指定使用防刺穿、统一规格的垃圾袋,这推动了垃圾袋市场的成长。先导计画,使燃料消耗降低了28%,收集效率提高了41.5%。这些变化正在推动对能够在高温气候下保持形状并能抵抗长期储存劣化的薄膜的需求。
疫情后注重卫生的消费行为
到2024年,医院将减少2.641亿磅废弃物掩埋,其中68%的医院已实施永续采购措施。这促使医疗机构的采购部门优先考虑抗菌除臭内衬。为了满足这项需求,诸如蛋壳混合EGU袋等高端产品已于2025年问世。旅馆业也出现了类似的趋势,推高了平均售价,并支撑了机构市场9.67%的复合年增长率。
禁止使用一次性塑胶製品和生产者延伸责任制
加州SB 54法案规定,到2032年一次性塑胶的使用量必须减少25%,并要求设立5亿美元的年度清理基金。不列颠哥伦比亚省和欧盟的类似法规将处置成本转嫁给生产商,并鼓励对再生材料和可堆肥替代品进行投资。然而,合规的复杂性推高了成本,限制了低利润供应商的进入,并抑制了垃圾袋市场的短期成长。
细分市场分析
儘管住宅袋市场主要由医疗机构、住宿设施和教育机构等机构用户驱动,在2025年占总收入的63.78%,但预计到2031年,其年复合成长率(CAGR)将达到9.58%。医院的永续采购政策和更严格的感染控制通讯协定正在推动垃圾袋市场对抗菌防漏内衬的需求。机构买家更注重性能和合规性而非价格,因此支持采用再生材料和生物基材料製成的高端产品。住宅垃圾袋市场的需求仍然以销量主导,并受到按需付费计划和品牌忠诚度的支持,但价格敏感度较高,限制了其成长。
机构市场的快速成长促使供应商优化其基于规格的产品供应,并专注于签订多年合约。同时,居民用户越来越多地更换香味增强垃圾袋,推高了平均单价。随着市政当局大力推广垃圾分类,这两个用户群体都越来越多地采用经过认证的颜色编码垃圾袋,进一步扩大了垃圾袋市场。
低密度聚乙烯(LDPE)将占据垃圾袋市场最大份额,市占率高达38.41%,这主要得益于其价格优势和成熟的生产流程。然而,生物基塑料,例如聚乳酸(PLA)和聚羟基脂肪酸酯(PHA),预计将以10.42%的复合年增长率增长,这主要得益于企业净零排放承诺和相关投资,例如NatureWorks在泰国投资3.5亿美元建设的PLA工厂。在分解速度较慢的潮湿热带地区,可堆肥塑胶仍然稀少,但监管激励措施正在缩小成本差距。同时,高密度聚乙烯(HDPE)和线性低密度聚乙烯(LLDPE)薄膜正越来越多地采用消费后回收树脂,以维持其市场份额。
儘管设备升级和认证壁垒限制了材料加速转化,但不断上涨的掩埋税和生产者延伸责任制(EPR)成本持续削弱化石基树脂的成本优势。能够将循环利用与机械强度相结合的供应商,最有希望在不断扩大的垃圾袋市场份额中占据一席之地,成为永续替代品的有力竞争者。
区域分析
预计到2025年,亚太地区将占全球收入的40.32%,并在2031年之前以8.05%的复合年增长率增长,这主要得益于中国和印度的城市扩张以及中产阶级消费的增长。在韩国和日本,人工智慧分类机器人正在帮助增加再生高密度聚乙烯(HDPE)的供应,而热带气候则阻碍了可堆肥袋的推广应用。不同国家的禁令及回收目标各不相同,这要求全球供应商采取灵活的筹资策略。
在北美,成熟的基础设施正基于加州SB54等生产者延伸责任制(EPR)法律不断发展完善,加速再生材料和生物基内衬的转型。已在6000个城市实施的计量型付费(PAYT)回收系统规定了认证的垃圾袋尺寸,从而支撑了稳定的单位需求,并促进了高附加价值产品比例的提升。专注于卫生家庭的高级产品,例如Glad于2025年4月推出的双倍强度垃圾袋,也正在出现。
欧洲正积极推行循环经济政策,并大力推行再生材料使用政策。德国的回收池系统和法国即将推出的押金返还计划,标誌着全部区域欧洲正朝着减少废弃物的方向迈进。像Cyca Flex这样的包装製造商,如今提供100%可回收薄膜,其中至少含有5%的消费后再生材料(PCR),这进一步巩固了欧洲作为永续标竿的地位。
其他福利:
- Excel格式的市场预测(ME)表
- 3个月的分析师支持
目录
第一章 引言
- 研究假设和市场定义
- 调查范围
第二章调查方法
第三章执行摘要
第四章 市场情势
- 市场概览
- 市场驱动因素
- 都市区废弃物产生量不断增加,以及无缝收集的必要性日益凸显。
- 疫情后注重卫生的消费行为
- 计量型(PAYT)市政收费模式的兴起
- 随着网路食品杂货销售的成长,对防漏衬垫的需求也在成长。
- 生质塑胶与低密度聚乙烯/线性低密度聚乙烯原料的价格平行化
- 配备人工智慧的机器人分类机促进了再生高密度聚乙烯的供应
- 市场限制
- 禁止使用一次性塑胶製品和生产者延伸责任制
- 乙烯价格波动对转换企业的利润率带来压力。
- 潮湿气候下可堆肥袋的性能差距
- 零售连锁店正越来越多地试用可重复填充和再利用站。
- 供应链分析
- 监管环境
- 技术展望
- 波特五力模型
- 新进入者的威胁
- 买方的议价能力
- 供应商的议价能力
- 替代品的威胁
- 竞争对手之间的竞争
第五章 市场规模与成长预测
- 最终用户
- 住宅
- 机构(餐饮旅馆业、医疗、教育)
- 商业和工业
- 依材料类型
- 高密度聚苯乙烯(HDPE)
- 低密度聚乙烯(LDPE)
- 线型低密度聚乙烯(LLDPE)
- 生物基/生物分解性塑胶(PLA、PBAT、PHA)
- 依体积/按袋装
- 最多 10 加仑
- 13至30加仑
- 30至55加仑
- 55加仑或更多
- 按销售管道
- 零售(超级市场、便利商店、线上)
- B2B/机构采购
- 分销/批发
- 按地区
- 北美洲
- 我们
- 加拿大
- 墨西哥
- 欧洲
- 德国
- 英国
- 法国
- 义大利
- 西班牙
- 俄罗斯
- 其他欧洲地区
- 亚太地区
- 中国
- 印度
- 日本
- 韩国
- 澳洲和纽西兰
- 亚太其他地区
- 中东和非洲
- 中东
- 阿拉伯聯合大公国
- 沙乌地阿拉伯
- 土耳其
- 其他中东地区
- 非洲
- 南非
- 奈及利亚
- 埃及
- 其他非洲地区
- 中东
- 南美洲
- 巴西
- 阿根廷
- 其他南美洲
- 北美洲
第六章 竞争情势
- 市场集中度
- 策略趋势
- 市占率分析
- 公司简介
- Amcor Plc
- Reynolds Consumer Products(Hefty)
- The Clorox Company(Glad)
- Novolex Holdings LLC
- Inteplast Group Ltd.
- Poly-America LP
- Pack-It BV
- Kemii Garbage Bag Co. Ltd.
- Cosmoplast Industrial Co. LLC
- Luban Packing LLC
- International Plastics Inc.
- Novplasta sro
- Terdex GmbH
- Simplehuman LLC
- Ruffies/Pactiv Evergreen
- WasteZero Inc.
- Al-Sinai Plastic Factory
- Abu Dawood Group(Pekoe)
- Thai Plastic Bag Industry Co. Ltd.
- Crown Poly Inc.
第七章 市场机会与未来展望
The trash bags market was valued at USD 13.53 billion in 2025 and estimated to grow from USD 14.36 billion in 2026 to reach USD 19.37 billion by 2031, at a CAGR of 6.15% during the forecast period (2026-2031).
Rapid urbanization is swelling municipal solid-waste volumes, while pay-as-you-throw (PAYT) schemes and stricter producer-responsibility rules are redefining product specifications and boosting demand for premium, compliant liners. Asia-Pacific remains the largest regional consumer, benefitting from expanding middle-class populations and infrastructure upgrades. Mature markets in North America and Europe, pressured by single-use-plastic curbs, are accelerating shifts toward recycled and bio-based film grades. At the same time, volatile ethylene pricing continues to squeeze converter margins, reinforcing consolidation among producers.
Global Trash Bags Market Trends and Insights
High-Urban Waste Generation and Need for Seamless Collection
Municipal solid-waste volumes reached 2.1 billion t in 2023 and are on track for 3.8 billion t by 2050. Cities now specify puncture-resistant, uniform liners compatible with automated trucks, spurring growth of the trash bags market. IoT-enabled bins paired with AI route optimization have cut fuel use 28% and lifted collection efficiency 41.5% in pilot projects. These shifts increase demand for films that hold shape in high-heat climates and resist extended storage degradation.
Hygiene-Centric Consumer Behaviour Post-Pandemics
Hospitals diverted 264.1 million lb of waste from landfills in 2024, and 68% adopted sustainable purchasing rules, pushing institutional buyers toward antimicrobial, odor-neutralizing liners. Premium SKUs such as eggshell-infused EGU bags debuted in 2025 to capture this demand. Similar trends in hospitality are lifting average selling prices and underpinning the institutional segment's 9.67% CAGR.
Single-Use-Plastic Bans and Extended-Producer Responsibility
California's SB 54 compels a 25% cut in single-use plastics by 2032 and requires USD 500 million in annual cleanup funding. Similar mandates in British Columbia and the EU shift disposal costs to producers, forcing investments in recycled content and compostable alternatives. Compliance complexity elevates costs and limits access for low-margin suppliers, restraining near-term expansion of the trash bags market.
Other drivers and restraints analyzed in the detailed report include:
- Rise of PAYT Municipal Fee Models
- Expansion of Online Grocery Demanding Leak-Proof Liners
- Volatile Ethylene Prices Squeezing Converter Margins
For complete list of drivers and restraints, kindly check the Table Of Contents.
Segment Analysis
Institutional users-healthcare, hospitality and education-propelled 9.58% CAGR to 2031, even as the residential segment retained 63.78% of 2025 revenue. Hospitals' sustainable procurement policies and stricter infection-control protocols are driving demand for antimicrobial, leak-proof liners in the trash bags market. Institutional buyers value performance and compliance over price, supporting premium SKUs with recycled or bio-based content. Residential demand remains volume-driven, buoyed by PAYT programs and brand loyalty but constrained by price sensitivity.
The institutional upsurge encourages suppliers to refine spec-based offerings and secure multi-year contracts. At the same time, household buyers increasingly trade up to scented or reinforced bags, expanding average unit values. As city governments introduce differentiated collection streams, both user groups are turning to certified color-coded liners, further enlarging the trash bags market.
LDPE held the largest 38.41% trash bags market share in 2025 thanks to price and process familiarity. Yet bio-based plastics such as PLA and PHA are poised for 10.42% CAGR, catalyzed by corporate net-zero pledges and investments like NatureWorks' USD 350 million PLA plant in Thailand. Compostable grades still lag in humid tropics where degradation rates slow, but regulatory incentives are narrowing cost gaps. HDPE and LLDPE films, meanwhile, are integrating post-consumer resin to maintain market relevance.
Equipment upgrades and certification hurdles are tempering a swift material shift, yet rising landfill levies and EPR fees continue to erode the cost advantage of fossil-based resins. Suppliers that can merge circular content with mechanical strength are best positioned to capture the expanding trash bags market size for sustainable variants.
The Trash Bags Market Report is Segmented by End-User (Residential, Institutional, Commercial and Industrial), Material Type (HDPE, LDPE, LLDPE, Bio-based/Biodegradable Plastics), Capacity/Bag Size (Up To 10 Gallon, 13-30 Gallon, 30-55 Gallon, Above 55 Gallon), Sales Channel (Retail, B2B/Institutional Procurement, Distribution/Wholesale), and Geography. The Market Forecasts are Provided in Terms of Value (USD).
Geography Analysis
Asia-Pacific generated 40.32% of global revenue in 2025 and is on track for an 8.05% CAGR to 2031, driven by urban sprawl in China and India and widening middle-class consumption. AI-enabled sorting robots in South Korea and Japan are lifting recycled-HDPE availability, while tropical climates complicate compostable-bag deployment. Diverse national bans and recycling targets require flexible sourcing strategies for global suppliers.
North America's mature infrastructure is evolving under EPR legislation such as California's SB 54, prompting a pivot to recycled and bio-based liners. PAYT programs in 6,000 communities now dictate certified bag sizes, underpinning stable unit demand and supporting a higher-value mix. Premium innovations, including Glad's 2X stronger bags launched in April 2025, cater to hygiene-aware households.
Europe's circular-economy agenda is spurring aggressive recycled-content mandates. Germany's reuse pools and France's incoming deposit-return schemes exemplify region-wide momentum toward waste reduction. Packaging groups such as Saica Flex now market 100% recyclable films with minimum 5% PCR, consolidating Europe's position as a bellwether for sustainable standards.
- Amcor Plc
- Reynolds Consumer Products (Hefty)
- The Clorox Company (Glad)
- Novolex Holdings LLC
- Inteplast Group Ltd.
- Poly-America LP
- Pack-It BV
- Kemii Garbage Bag Co. Ltd.
- Cosmoplast Industrial Co. LLC
- Luban Packing LLC
- International Plastics Inc.
- Novplasta s.r.o.
- Terdex GmbH
- Simplehuman LLC
- Ruffies / Pactiv Evergreen
- WasteZero Inc.
- Al-Sinai Plastic Factory
- Abu Dawood Group (Pekoe)
- Thai Plastic Bag Industry Co. Ltd.
- Crown Poly Inc.
Additional Benefits:
- The market estimate (ME) sheet in Excel format
- 3 months of analyst support
TABLE OF CONTENTS
1 INTRODUCTION
- 1.1 Study Assumptions and Market Definition
- 1.2 Scope of the Study
2 RESEARCH METHODOLOGY
3 EXECUTIVE SUMMARY
4 MARKET LANDSCAPE
- 4.1 Market Overview
- 4.2 Market Drivers
- 4.2.1 High-urban waste generation and need for seamless collection
- 4.2.2 Hygiene-centric consumer behaviour post-pandemics
- 4.2.3 Rise of pay-as-you-throw (PAYT) municipal fee models
- 4.2.4 Expansion of on-line grocery demanding leak-proof liners
- 4.2.5 Bioplastic price parity with LDPE/LLDPE feedstocks
- 4.2.6 AI-enabled robotic sorters boosting recycled-HDPE supply
- 4.3 Market Restraints
- 4.3.1 Single-use-plastic bans and extended-producer?responsibility
- 4.3.2 Volatile ethylene prices squeezing converter margins
- 4.3.3 Compostable-bag performance gaps in humid climates
- 4.3.4 Growing refill/reuse station pilots in retail chains
- 4.4 Supply-Chain Analysis
- 4.5 Regulatory Landscape
- 4.6 Technological Outlook
- 4.7 Porter's Five Forces
- 4.7.1 Threat of New Entrants
- 4.7.2 Bargaining Power of Buyers
- 4.7.3 Bargaining Power of Suppliers
- 4.7.4 Threat of Substitutes
- 4.7.5 Competitive Rivalry
5 MARKET SIZE AND GROWTH FORECASTS (VALUE)
- 5.1 By End-user
- 5.1.1 Residential
- 5.1.2 Institutional (HoReCa, Healthcare, Education)
- 5.1.3 Commercial and Industrial
- 5.2 By Material Type
- 5.2.1 High-Density Polyethylene (HDPE)
- 5.2.2 Low-Density Polyethylene (LDPE)
- 5.2.3 Linear Low-Density Polyethylene (LLDPE)
- 5.2.4 Bio-based/Biodegradable Plastics (PLA, PBAT, PHA)
- 5.3 By Capacity / Bag Size
- 5.3.1 Up to 10 Gallon
- 5.3.2 13 - 30 Gallon
- 5.3.3 30 - 55 Gallon
- 5.3.4 Above 55 Gallon
- 5.4 By Sales Channel
- 5.4.1 Retail (Supermarkets, Convenience, Online)
- 5.4.2 B2B / Institutional Procurement
- 5.4.3 Distribution / Wholesale
- 5.5 By Geography
- 5.5.1 North America
- 5.5.1.1 United States
- 5.5.1.2 Canada
- 5.5.1.3 Mexico
- 5.5.2 Europe
- 5.5.2.1 Germany
- 5.5.2.2 United Kingdom
- 5.5.2.3 France
- 5.5.2.4 Italy
- 5.5.2.5 Spain
- 5.5.2.6 Russia
- 5.5.2.7 Rest of Europe
- 5.5.3 Asia-Pacific
- 5.5.3.1 China
- 5.5.3.2 India
- 5.5.3.3 Japan
- 5.5.3.4 South Korea
- 5.5.3.5 Australia and New Zealand
- 5.5.3.6 Rest of Asia-Pacific
- 5.5.4 Middle East and Africa
- 5.5.4.1 Middle East
- 5.5.4.1.1 United Arab Emirates
- 5.5.4.1.2 Saudi Arabia
- 5.5.4.1.3 Turkey
- 5.5.4.1.4 Rest of Middle East
- 5.5.4.2 Africa
- 5.5.4.2.1 South Africa
- 5.5.4.2.2 Nigeria
- 5.5.4.2.3 Egypt
- 5.5.4.2.4 Rest of Africa
- 5.5.4.1 Middle East
- 5.5.5 South America
- 5.5.5.1 Brazil
- 5.5.5.2 Argentina
- 5.5.5.3 Rest of South America
- 5.5.1 North America
6 COMPETITIVE LANDSCAPE
- 6.1 Market Concentration
- 6.2 Strategic Moves
- 6.3 Market Share Analysis
- 6.4 Company Profiles (includes Global level Overview, Market level overview, Core Segments, Financials as available, Strategic Information, Market Rank/Share for key companies, Products and Services, and Recent Developments)
- 6.4.1 Amcor Plc
- 6.4.2 Reynolds Consumer Products (Hefty)
- 6.4.3 The Clorox Company (Glad)
- 6.4.4 Novolex Holdings LLC
- 6.4.5 Inteplast Group Ltd.
- 6.4.6 Poly-America LP
- 6.4.7 Pack-It BV
- 6.4.8 Kemii Garbage Bag Co. Ltd.
- 6.4.9 Cosmoplast Industrial Co. LLC
- 6.4.10 Luban Packing LLC
- 6.4.11 International Plastics Inc.
- 6.4.12 Novplasta s.r.o.
- 6.4.13 Terdex GmbH
- 6.4.14 Simplehuman LLC
- 6.4.15 Ruffies / Pactiv Evergreen
- 6.4.16 WasteZero Inc.
- 6.4.17 Al-Sinai Plastic Factory
- 6.4.18 Abu Dawood Group (Pekoe)
- 6.4.19 Thai Plastic Bag Industry Co. Ltd.
- 6.4.20 Crown Poly Inc.
7 MARKET OPPORTUNITIES AND FUTURE OUTLOOK
- 7.1 White-space and Unmet-need Assessment
 一次性垃圾袋市场:依材质、厚度、尺寸、封口方式、应用和分销管道划分-2026-2032年全球市场预测垃圾袋市场:产品类型、材质、厚度、颜色、通路、应用、最终用途-2026-2032年全球市场预测
 垃圾袋市场报告:按类型、材质、尺寸、分销管道、最终用户和地区划分(2026-2034 年)
 全球垃圾袋市场规模、份额、趋势和成长分析报告(2026-2034年)
 2026年全球垃圾袋市场报告汽车垃圾袋市场按类型、分销管道、材料、最终用户和销售划分-全球预测(2026-2032 年)
 北美垃圾袋:市占率分析、产业趋势与统计、成长预测(2026-2031)
 垃圾袋市场规模、份额和成长分析(按材料、类型和地区划分)-2026-2033年产业预测
 户外垃圾桶市场-全球产业规模、份额、趋势、机会和预测,按产品类型(脚踏式垃圾桶、感应式垃圾桶、其他)、应用领域(住宅、商业)、地区和竞争格局划分,2020-2030年预测
 垃圾袋的全球市场:材料类型·产品类型·容量·终端用户产业·流通管道·各地区 (~2035年)