


 |
市场调查报告书
商品编码
1911477
商业软体:市场占有率分析、产业趋势与统计、成长预测(2026-2031)Business Software - Market Share Analysis, Industry Trends & Statistics, Growth Forecasts (2026 - 2031) |
||||||
※ 本网页内容可能与最新版本有所差异。详细情况请与我们联繫。
据估计,到 2026 年,商业软体市场价值将达到 7,373 亿美元,高于 2025 年的 6,600 亿美元,预计到 2031 年将达到 1,2817 亿美元,2026 年至 2031 年的年复合成长率(CAGR)为 11.71%。
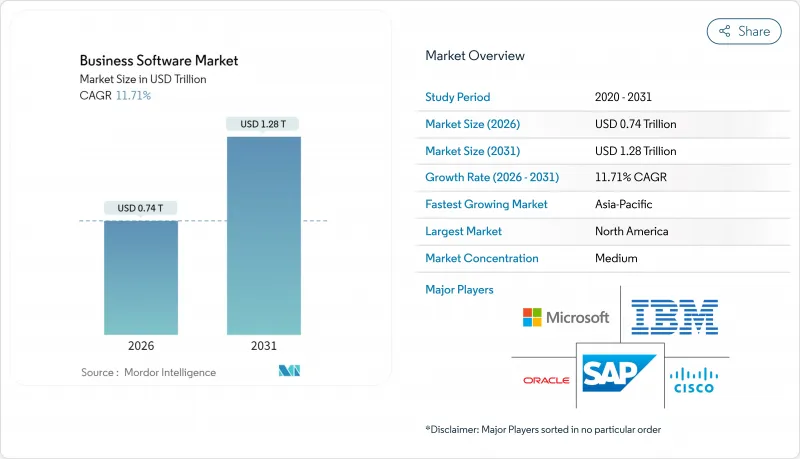
这种快速扩张反映了企业向人工智慧驱动的工作流程自动化、云端原生部署以及将分析直接嵌入业务流程的资料中心架构的转变。企业对审核的ESG报告的需求、重建具有韧性的区域供应链的需要以及低程式码开发平台的普及,都在推动新的支出成长。随着现有平台供应商与提供更低整体拥有成本 (TCO) 的人工智慧新兴企业和开放原始码套件竞争,竞争压力日益加剧。订阅定价模式虽然带来了经常性收入,但也增加了客户获取成本,迫使供应商改善基于价值的打包方案和云端成本优化产品。区域成长轨迹正在分化:北美负责人专注于人工智慧集成,亚太地区企业正在推行云端优先部署,而欧洲企业则在寻求符合主权要求的解决方案,以应对GDPR和新的资料在地化义务。
全球商业软体市场趋势与洞察
引进人工智慧驱动的工作流程自动化
智慧自动化工具的应用正远远超越基于规则的机器人,转向能够协调ERP、CRM和协作套件中各项任务的AI代理。微软已将Copilot代理程式嵌入Office和Dynamics,并利用自然语言提示重塑端对端工作流程。 Citizens Bank在其软体工程部门部署AI代码产生助手后,生产力提高了20%。一项更广泛的跨产业研究报告显示,功能性生产力提升了30%至55%。随着供应商整合来自其整合架构的上下文数据,自动化提升的不再只是任务速度,而是决策品质。领先采用者拥有显着优势,而后进企业仍在苦苦挣扎于缺乏自适应智慧的传统脚本工具。
转向订阅/SaaS收入模式
到2025年,超过一半的美国企业将透过SaaS模式运行其关键业务软体,从而创造超过1000亿美元的全新B2B商机。这种转变使供应商的收入与客户价值更加紧密地联繫在一起,也因此提升了客户流失管理和基本契约的重要性。越南的一项研究发现,付费使用制能够缓解现金流压力,因此中小企业的采用率高于大型企业。供应商正在将人工智慧融入收费引擎,以创建个人化的分级方案并视觉化消费趋势,而企业也在同步采用财务营运(FinOps)方法来减少不必要的授权。成本透明度的提高意味着供应商的差异化优势取决于可衡量的投资报酬率(ROI),这就需要更精确的产品蓝图和完善的售后成功计画。
优化云端支出的压力日益增大
经济不确定性加剧了企业对云端帐单的审查,促使他们采用人工智慧驱动的成本管治工具,以实现实例规模的自动调整和资源的自动分配。英特尔报告称,全球客户在实施持续优化框架后,成本节省了 34%。财务营运团队正在将这些洞察融入采购流程,以遏制供应商许可证的扩张并延长续约谈判时间。为了维持市场份额,软体供应商除了要量化功能优势外,还必须量化效率提升。
细分市场分析
至2025年,ERP解决方案将占总营收的25.74%,凸显其在商业软体市场中作为业务线基石的地位。大型製造商、零售商和公共部门机构依靠整合的财务、采购和生产模组来维持流程规范。然而,随着企业优先考虑数据驱动的决策週期,预计到2031年,分析平台的复合年增长率将达到12.05%。烘焙连锁店St-Donat实施了一套食品专用云ERP解决方案,该方案具备批次追踪和行动订单输入功能,取代了其传统的会计工具,预算为35万美元。同时,自助式BI套件正在普及高级视觉化和预测建模功能,蚕食成熟ERP产品的成长动能。
这波分析科技浪潮与经营团队对预测性预测、自动化资料叙事和嵌入式人工智慧建议的需求不谋而合。供应商们正将即时仪錶板嵌入ERP工作平台,而专业供应商则透过专注于临床试验绩效和全通路行销归因等垂直关键绩效指标(KPI)来更快地扩展业务规模。随着合规要求的不断提高,审核范围也随之扩大,财务、人力资源和计划合模组的需求依然稳定,而ESG报告工具则在「其他」类别中涌现。 UL Solutions和Workiva各自推出了能够捕捉整个供应链排放数据的碳核算引擎,反映了向永续发展的更广泛转变。
预计2025年,云端采用将占企业软体市场规模的59.12%,复合年增长率(CAGR)为13.45%。 95%的企业已将至少一项关键业务工作负载迁移到公共云端或混合云端,以实现弹性扩展和更快的功能交付週期。微软和Oracle已将多重云端互连扩展到新的全球区域,使客户无需重新架构即可将资料库部署在更靠近分析引擎的位置。在亚太地区,5G的部署和政府支援的资料中心计画正在进一步缩短迁移时间。
由于对主权和延迟的担忧,本地部署在金融、国防和医疗保健行业仍然是强劲的趋势。供应商现在提供容器化版本的技术栈,允许客户在私有丛集和公共云端之间迁移工作负载,同时保持许可和支援权限。主权云端服务使欧洲银行能够在国内託管受监管的数据,从而在合规性和云端经济性之间取得平衡。对于物流和製造业的客户而言,边缘运算蓝图正在兴起,它将工厂车间亚毫秒级的反应速度与集中式分析控制相结合。
商业软体市场按软体类型(ERP、CRM、商业智慧与分析等)、部署模式(云端、本地部署)、最终用户产业(银行、金融服务和保险、医疗保健与生命科学、政府与公共部门等)、组织规模(大型企业、中小企业)和地区进行细分。市场预测以美元计价。
区域分析
北美地区拥有成熟的云端基础设施和严格的产业监管,预计到2025年将占全球商业软体市场收入的25.05%。微软计划在2025年投入167.5亿美元资本支出,以满足美国日益增长的人工智慧训练能力需求。加拿大银行正在采用符合主权标准的SaaS解决方案,墨西哥製造商则在推动工厂数位化,以优化近岸外包工作流程。该地区的关注点正从基础的云端迁移转向人工智慧驱动的生产力提升,这可能会使支出超出传统的授权续费成本。
亚太地区是成长最快的区域,预计到2031年将以12.52%的复合年增长率成长。在中国,企业软体已融入政府主导的数位经济计划,本土供应商也积极适应国内的云端政策。日本正致力于开发提高员工生产力的平台,以应对人口结构变化带来的压力;而印度快速成长的中小型企业则利用低程式码套件来规范其营运。新加坡和香港正作为区域云端集线器,为东南亚的电子商务企业提供延迟要求极高的服务。
其他福利:
- Excel格式的市场预测(ME)表
- 3个月的分析师支持
目录
第一章 引言
- 研究假设和市场定义
- 调查范围
第二章调查方法
第三章执行摘要
第四章 市场情势
- 市场概览
- 市场驱动因素
- 基于人工智慧的工作流程自动化的采用现状
- 转向订阅/SaaS收入模式
- 对统一资料架构的需求
- 利用低程式码/无程式码平台进行公民开发
- 加强环境、社会及公司治理(ESG)及永续发展报告的要求
- 近岸外包与弹性数位供应链
- 市场限制
- 优化云端支出的压力日益增大
- 开放原始码替代方案的兴起
- 数据主权和跨境合规的障碍
- 特定领域执行人员短缺
- 供应链分析
- 监管环境
- 技术展望
- 波特五力分析
- 供应商的议价能力
- 买方的议价能力
- 新进入者的威胁
- 替代品的威胁
- 竞争对手之间的竞争
- 评估市场中的宏观经济因素
第五章 市场规模与成长预测
- 依软体类型
- ERP
- CRM
- 商业智慧与分析
- 供应链管理
- 人力资源管理
- 财会
- 计划和组合管理
- 其他的
- 透过部署
- 云
- 本地部署
- 按最终用户行业划分
- BFSI
- 医疗保健和生命科学
- 政府和公共部门
- 零售与电子商务
- 运输/物流
- 製造业
- 通讯与媒体
- 其他的
- 按组织规模
- 大公司
- 小型企业
- 按地区
- 北美洲
- 美国
- 加拿大
- 墨西哥
- 南美洲
- 巴西
- 阿根廷
- 南美洲其他地区
- 欧洲
- 德国
- 英国
- 法国
- 义大利
- 西班牙
- 其他欧洲地区
- 亚太地区
- 中国
- 日本
- 印度
- 韩国
- 东南亚
- 亚太其他地区
- 中东和非洲
- 中东
- 沙乌地阿拉伯
- 阿拉伯聯合大公国
- 土耳其
- 其他中东地区
- 非洲
- 南非
- 奈及利亚
- 埃及
- 其他非洲地区
- 中东
- 北美洲
第六章 竞争情势
- 市场集中度
- 策略趋势
- 市占率分析
- 公司简介
- Microsoft Corporation
- International Business Machines Corporation
- Oracle Corporation
- SAP SE
- Cisco Systems Inc.
- Salesforce Inc.
- Adobe Inc.
- Intuit Inc.
- Sage Group plc
- Workday Inc.
- ServiceNow Inc.
- Epicor Software Corporation
- Infor
- Oracle NetSuite
- Accenture plc
- Deltek Inc.
- Zoho Corporation
- Atlassian Corporation
- Freshworks Inc.
- HubSpot Inc.
- Odoo SA
第七章 市场机会与未来展望
Business software market size in 2026 is estimated at USD 737.3 billion, growing from 2025 value of USD 660 billion with 2031 projections showing USD 1,281.7 billion, growing at 11.71% CAGR over 2026-2031.
This rapid expansion reflects enterprises' pivot toward AI-enabled workflow automation, cloud-native deployment, and data-centric architectures that embed analytics directly into operational processes. Corporate demands for auditable ESG reporting, the need to rebuild resilient regional supply chains, and the mainstreaming of low-code development platforms each fuel fresh spending streams. Competitive pressure intensifies as incumbent platform vendors contend with AI-native challengers and open-source suites that offer lower total cost of ownership. Subscription pricing models deepen recurring revenue yet elevate customer acquisition costs, prompting vendors to refine value-based packaging and cloud cost-optimization services. Regional growth trajectories diverge: North American buyers focus on AI integration, Asia-Pacific organizations pursue cloud-first adoption, and European firms seek sovereignty-compliant offerings to meet GDPR and emerging data-localization mandates.
Global Business Software Market Trends and Insights
AI-powered workflow automation adoption
Adoption of intelligent automation tools has moved far beyond rule-based bots as AI agents orchestrate tasks across ERP, CRM, and collaboration suites. Microsoft embedded Copilot agents across Office and Dynamics, enabling natural-language prompts that restructure end-to-end workflows.Citizens Bank realized 20% productivity gains in software engineering after deploying AI code-generation assistants, while broader cross-industry studies cite functional productivity lifts of 30-55%. Vendors integrate contextual data from unified fabrics, so automation now drives decision quality rather than pure task speed. Early adopters secure defensible advantages as laggards struggle with legacy scripting tools lacking adaptive intelligence.
Shift to subscription / SaaS revenue models
More than half of U.S. enterprises will run core software via SaaS by 2025, unlocking over USD 100 billion in fresh B2B opportunity. The move aligns vendor income with customer value, yet raises stakes for churn management and usage-based contracting. Vietnamese research shows SME adoption outpacing large enterprises because pay-as-you-go pricing eases cash-flow constraints. Vendors embed AI in billing engines to personalize tiers and surface consumption insights, but enterprises simultaneously adopt FinOps practices to trim redundant seats. As cost visibility grows, provider differentiation hinges on measurable ROI, forcing sharper product road-mapping and post-sale success programs.
Escalating cloud spend optimization pressure
Economic uncertainty accelerates scrutiny of cloud invoices, prompting enterprises to deploy AI-powered cost-governance tools that right-size instances and automate de-allocation. Intel documented 34% savings for a global client after implementing continuous optimization frameworks. FinOps teams integrate these insights into procurement cycles, dampening vendor-license expansion and stretching renewal negotiations. Software providers must now quantify efficiency gains alongside functional benefits to retain wallet share.
Other drivers and restraints analyzed in the detailed report include:
- Demand for unified data fabrics
- Low-code / no-code platforms in citizen development
- Growing open-source alternatives
For complete list of drivers and restraints, kindly check the Table Of Contents.
Segment Analysis
ERP solutions accounted for 25.74% of 2025 revenue, underscoring their role as the transactional backbone of the business software market. Large manufacturers, retailers, and public agencies rely on integrated finance, procurement, and production modules to maintain process discipline. Still, analytics platforms record a 12.05% CAGR through 2031 as companies prioritize data-driven decision cycles. Bakery chain St-Donat replaced legacy accounting tools with a food-specific cloud ERP that delivered lot traceability and mobile order capture on a USD 350,000 budget. In parallel, self-service BI suites democratize advanced visualization and predictive modeling, siphoning growth momentum from mature ERP lines.
The analytics wave coincides with executives' push for predictive forecasting, automated data storytelling, and embedded AI recommendations. Vendors embed real-time dashboards into ERP workbenches, yet specialist providers scale faster by focusing on vertical KPIs such as clinical-trial performance or omnichannel marketing attribution. Finance, HR, and project-portfolio modules keep steady demand as compliance mandates expand audit scope, while ESG reporting tools emerge inside the "other" category. UL Solutions and Workiva each bundle carbon-accounting engines that capture emissions data across supply networks, reflecting the broader sustainability pivot.
Cloud deployments captured 59.12% of the business software market size in 2025 and are set to climb at a 13.45% CAGR. Ninety-five percent of enterprises have shifted at least one mission-critical workload to public or hybrid clouds, pursuing elastic scalability and faster feature cadence. Microsoft and Oracle extended their multi-cloud interconnect to new global regions, enabling customers to place databases near analytic engines without re-architecture. In APAC, 5G rollouts and state-backed datacenter programs compress migration timelines further.
On-premise installations persist in finance, defense, and healthcare where sovereignty or latency concerns prevail. Vendors now ship containerized versions of their stacks so clients can move workloads between private clusters and public clouds while preserving licensing and support entitlements. Sovereign-cloud services allow European banks to host regulated data inside national borders, blending compliance with cloud economics. Edge-computing blueprints emerge for logistics and manufacturing clients that require sub-millisecond response at plant sites yet central governance for analytics.
Business Software Market is Segmented by Software Type (ERP, CRM, Business Intelligence and Analytics, and More), Deployment (Cloud, On-Premises), End-User Industry (BFSI, Healthcare and Life Sciences, Government and Public Sector, and More), Organization Size (Large Enterprises, Smes), and by Geography. The Market Forecasts are Provided in Terms of Value (USD).
Geography Analysis
North America retained 25.05% of 2025 revenue in the business software market, supported by mature cloud infrastructure and stringent sectoral regulations. Microsoft invested USD 16.75 billion in 2025 capital expenditures to keep pace with rising U.S. demand for AI training capacity. Canadian banks deploy sovereignty-compliant SaaS, while Mexican manufacturers digitize shop-floors to optimize near-shoring workflows. The region's focus shifts from basic cloud migration to AI-infused productivity, expanding addressable spending beyond traditional license uplift.
Asia-Pacific is the fastest-growing geography, advancing at a 12.52% CAGR through 2031. China embeds enterprise software into government-led digital-economy initiatives, and local vendors harmonize with domestic cloud policies. Japan pursues workforce-productivity platforms to offset demographic pressures, whereas India's booming SME segment harnesses low-code suites to formalize operations. Singapore and Hong Kong anchor regional cloud hubs, supplying latency-sensitive services to Southeast Asian e-commerce merchants.
- Microsoft Corporation
- International Business Machines Corporation
- Oracle Corporation
- SAP SE
- Cisco Systems Inc.
- Salesforce Inc.
- Adobe Inc.
- Intuit Inc.
- Sage Group plc
- Workday Inc.
- ServiceNow Inc.
- Epicor Software Corporation
- Infor
- Oracle NetSuite
- Accenture plc
- Deltek Inc.
- Zoho Corporation
- Atlassian Corporation
- Freshworks Inc.
- HubSpot Inc.
- Odoo S.A.
Additional Benefits:
- The market estimate (ME) sheet in Excel format
- 3 months of analyst support
TABLE OF CONTENTS
1 INTRODUCTION
- 1.1 Study Assumptions and Market Definition
- 1.2 Scope of the Study
2 RESEARCH METHODOLOGY
3 EXECUTIVE SUMMARY
4 MARKET LANDSCAPE
- 4.1 Market Overview
- 4.2 Market Drivers
- 4.2.1 AI-powered workflow automation adoption
- 4.2.2 Shift to subscription / SaaS revenue models
- 4.2.3 Demand for unified data fabrics
- 4.2.4 Low-code / no-code platforms in citizen development
- 4.2.5 Rising ESG and sustainability reporting mandates
- 4.2.6 Near-shoring and resilient digital supply chains
- 4.3 Market Restraints
- 4.3.1 Escalating cloud spend optimization pressure
- 4.3.2 Growing open-source alternatives
- 4.3.3 Data-sovereignty and cross-border compliance hurdles
- 4.3.4 Shortage of domain-specific implementation talent
- 4.4 Supply-Chain Analysis
- 4.5 Regulatory Landscape
- 4.6 Technological Outlook
- 4.7 Porter's Five Forces Analysis
- 4.7.1 Bargaining Power of Suppliers
- 4.7.2 Bargaining Power of Buyers
- 4.7.3 Threat of New Entrants
- 4.7.4 Threat of Substitutes
- 4.7.5 Intensity of Competitive Rivalry
- 4.8 Assesment of Macroeconomic Factors on the market
5 MARKET SIZE AND GROWTH FORECASTS (VALUE)
- 5.1 By Software Type
- 5.1.1 ERP
- 5.1.2 CRM
- 5.1.3 Business Intelligence and Analytics
- 5.1.4 Supply Chain Management
- 5.1.5 Human Resource Management
- 5.1.6 Finance and Accounting
- 5.1.7 Project and Portfolio Management
- 5.1.8 Others
- 5.2 By Deployment
- 5.2.1 Cloud
- 5.2.2 On-Premise
- 5.3 By End-User Industry
- 5.3.1 BFSI
- 5.3.2 Healthcare and Life Sciences
- 5.3.3 Government and Public Sector
- 5.3.4 Retail and E-commerce
- 5.3.5 Transportation and Logistics
- 5.3.6 Manufacturing
- 5.3.7 Telecommunications and Media
- 5.3.8 Others
- 5.4 By Organization Size
- 5.4.1 Large Enterprises
- 5.4.2 Small and Medium Enterprises
- 5.5 By Geography
- 5.5.1 North America
- 5.5.1.1 United States
- 5.5.1.2 Canada
- 5.5.1.3 Mexico
- 5.5.2 South America
- 5.5.2.1 Brazil
- 5.5.2.2 Argentina
- 5.5.2.3 Rest of South America
- 5.5.3 Europe
- 5.5.3.1 Germany
- 5.5.3.2 United Kingdom
- 5.5.3.3 France
- 5.5.3.4 Italy
- 5.5.3.5 Spain
- 5.5.3.6 Rest of Europe
- 5.5.4 Asia-Pacific
- 5.5.4.1 China
- 5.5.4.2 Japan
- 5.5.4.3 India
- 5.5.4.4 South Korea
- 5.5.4.5 Southeast Asia
- 5.5.4.6 Rest of Asia-Pacific
- 5.5.5 Middle East and Africa
- 5.5.5.1 Middle East
- 5.5.5.1.1 Saudi Arabia
- 5.5.5.1.2 United Arab Emirates
- 5.5.5.1.3 Turkey
- 5.5.5.1.4 Rest of Middle East
- 5.5.5.2 Africa
- 5.5.5.2.1 South Africa
- 5.5.5.2.2 Nigeria
- 5.5.5.2.3 Egypt
- 5.5.5.2.4 Rest of Africa
- 5.5.5.1 Middle East
- 5.5.1 North America
6 COMPETITIVE LANDSCAPE
- 6.1 Market Concentration
- 6.2 Strategic Moves
- 6.3 Market Share Analysis
- 6.4 Company Profiles (includes Global level Overview, Market level overview, Core Segments, Financials as available, Strategic Information, Market Rank/Share for key companies, Products and Services, and Recent Developments)
- 6.4.1 Microsoft Corporation
- 6.4.2 International Business Machines Corporation
- 6.4.3 Oracle Corporation
- 6.4.4 SAP SE
- 6.4.5 Cisco Systems Inc.
- 6.4.6 Salesforce Inc.
- 6.4.7 Adobe Inc.
- 6.4.8 Intuit Inc.
- 6.4.9 Sage Group plc
- 6.4.10 Workday Inc.
- 6.4.11 ServiceNow Inc.
- 6.4.12 Epicor Software Corporation
- 6.4.13 Infor
- 6.4.14 Oracle NetSuite
- 6.4.15 Accenture plc
- 6.4.16 Deltek Inc.
- 6.4.17 Zoho Corporation
- 6.4.18 Atlassian Corporation
- 6.4.19 Freshworks Inc.
- 6.4.20 HubSpot Inc.
- 6.4.21 Odoo S.A.
7 MARKET OPPORTUNITIES AND FUTURE OUTLOOK
- 7.1 White-space and Unmet-Need Assessment
 2026年全球商业计划审查服务市场报告
 2026-2030年全球商业软体服务市场
 商业软体和服务市场分析及预测(至2035年):按类型、产品类型、服务、技术、组件、应用、部署类型、最终用户、模组和功能划分
 商业软体服务市场-全球产业规模、份额、趋势、机会和预测:按软体、服务、公司规模、最终用户、地区和竞争格局划分,2021-2031年
 智慧选股服务软体市场:依部署模式、定价模式和最终用户类型划分-全球预测(2026-2032年)
 企业秘书软体市场规模、份额和成长分析(按组件、部署类型、组织规模、产业垂直领域和地区划分)-2026-2033年产业预测商业软体及服务市场:2025-2032年全球预测(按组件、部署方式、组织规模、应用和产业划分)
 商业软体和服务市场:按软体、按服务、按部署、按公司规模、按最终用途、按地区
 商业软体和服务市场规模、份额、趋势分析报告:按软体、服务、部署、最终用途、公司规模、地区、细分市场预测,2025-2030 年
 欧洲商业软体市场:份额分析、产业趋势与统计、成长预测(2025-2030 年)